Skip past header information
USGS - science for a changing world
CZM logo with link to CZM home page

U.S. Geological Survey Open-File Report 2007-1373

High-Resolution Geologic Mapping of the Inner Continental Shelf: Cape Ann to Salisbury Beach, Massachusetts


Skip past contents informationTitle Page / Table of Contents / List of Figures / Introduction / Maps / Data Collection/Processing / Interpretation / Summary / Acknowledgments / References Cited / Appendix 1 / Appendix 2 / Appendix 3 / Appendix 4 / Appendix 5
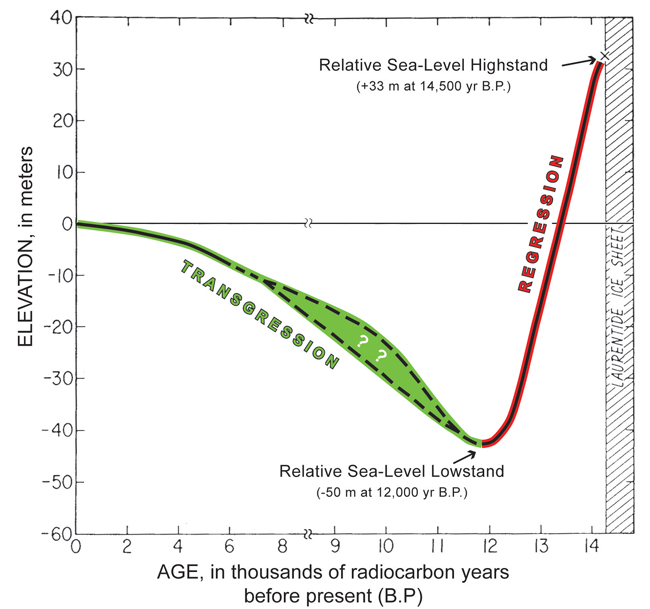

Figure 1.2. Late Quaternary relative sea-level curve for northeastern Massachusetts (modified from Oldale and others, 1993). Over the last 14,500 years, relative sea level fell from a highstand of about +33 m to a lowstand of about -50 m, and then rose at varying rates to the present. The large fluctuations in relative sea level drove regression (red shading) and transgression (green shading) of the shoreline across the inner continental shelf. Dashed lines indicate uncertainty during the early to middle Holocene. Note that the age scale changes at 8,000 years B.P.


Figure 1.2.
  Late Quaternary relative sea-level curve for northeastern Massachusetts (modified from Oldale and others, 1993).  Over the last 14,500 years, relative sea level fell from a highstand of about +33 m to a lowstand of about –50 m, and then rose at varying rates to the present.  The large fluctuations in relative sea level drove regression (red shading) and transgression (green shading) of the shoreline across the inner continental shelf.  Dashed lines indicate uncertainty during the early to middle Holocene.  Note that the age scale changes at 8,000 years B.P.

Click here for a larger JPG image

Skip USGS links group

Accessibility FOIA Privacy Policies and Notices

Take Pride in America logo USAGov logo U.S. Department of the Interior | U.S. Geological Survey
End of USGS links group