U.S. Geological Survey Open-File Report 2007-1373
High-Resolution Geologic Mapping of the Inner Continental Shelf: Cape Ann to Salisbury Beach, Massachusetts

|
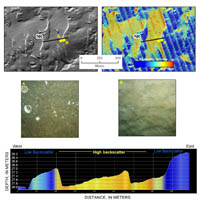
Mapping Seafloor GeologyThe seafloor in the Gulf of Maine is geologically complex because of its late Quaternary history of glaciation and sea-level change. In rocky areas, the rugged seafloor exhibits abrupt changes in water depth (fig. 3.3), and different substrates create a distinct patchiness that changes over distances of only a few meters (fig. 3.4). For example, high-relief bouldery glacial deposits (till) are locally exposed on the seafloor in close proximity to flat-lying deposits of finer sediment (sand, mud). Rocky areas also contain isolated accumulations of shelly sediment ponded in small cracks and other low-lying areas between rock outcrops. These variations occur over spatial scales that are smaller than a typical sampling grid can resolve. Early efforts to characterize the texture of seafloor sediments at regional scales were based on bottom samples collected at widely spaced locations (Trumbull, 1972; Hollister, 1973; Schlee, 1973; Folger and others, 1975; Poppe and others, 1989), but this sampling scheme would be impractical on most parts of the Massachusetts inner continental shelf. An extraordinarily large number of closely spaced samples would be required to fully characterize the variations in bottom type that exist in the region. This study integrates remotely sensed geophysical data with bottom samples and underwater photography to characterize seafloor geology at a broad, regional scale. Two different approaches are used to depict the nature and distribution of rocks and sediment deposits on the inner shelf: a qualitative classification based on geologic interpretation and a more quantitative bottom classification based on statistical methods.
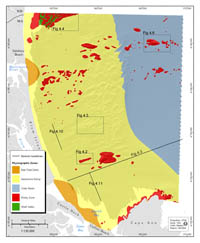
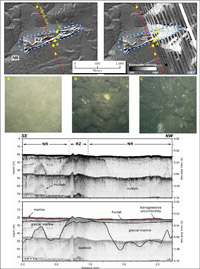
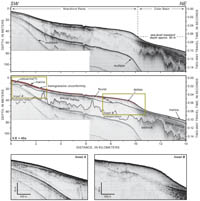
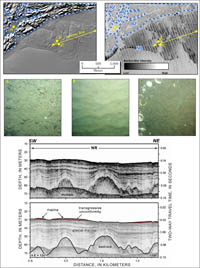
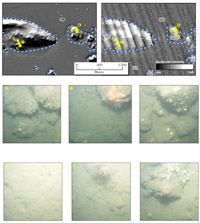
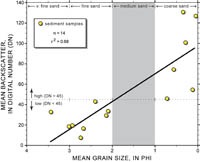
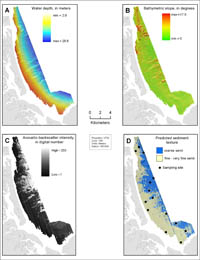
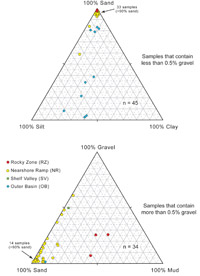
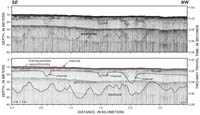
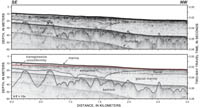
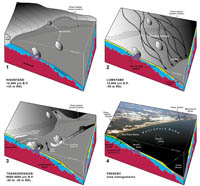
Interpretive Geologic MappingThe geology of the study area is characterized on the basis of seafloor morphology, sediment thickness, and the type of surficial materials. This description results in a classification scheme with five environments or physiographic zones: Rocky Zones, Nearshore Ramps, Ebb-Tidal Deltas, Shelf Valleys, and Outer Basins (fig. 4.1). Maps using these zones provide a broad regional view of seafloor geology and have been produced for other areas in the Gulf of Maine that are similar to the Massachusetts inner shelf (Kelley and others, 1989; Kelley and Belknap, 1991; Barnhardt and Kelley, 1995; Barnhardt and others, 1996). The zones are described below in terms of their size, morphology, physical setting, and substrate properties. Rocky Zones (RZ) are rugged areas of high relief and hard bottom. Ledge and coarse-grained sediment in these areas produce extreme bathymetric relief ranging from nearly vertical rock cliffs to relatively flat, gravel-covered plains littered with large boulders (fig. 4.2). Although local areas of ledge and coarse-grained sediment are in all physiographic zones, they dominate the seafloor in Rocky Zones. In general, sediment thickness is 1 m or less. Abundant shell fragments locally accumulate in sediment ponds that fill low-lying troughs. The ponded sediment is covered with bedforms and gravelly scour surfaces that are evidence of active reworking by waves and bottom currents. The sandy bedforms are variously classified as megaripples or subaqueous dunes (Ashley, 1990) with wavelengths of 15 to 20 m. Areas of Rocky Zone were found in four general locations (fig. 4.1). The largest expanses were in the northern and southern parts of the study area, representing the offshore extensions of hard granitic rocks that underlie the adjacent coast (Zen and others, 1983). Rocky Zones primarily consist of ledge and coarse-grained talus with shells of benthic-dwelling organisms around the base of outcrops. These high-relief areas are offshore of Salisbury Beach as part of a prominent series of rock outcrops that trend northeastward towards the Isles of Shoals and surround the northern coast of Cape Ann as a narrow band. Relatively small, separate patches of Rocky Zone are unevenly distributed throughout the central part of the study area. They range from 2500 m² (approximately 50 m by 50 m, the smallest mappable unit) to 2 km² in area and from elongate to circular in plan view, commonly with a highly irregular outline. These moderate-relief, acoustically reflective features are seaward of the Merrimack River mouth in a broad, widely spaced series that extends in a generally SW-NE direction and seaward of the entrance to Plum Island Sound in an isolated group about 5 km offshore. Rocky Zones are the third largest physiographic element, composing 18.3 km² or 5.1 percent of the study area (table 4.1). Water depths above Rocky zones range from 0 to 90 m. Nearshore Ramps (NR) are gently sloping areas of sandy or gravelly seafloor that lie offshore of sandy beaches. This zone exhibits generally shore-parallel bathymetric contours and is primarily covered with sand-rich sediment, although locally small exposures of ledge, cobbles, and boulders are also on the seafloor. Nearshore Ramp terminates on the landward side against the mainland shoreline. On the seaward side, it extends about 10 km offshore to a depth of 50 m, where it merges with muddy sediment in the deeper Outer Basin (fig. 4.3). The extensive Nearshore Ramp abuts sandy beaches from Salisbury Beach in the north to Coffins Beach in the south (fig. 4.1). The generally smooth, seaward-dipping seafloor is underlain by Holocene fluvial, deltaic, and littoral sediments that have accumulated above Pleistocene glacial and glacial-marine deposits. Relative ages of these deposits are determined from stratigraphic superposition, primarily whether they lie above or below the transgressive unconformity that separates the Pleistocene and Holocene sedimentary sequences. The transgressive unconformity lies at or very near the seafloor beneath a relatively thin, discontinuous cover of sandy Holocene sediment (fig. 4.4). This mobile Holocene sediment is up to 9 m thick (fig. 3.6). Analysis of the sediment-thickness map indicates that the sandy surficial deposit contains an estimated volume of 121 million m³. The deposit mainly consists of fine-grained sand with a gravelly lag at the base that coincides with the transgressive unconformity. It is important to note, however, that the seismic-reflection system is not able to resolve sediment thicknesses less than 0.5 m. Therefore, the volume is a conservative estimate because it is based on the assumption that Holocene sediment is absent over relatively large areas of the inner shelf. The actual volume would increase if those areas, shown by the dark gray shading in figure 3.6, were covered with a layer of Holocene sediment that is 0.5 m thick. In the offshore area, the volume of Holocene sediment was not calculated because the spacing between seismic-reflection profiles was too wide. A complex mosaic of surficial sediment covers the Nearshore Ramp, which is characterized by numerous, irregularly shaped patches of high- and low-backscatter intensity (fig. 3.4). The different patches of sediment are distinguished by sharp boundaries, giving the seafloor an overall mottled appearance. Sediment texture differs significantly across the backscatter transitions. High-backscatter patches represent coarse sand to fine gravel (mean is 0.6 phi) and are characterized by small two-dimensional dunes (Ashley, 1990) with wavelengths of about 1 m. Low-backscatter patches represent fine to medium sand (mean is 2.4 phi) that are characterized by long-wavelength (100–800 m), asymmetrical bedforms. The amplitudes of these broad, low-relief bedforms typically range from 10 to 50 cm but locally can exceed 1 m. The slightly elevated crests exhibit low backscatter, whereas adjacent, shallow troughs (topographic depressions) exhibit high backscatter (fig. 4.5). The bedforms exhibit variable orientations, which indicates that different processes are acting to move sediment in different directions (Hein and others, 2007). The smooth, generally sandy seafloor of the Nearshore Ramp is the most prominent physiographic element, composing 228.4 km² or 63.9 percent of the study area (table 4.1). Water depths range from 0 to 50 m. Ebb-Tidal Deltas (ETD) are sandy shoals and tidal channels located on the seaward sides of inlets. These broad, shallow platforms are lobate in plan view, have relatively steep slopes along their seaward-facing margins, and extend about 1.5 km offshore from the coast. In the study area, ebb-tidal deltas are characterized by fine to medium sand that was deposited where tidal currents exit an inlet and interact with waves and currents of the open ocean (FitzGerald and others, 2002). The sandy shoals are dynamic features that evolve over time in response to changes in the magnitude and direction of local sediment-transport processes. Ebb-tidal deltas have formed seaward of three inlets along the barrier-island chain north of Cape Ann: (1) the Merrimack River mouth, (2) the entrance to Plum Island Sound, and (3) the entrance to Essex Bay (fig. 4.1). Only small areas along the terminal lobes of these shoal features were imaged in this survey because of shallow water. The lobes were delineated largely based on interpretations of air photographs and NOAA nautical charts 1378, 1379, and 1382. Large jetties built at the mouth of the Merrimack River and extensive dredging of the navigation channel have greatly altered the natural system. The ebb-tidal deltas associated with Plum Island Sound and Essex Bay merge into a single broad platform that extends offshore of Castle Neck and Coffins Beach. No jetties have been built at these inlets. Ebb-tidal deltas compose 10.6 km² or 3.0 percent of the study area (table 4.1). Water depths are less than about 8 m. Shelf Valleys (SV) are elongate depressions that cut through areas of Rocky Zone (fig. 4.4). Sediment in Shelf Valleys is highly variable, ranging from gravel to muddy sand. Highly reflective aprons of coarse material with abundant shell fragments typically lie adjacent to rocky, bouldery walls that form the valley margins. The single sediment sample that was collected from a Shelf Valley contained 50 percent gravel and 47 percent sand, with a mean grain size of –0.99 phi, one of the coarsest sediment textures found in this study (table 4.2). Shelf Valleys were formed only in the northern part of the study area, where they generally trend from NE to SW (fig. 4.1). The valleys are small, measuring less than 0.5 km wide and up to 2 km long, but clearly extend beyond the mapped area. They have a gently sloping bottom and, in plan view, exhibit a branching geometry that is analogous to dendritic river valleys on land. The valleys probably formed by fluvial erosion during times of lower sea level, although they have no obvious terrestrial source; the heads of the small valleys do not correlate with modern stream valleys onshore. They terminate on their seaward end against Nearshore Ramps in water depths of 20 to 25 m. Of all the physiographic elements mapped in this study, Shelf Valley is the smallest, composing only 1.1 km² or 0.3 percent of the study area (table 4.1). Water depths range from about 12 to 25 m. Outer Basins (OB) are extensive areas of muddy seafloor that generally form the seaward border of the inner continental shelf of New England. The basins lie in water deeper than 50 m, below the depth of the postglacial lowstand of sea level, and might reach depths of over 300 m in the outer Gulf of Maine (Kelley and others, 1989). The generally flat seafloor exhibits low backscatter in sidescan-sonar imagery but also includes isolated deposits of coarse-grained sediment and bedrock outcrops (fig. 4.6). The 20 sediment samples collected from the Outer Basin (Table 4.2) range in texture from fine sand (mean is 2.4 phi) to clayey silt (mean is 7.5 phi). A single, large Outer Basin lies adjacent to the seaward margin of the sandy Nearshore Ramp about 10 km seaward of the mainland coast (fig. 4.1). It stretches from the 50-m isobath to the eastern extent of the survey. The sedimentary sequence in Outer Basins consists of relatively thick deposits of Holocene mud and sand that conformably overlie Pleistocene sediment and bedrock (fig. 4.3). The Outer Basin is the second largest physiographic element, composing 99.1 km² or 27.7 percent of the study area (table 4.1). Water depths range from 50 m to more than 90 m. Quantitative Bottom ClassificationQuantitative methods have long been used to classify terrestrial environments through analysis of satellite data. Success in that field indicates that similar methods can be used to classify seafloor environments through analysis of marine acoustic data. The classification method in this study uses a two-part unsupervised classification algorithm based on established statistical methods typically applied to terrestrial remote-sensing data (Jensen, 2005) and available in most GIS and remote-sensing software packages (ESRI, 2008; ERDAS, 2008). The goal is to predict the sediment texture in the nearshore area by modeling the relationship between the mean grain size, water depth, bathymetric slope, and acoustic-backscatter intensity. Additional details of the classification method are contained in appendix 4 of this report. The shallow seafloor (less than 25 m deep) in the study area is characterized by distinct patterns of high and low acoustic backscatter that correlate with differences in sediment texture and seafloor morphology (fig. 4.5). In general, high backscatter represents coarse sandy sediment, and low backscatter represents fine sandy sediment. Figure 4.7 illustrates the relation between mean sediment-grain size and acoustic backscatter values at 14 sampling locations in the nearshore area. The plotted points of these samples occupy two discrete groups: (1) very fine to fine sand (3.4 to 2.1 phi) and (2) coarse sand (0.7 to 0.0 phi). Fine sand generates relatively low backscatter (mean values less than 45), and coarse sand generates relatively high backscatter (mean values greater 45). No samples of medium sand (2.0 to 1.0 phi) were collected in the mapped area. The backscatter trends are so apparent in a visual (qualitative) assessment that we explored using more quantitative analyses to investigate the relation between acoustic-backscatter data and the distribution of surficial sediment on the seafloor. Preliminary results of the classification indicate that two grain-size classes dominate the seafloor in the nearshore area (fig. 4.8). Approximately two thirds (43 km²) of the area is covered with fine to very fine sandy sediment, and the remaining one third (24 km²) is covered with coarse sandy sediment. The area predicted to be fine to very fine sand correlates well with the area where Holocene sediment thickness is greater than 0.5 m (fig. 3.5). These finer sediments generate low backscatter intensity and form a broad, relatively continuous deposit that lies in shallow water adjacent to the beach. The area predicted to be coarse sand correlates well with areas of high backscatter intensity and areas where Holocene sediment thickness is less than 0.5 m. These coarser sediments generate high backscatter intensity and form localized patches exposed in troughs between large bedforms of fine sand and a more extensive sheet that lies offshore of the central coast of Plum Island. Accurate bottom classification using statistical analyses is difficult, particularly along continental shelves with a broad range of different sediment types. We feel that the bottom-classification method performed adequately in this preliminary trial, largely because of the relatively simple geology of the nearshore area. The two main classes of sediment have distinct acoustic signatures, thus providing an opportunity to determine a first-order approximation of surficial geology. However, small outcrops of rock, which cover an estimated 2 km² or 3 percent of the nearshore area, were not delineated. Continued development of this classification method will focus on distinguishing bedrock and additional classes of sediment. Bottom-Sediment TextureSediment samples in the study area contain all components of the particle-size spectrum (fig. 4.9). Sediment texture ranges from clayey silt in the Outer Basin to pebbles, cobbles, and boulders in Rocky Zones (table 4.2). No samples were collected from Ebb-Tidal Deltas. Sand is the most common bottom sediment in this study, with 95 percent of samples containing more than 20 percent sand. Sand-sized particles (4 to –1 phi, or 0.062 to 2 mm in diameter) compose an average of 82 percent by weight in all samples, with values ranging from a minimum of 2 percent to a maximum of 100 percent. Samples with the highest sand content were collected from Nearshore Ramps (81 samples, average of 92 percent sand). Sand-rich sediment was also collected from Rocky Zones (7 samples, average of 67 percent sand) and Shelf Valleys (1 sample, 84 percent sand). The lowest values were from the Outer Basin (20 samples, average of 49 percent sand). Gravel, a textural class that ranges between coarse sand (–1 phi, or 2 mm in diameter) and large boulders (more than 4 m in diameter), is the least common bottom sediment sampled in this study. Gravel-sized particles compose an average of 5 percent by weight of all samples. Only 9 samples contain more than 20 percent gravel, but at least some gravel-size material was collected from 39 percent of the sampling locations. Gravel is the most common sediment texture in Rocky Zones (average of 9 percent gravel), where it composes a major component of glacial deposits and surrounds the base of rock outcrops. Samples from other zones average less than 5 percent gravel. Gravel is probably underrepresented in grab samples because of problems collecting large-diameter particles and the need for large samples to perform statistically valid analyses. Sidescan-sonar and camera observations suggest that gravel is probably more abundant than the weight percentages indicated by sampling alone. Muddy sediment, which includes both silt- and clay-sized particles (less than 4 phi, or 0.062 mm in diameter), is primarily in the deeper parts of the study area. Mud composes an average of 13 percent by weight of all sediment samples, but two-thirds of the samples contain less than 5 percent. Samples with the highest values were collected from the Outer Basin (average of 51 percent). Sediment from Rocky Zones is highly variable in terms of mud content, ranging from 0 percent to 51 percent with the higher values from deeper areas where a thin layer of mud drapes sand and gravel. The lowest values are in samples from Nearshore Ramps (average of 3 percent mud) and Shelf Valley (1 sample, 4 percent mud). Geologic Framework and Late Quaternary EvolutionThe framework geology and complex late Quaternary history of northeastern Massachusetts have strongly influenced the geologic evolution of the inner continental shelf. Bedrock controls the overall geometry of the coast and inner shelf. Complexly faulted and deformed rocks range in age from Precambrian (older than 540 million years) to Paleozoic (250–540 million years) (Zen and others, 1983). Erosion-resistant granites form the high cliffs, rocky islands, and shoals that characterize the shoreline of Cape Ann (Dennen, 1992). The reentrant of Ipswich Bay and adjacent lowlands are underlain by relatively weak metasedimentary and volcanic rocks of the Newbury Basin (Dennen, 1991). Coastal plain strata of Cretaceous and Tertiary age underlie Jeffrey's Ledge, a relatively shallow, glacially modified platform that trends northeast from Cape Ann (Oldale, 1985b). The inner continental shelf and adjacent terrestrial areas share a common history of glaciation and relative sea-level change. Late Pleistocene glaciers reached their maximum extent south of Cape Cod about 23,000 yrs B.P. (Balco and others, 2002) and retreated northward as climate warmed, passing the present coast of Cape Ann about 14,500 yrs B.P. (Kaye and Barghoorn, 1964). The glaciers smoothly eroded the granite hills and left behind a relatively thin, discontinuous cover of till and glacial-marine sediment overlying bedrock. A succession of different sedimentary environments formed in the region following deglaciation, as recorded by a sequence of fluvial, marine, and littoral deposits that accumulated in areas of the inner shelf submerged by the ongoing rise in sea level. These older deposits have been extensively reworked by marine transgression to produce the complex patterns of surficial sediment that exist today. Geologic mapping on land by Stone and others (2006) delineated glacial deposits in northeastern Massachusetts and grouped them into two main categories: glacial till and glacial stratified deposits. Glacial till is poorly sorted, unconsolidated sediment deposited directly by a glacier. The heterogeneous mixture is generally unstratified and includes particle sizes that range from clay to boulders. Deposits of till thicker than about 3 m generally take the form of moraines and drumlins. Moraines are hummocky, ridge-like features with locally dense accumulations of boulders that reflect the shape of the ice sheet's margin. Terminal moraine deposits on Cape Ann were first described by Shaler (1889) and later shown by Oldale (1985b) to extend offshore onto Jeffreys Ledge. Drumlins are small streamlined hills that have long axes oriented approximately NW-SE, parallel to the regional ice-flow direction. They occur among the salt marshes of Plum Island Sound (Great Neck) and Essex Bay (Hog Island). The southern terminus of Plum Island, a sandy barrier, is pinned against an eroding drumlin at the entrance to Plum Island Sound (fig. 1.3). Another drumlin (Steep Hill) lies on the opposite bank of the inlet, behind the sandy beach of Castle Neck. On the inner shelf seaward of Plum Island, rugged mounds of coarse-grained sediment rise up from the generally low-relief seafloor (fig. 4.3). The irregularly shaped areas of Rocky Zone largely consist of gravel-sized particles with numerous large boulders more than 1 m in diameter. Seismic-reflection profiles suggest that bedrock forms the cores of the features, which are covered by a layer of bouldery sediment that is acoustically incoherent, probably till. These deposits probably mark the locations of drumlins or other ice-contact deposits that were eroded during the Holocene marine transgression. Similar features in Massachusetts Bay about 25 km southwest of Cape Ann were described as eroded drumlins by Oldale and others (1994). Abundant shelly material from rock-dwelling, calcareous organisms has accumulated in low-lying depressions within Rocky Zones and along the margins of rock-walled Shelf Valleys. Glacial stratified deposits consist of unconsolidated sediment that was sorted and deposited in layers by meltwater discharged from a glacier (Stone and others, 2006). They include coarse-grained deposits of sand and gravel that accumulated in the coastal zone, relatively close to the glaciers, forming glacial-marine deltas along the ice margin. The topset/foreset contacts on these deltas mark the highstand marine limit, which ranges in elevation from approximately +15 m along the north shore of Cape Ann to +33 m in the lower Merrimack River Valley (Crosby and Lougee, 1934; Stone and Peper, 1982; Stone and others, 2004). More distal deposits of finer-grained, glacial-marine sediment cover wide areas of the coast and inner shelf from northeastern Massachusetts (Boston blue clay; Kaye and Barghoorn, 1964) to eastern Maine (Presumpscot Formation; Bloom, 1963). This sediment was deposited contemporaneously with ice retreat and typically consists of well stratified sand and mud with scattered dropstones of ice-rafted material that blanketed older glacial deposits and bedrock (fig. 4.5), and typically consists of well stratified sand and mud with scattered dropstones of ice-rafted material. Thick sequences of glacial-marine sediment in the western Gulf of Maine are best preserved in bedrock valleys and deep basins (Belknap and Shipp, 1991) and at the mouths of major rivers beneath thick sequences of Holocene material (Oldale and Edwards, 1990; Barnhardt and others, 1997). Isostatic rebound of the crust caused relative sea level to fall to a lowstand depth of about –50 m at 12,000 yr B.P. (fig. 1.2; Oldale and others, 1993). Evidence for the depth of the sea-level lowstand primarily consists of an ancient river delta and other coastal features that are preserved on the inner continental shelf offshore of Plum Island and Cape Ann (Oldale, 1985a; Oldale and others, 1983). The age of the lowstand is poorly constrained by a small number of cores that have been collected from submerged shoreline features (Oldale and Edwards, 1990). During regression and lowstand, rivers and coastal streams eroded the emergent landscape, carving channels into older glacial sequences (figs. 4.10 and 4.11) and transporting sediment to the lowstand shoreline. Sediment supplied by the Merrimack River produced a large delta with dipping clinoforms, inferred to be foreset beds, that prograded into the deeper Gulf of Maine (fig. 4.5). The submerged paleodelta is located 6 to 7 km offshore, and measures 20 km long, 4 to 7 km wide, and up to 20 m thick (Oldale and others, 1983, 1993; Edwards, 1988). As isostatic rebound decreased, relative sea level rose from the lowstand at different rates to its present elevation, submerging the paleodelta. Landward migration of the shoreline across the delta's upper surface, driven by submergence, caused extensive erosion and redistribution of sediment in areas above the lowstand (0–50 m depth). Seismic-reflection profiles show that seaward-dipping delta foresets were truncated, forming a prominent unconformity that separates fluvial/deltaic deposits of latest Pleistocene age from the overlying marine/coastal deposits of Holocene age (fig. 4.11). This transgressive surface of erosion, also referred to as the ravinement unconformity (Swift, 1968), is generally flat and slopes gently seaward, extending from the depth of the lowstand to the modern shoreface (fig. 3.7). The transgressive unconformity is exposed at the seafloor in many areas and is locally overlain by thin, discontinuous Holocene deposits of sandy sediment. These deposits, where present, are generally less than 2 m thick but are up to 9 m thick in the vicinity of Ipswich Bay. The large volume of Holocene sediment in the southern part of the study area adjacent to Cape Ann indicates a long-term net transport of sediment towards the south. Asymmetric bedforms and distinct grain-size differences on the surface of the Nearshore Ramp (fig. 4.7) indicate that the seafloor is actively being reworked by inner-shelf processes (Hein and others, 2007). These irregular patches of high and low backscatter are examples of sorted bedforms or rippled scour depressions that have been observed on continental shelves around the world (Cacchione and others, 1984; Murray and Thieler, 2004; Guiterrez and others, 2005; Ferrini and Flood, 2005; Green and others, 2004). The enigmatic features are also common on other parts of the Massachusetts inner shelf (Aubrey and others, 1982; Goff and others, 2005; Barnhardt and others, 2006). The distinct morphology and texture of these features result from the interaction of waves and currents (i.e., along- and cross-shelf transport of sediment) with the existing substrate materials on the seafloor. Unlike shallower parts of the inner shelf, the Outer Basin did not undergo emergence and erosion during times of lower sea level. Erosional unconformities that formed during regression and transgression do not extend below depths of about –50 m. As a result, sediment accumulation has been uninterrupted since deglaciation, preserving the relatively thick deposits of marine and glacial-marine mud that largely bury the high-relief bedrock in offshore areas. Isolated areas of Rocky Zone stand higher in elevation relative to the adjacent seafloor in the Outer Basin, and thus represent island-like patches of hard substrate surrounded by expanses of muddy sediment.
|

![]() U.S. Department of the Interior |
U.S. Geological Survey
U.S. Department of the Interior |
U.S. Geological Survey
URL: https://pubsdata.usgs.gov/pubs/of/2007/1373/html/interp.html
Page Contact Information: Contact USGS
Page Last Modified: Wednesday, 07-Dec-2016 21:00:27 EST