U.S. Geological Survey Open-File Report 2008-1206
Coastal Change Along the Shore of Northeastern South Carolina: The South Carolina Coastal Erosion Study
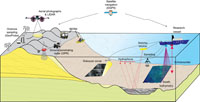
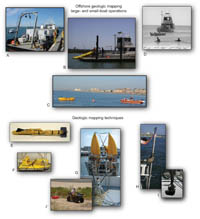
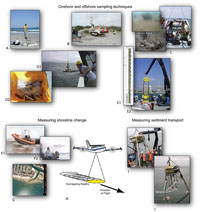
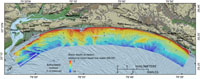
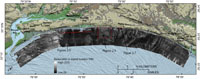
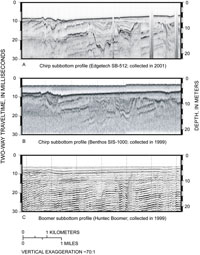
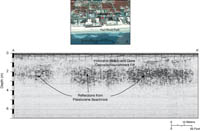
2.1 IntroductionThe USGS Coastal and Marine Geology Program conducts research and mapping investigations designed to understand fundamental processes that create, modify, and maintain coastal and nearshore marine systems. The following sections describe methods used by the SCCES to map the geologic framework, assess historic shoreline change, and define the modern oceanographic processes influencing sediment transport along the coast of northeastern South Carolina. 2.2 Mapping the Geologic FrameworkThe geologic framework forms the foundation of the coastal system and is shaped by the cumulative effects of tectonics, storms, sea-level change, and human activities. The geologic framework is defined by identifying three primary components: 1) seafloor topography (bathymetry), 2) texture and distribution of sediment on the seafloor, and 3) structure and composition of older rocks and sediment that underlie the seafloor, beach, and lower coastal plain. To map these components, a suite of remote sensing and sampling techniques are employed both at sea and on land (Figures 2.2A and 2.2B). To see beneath the ocean surface and image seafloor environments, sound energy (acoustics) is used. Sound travels efficiently in water and can penetrate deep into the ocean to provide detailed views of the seafloor; these views are comparable to topographic maps or aerial photographs on land. During the SCCES, different types of sonar systems were deployed that bounce sound waves off the seafloor and underlying rocks and sediment (Figure 2.1). Return signals, or reflections, are measured by the sonar systems and are used to produce sound images of the seafloor terrain and subsurface geology. Seafloor Topography Swath bathymetric systems measure water depth in a narrow band, or swath, perpendicular to the direction of ship travel (Figure 2.1). The systems emit a series of acoustic pulses that insonify the seafloor beneath the survey vessel and scatter sound in many directions. Some sound energy is reflected back to the sonar and precisely recorded. The angle, intensity and traveltime of these reflected signals are used to calculate water depth along the swath. As the vessel moves forward, continuous depth measurements are collected and used to generate detailed bathymetric maps of the seafloor (Figure 2.3). Surficial Geology Sidescan or side-looking sonar systems are used to image wide areas (10s of meters to kilometers) of the seafloor (Figure 2.1). These systems emit a series of acoustic pulses, or pings, that insonify a ribbon-like swath of seafloor perpendicular to the direction of travel. Sound scatters in all directions as it intersects the seafloor, with some percentage reflected back to the sonar. The traveltime and intensity of these reflections are recorded, and their relative strength (backscatter) provides information about the type of material that covers the seafloor (Figure 2.4). As the research vessel moves forward, continuous pings insonify a swath along the seafloor, much as a lawnmower cuts through grass. To achieve full coverage of the bottom, the ship sails back and forth as thought it were mowing the lawn along a closely spaced series of parallel tracklines. Each swath overlaps with adjacent swaths to provide full coverage of the seafloor. Finally, data are stitched together to form a composite sidescan-sonar image (Figure 2.4). Subsurface Geology Subbottom-profiling systems are used to image the internal structure of the seafloor (Figure 2.1). Similar to swath bathymetric and sidescan-sonar systems, subbottom profilers emit pulses of sound and then measure the intensity and traveltime of the return signals. In this case, however, more power is used to generate an acoustic pulse that penetrates into the subsurface and travels through rock and sediment. When the acoustic pulse moves across a contrast in physical properties, such as the upper surface of rocks buried beneath a sheet of sand or internal layering within individual deposits (Figure 2.6), some of the sound energy is reflected back to surface receivers and recorded. Ground-penetrating radar (GPR) is used to image the subsurface geology beneath the beach and other land areas. Instead of sound energy, GPR emits pulses of FM-frequency radio waves from an antenna traveling across the ground surface (Figure 2.1). When the outgoing signal travels across boundaries marking a change in the physical and chemical properties of the underlying deposits, some energy is reflected back to the surface. As with subbottom profiling, the time it takes a signal to travel from the antenna into the ground and back is precisely measured and converted to distance. Numerous closely spaced soundings are combined to form an image of the subsurface and used to measure the thickness of beach sand over rock, for example, or to locate buried channels formed by ancient streams or tidal inlets (Figure 2.7). Seafloor Sediment The geophysical techniques described above allow us to see through ocean waters and deep below the land surface and image the surficial and subsurface geology; however, it is difficult to determine the physical characteristics, such as grain size, of seafloor sediment and subsurface deposits on the sole basis of these remote images. In order to fully understand what the imagery represents, we need to collect physical samples of rocks and sediment and analyze them in the laboratory. A variety of techniques are used to sample sediment deposits, such as coring and grab sampling (Figure 2.2B). Additional techniques, such as photography and video, are also used to verify interpretations of seafloor geology. Next Section: 2.3 Mapping Shorelines » |

 U.S. Department of the Interior |
U.S. Geological Survey
U.S. Department of the Interior |
U.S. Geological Survey
[an error occurred while processing this directive]
URL: https://pubsdata.usgs.gov
Page Contact Information: Publishing Service Center
Page Last Modified: Wednesday, 07-Dec-2016 21:39:04 EST