USGS - science for a changing world

Western Coastal & Marine Geology

U.S. Geological Survey
Open-File Report 2008-1237

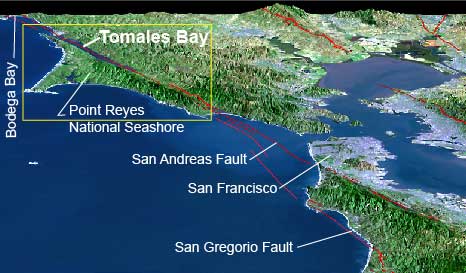
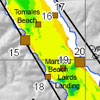
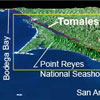
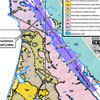
Interferometric Sidescan Bathymetry, Sediment and Foraminiferal Analyses; a New Look at Tomales Bay, California

by

Roberto J. Anima1, John L. Chin1, David P. Finlayson2, Mary L. McGann1, and Florence L. Wong1

2008

1U.S. Geological Survey, Menlo Park, California
2U.S. Geological Survey, Santa Cruz, California

Introduction

perspective view of Tomales Bay and nearby San Francisco Bay area
Perspective view of Tomales Bay and nearby San Francisco Bay area (http://www.sfbayquakes.org/northview.html).

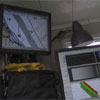
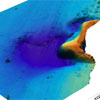
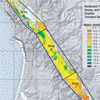
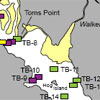
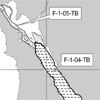
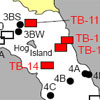
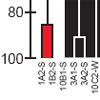
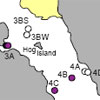
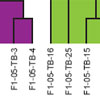
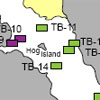
The United States Geological Survey (USGS) in collaboration with Point Reyes National Sea Shore (PRNS), and the Tomales Bay Watershed Council [http://www.tomalesbaywatershed.org/] has completed a detailed bathymetric survey, and sediment and foraminiferal analyses of the floor of Tomales Bay, California.  The study goals are to detail the submarine morphology, the sediment distribution, sedimentary features, and distribution of foraminifera to provide a framework for future studies. The USGS collected swath bathymetric data with a SEA SWATHplus interferometric sidescan sonar system (2004, 2005) and an echo sounder system (2006). The data were processed into continuous mosaic images that show bathymetric detail of the bay floor with 0.2-m vertical and 4.0–m horizontal resolution.  Acoustic backscatter data from the 2004 and 2005 surveys were processed into 2-m resolution grids. In addition, 27 sediment samples were collected from various parts of the bay for grain size analyses and a comprehensive study of the distribution of foraminifera in Tomales Bay.  The foraminiferal analysis determined that the invasive foraminifera Trochammina hadai from Japan was present in Tomales Bay.

The project was conducted in response to a request from the National Park Service, and the Tomales Bay Watershed Council who voiced a need to look at the environmental impacts of human input to the surrounding watersheds that ultimately flow into the bay.  The mapping, sediment, and foraminiferal data establish a baseline survey for future comparisons of possible geologic and anthropogenic changes that might occur due to changes in land use or development in the surrounding watershed.  These data may also aid in determining the possible pathways of pollutants entering the bay from the surrounding watersheds.

Top

Report

title page of open-file report Download the report as a 46-page PDF document (of2008-1237.pdf; 2.2 MB)


Map Sheets

thumbnail of 1:24,000 map of color shaded bathymetry of Tomales Bay Map Sheet 1: Color-shaded bathymetry map from sidescan and single beam data, Tomales Bay, California. Scale 1:24,000. (28 x 35 in, 13 MB).
backscatter map of Tomales Bay thumbnail Map Sheet 2: Backscatter amplitude map of the floor of Tomales Bay, California, from interferometric sidescan data. Scale 1:24,000. (28 x 35 in, 15 MB).


Top

GIS Data

 
Description Preview Metadata Download
4-m resolution bathymetry grid bathymetry of Tomales Bay thumbnail
(13 MB)
text, html, FAQ, xml

ESRI ASCII grid in UTM Zone 10, WGS84 (3.6 MB zip)

xyz: xy in geographic coordinates (decimal degrees WGS84), elevation in meters (5.0 MB zip)

2-m resolution backscatter amplitude grid backscatter map of Tomales Bay thumbnail
(15 MB)
text, html, FAQ, xml

ESRI ASCII grid in UTM Zone 10, WGS84 (15 MB zip)

xyz: xy in geographic coordinates (decimal degrees WGS84), backscatter amplitude as ratio of mean (15 MB zip)

sediment samples grab samples collected from Tomales Bay in  2005 text, html, FAQ, xml http://walrus.wr.usgs.gov/infobank/ f/f105tb/samp/f-1-05-tb.onoff.grabs.grab

Figures from the report

oblique view of Tomales Bay, California
Figure 1-1. Perspective view of Tomales Bay and nearby San Francisco Bay area, California.
Geologic setting of multibeam bathymetry and sediment samples collected in Tomales Bay area thumbnail Figure 1-2. Geologic setting of new high-resolution bathymetry and sediment samples collected in Tomales Bay area (after Clark and Brabb, 1997).
Interferometric multibeam data collection equipment thumbnail Figure 1-3. Interferometric sidescan sonar data collection equipment.
Perspective views of interferometric multibeam bathymetric data, Tomales Bay, California thumbnail Figure 1-4. Perspective views of interferometric sidescan sonar bathymetric data, Tomales Bay, California.
areas of Tomales Bay thumbnail Figure 1-5. Mouth (A), central (B), and south (C) areas of Tomales Bay, California, including new bathymetry described in this report.
Mean grain size (mm) of sediment samples from Tomales Bay, California thumbnail Figure 1-6. Grain size and locations of sediment samples from Tomales Bay, California.

1982 and 2005 foraminiferal assemblages in Tomales Bay, California thumbnail

Top

Figure 1-7. Comparison of 1982 and 2005 foraminiferal assemblages in Tomales Bay, California.
Figure 2-1. Locations of bathymetric surveys, Tomales Bay, California.
1982 and 2005 foram samples thumbnail Figure 3-1. Location of the 1982 (McCormick et al., 1994) and 2005 sample sites in Tomales Bay.
1982 cluster analysis thumbnail Figure 3-2. Dendrogram of the Q-mode cluster analysis based on the 1982 quantitative (percent frequencies) foraminiferal abundances of Tomales Bay from McCormick et al., 1994.
1982 foram assemblages thumbnail Figure 3-3. Distribution of the 1982 foraminiferal assemblages of Tomales Bay.
2005 cluster analysis thumbnail Figure 3-4. Dendrogram of the Q-mode cluster analysis based on the 2005 qualitative (presence/absence) distribution of foraminifera of Tomales Bay.
2005 foram distribution thumbnail Figure 3-5. Distribution of the 2005 foraminiferal assemblages of Tomales Bay.

Top

Tables from the report

Table 1-1. Summary grain size properties for grab samples collected in 2005 from Tomales Bay, California.
Table 3-1. Benthic foraminifera identified in the 2005 Tomales Bay samples.
Table 3-2. Qualitative distribution of benthic foraminifera and other biological constituents in the 2005 Tomales Bay samples.
Table 3-3. Tomales Bay foraminiferal assemblages, representative species, and ecological interpretation determined in the studies of McCormick et al. (1994)
and this study.
Appendix. Sediment grain size analyses.


For more information, contact

Roberto J. Anima, Emeritus
John L. Chin
United States Geological Survey
Coastal and Marine Geology Program
345 Middlefield Road, MS 999
Menlo Park, CA 94025

Suggested citation and version history

Top


Introduction

Report as PDF

Map Sheets

GIS Data

Figures

Tables


Download a free copy of the latest version of Adobe Reader.

| Help | PDF help | Publications main page |
| Western Open-File Reports for 2008 |
| Geologic Division | Coastal and Marine Geology |


This report is available only on the Web


Accessibility FOIA Privacy Policies and Notices

Take Pride in America logo USA.gov logo U.S. Department of the Interior | U.S. Geological Survey
URL: http://pubs.usgs.gov/of/2008/1237/
Page Contact Information: Michael Diggles

Page Created: July 31, 2008
Page Last Modified: August 14, 2008