
|
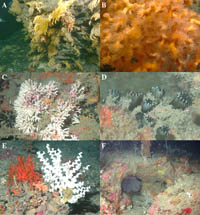 |
Figure 1. Examples of the diversity of cold-water corals, shown in their natural habitats.
(A) Scleractinians and octocorals forming a bioherm on basaltic pillow lavas;
(B) Closeup of the polyps of the scleractinian Lophelia pertusa; (Photos A and B were taken on the New England Seamounts in the North Atlantic Ocean by the Institute for Exploration’s remotely operated vehicle (ROV), Hercules, and are provided courtesy of the Deep Atlantic Stepping Stones 2005 project (DASS05).
(C) Stylasterids (white and pink) and black solitary cup corals (Cladopsammia sp.) on carbonate rock;
(D) Close-up of a solitary scleractinian Cladopsammia sp.;
(E) Red octocoral and white Lophelia pertusa on carbonate rock;
(F) Carbonate pinnacle covered by octocorals and solitary scleractinians.
(Photos C, D, E, and F were taken in the Madison Swanson Reserve in the northeastern Gulf of Mexico by an ROV operated by Lance Horn (NOAA/NURP) during a cruise of the R/V Liberty Star in 2005 (Scanlon, unpublished data).
|
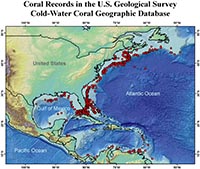 |
Figure 2. The USGS Cold-Water Coral Geographic (CoWCoG) Database includes information about cold-water corals from over 1,700 locations, mainly in the Atlantic Ocean off the eastern and southeastern United States, with a few off eastern Canada or in the Caribbean region. Red dots denote locations listed in the database. |
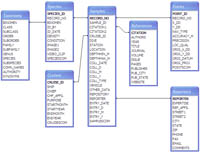 |
Figure 3. The CoWCoG Database contains over 90 fields organized into 7 separate tables that are linked to allow complex searches and customized data export. |
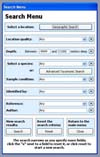 |
Figure 4. Screen shot of Search page. The main search menu allows searching geographically, taxonomically, and by using several other criteria. Pulldown menus make searching easier. Click the X button to reset each field, or the Reset button at the bottom of the page to reset all fields. The Geographic Search and Advanced Taxonomic Search buttons will open the new windows shown in Figures 5 and 6, respectively. When all search criteria are set, click Search to view the results (see Figure 7A, 7B, 7C, and 7D). |
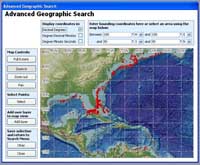 |
Figure 5. Screen shot of Geographic Search page. The Advanced Geographic Search (available in the Advanced Method) allows the user to select points from a geographic area by either entering the bounding coordinates or by clicking on the Select Points button and dragging a bounding rectangle on the map. The selected points will change from red to yellow (zooming in does not select points). Once the desired points have been selected, the user clicks Okay to return to the main Search Menu (Figure 4). The user can add selection criteria on the main Search Menu or click the Search button to see the results (examples are shown in Figures 7A, 7B, 7C, and 7D). |
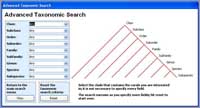 |
Figure 6. Screen shot of Advanced Taxonomic Search page, where the user can progressively narrow the selection based on taxonomic levels. Each clade (or level) chosen will decrease the number of items in the pulldown lists to reflect the choice made. For example, if the user selects only Genus: Madrepora, the Species pulldown list will comprise only carolina and oculata and the pulldown lists for the clades above Genus will comprise only the one appropriate name. The graphic of clades to the right of the pulldown fields changes color as the user selects taxonomic levels on the left. |
Figure 7A.
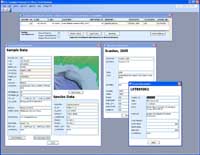
Figure 7B.
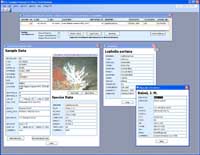
Figure 7C.
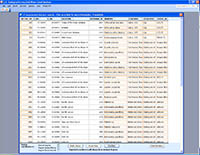
Figure 7D.
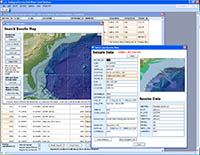 |
Figure 7. These four screen shots show examples of typical search results obtained by using the CoWCoG database. A search for Lophelia pertusa, identified by Waller in the Gulf of Mexico, yields the one record, in the spreadsheet at the top (Figures 7A and 7B). Clicking on the record number brings up the Sample Data window. The user can toggle between a map of the selected record (Figure 7A) or a photograph of the actual specimen (Figure 7B) in the Sample Data window.
Additional clicks of highlighted fields in the spreadsheet or the Sample Data window open windows with details about taxonomy (Figure 7B), citation (Figure 7A), cruise (Figure 7A), and reporter (Figure 7B).
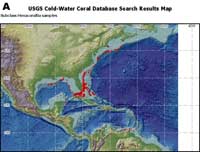
A new search for all records for corals in water depths greater than 2000 m returns 47 records, the partial list shown in Figure 7C. Clicking on the View Map button brings up the Search Results Map (Figure 7D), where the user can select a point on the map (yellow dot, Figure 7D) and bring up the Sample Data page with a closeup map showing only the selected point (foreground, Figure 7D).
In this example, the locations of six entries were very close to the selected point. The Sample Data window automatically displays the message in red: “Sample 1 of 6 Selected” and a Next button appears so that the entries can be viewed in rapid succession. |
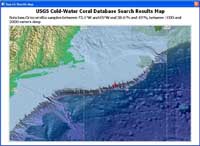 |
Figure 8. Screen shot of Print Map. A printable map can be created after a search is made. From the page showing the list of records returned after a search (example shown in Figure 7C), the user can click the View Map button at the bottom of the page, zoom and pan until the desired extent is achieved, then click the Open Print Map button. The area covered by the printable map will be approximately the same as the area of the Search Results Map and a header will be automatically printed at the top of the page summarizing the search criteria used (for example, bounding coordinates, species, depth ranges). The header summarizes the search parameters entered and does not change if the user zooms or pans the Search Results Map before opening Print Map. |
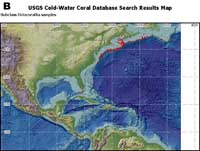 |
Figure 9. Corals from the subclass Hexacorallia (A) occur throughout the study area, whereas corals from subclass Octocorallia (B) appear to be concentrated off the northern United States. The lack of octocoral data off the southern United States is the result of less research in this region and lack of entries in this database rather than a reflection of the actual distribution of octocorals (see text for further explanation). |
|


