U.S. Geological Survey Open-File Report 2009-1150
Surficial Geology of the Floor of Lake Mead (Arizona and Nevada) as Defined by Sidescan-Sonar Imagery, Lake-Floor Topography, and Post-Impoundment Sediment Thickness
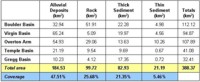
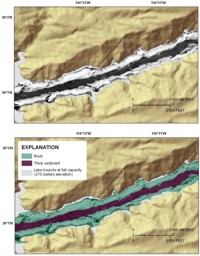
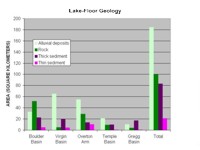
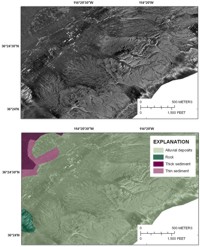
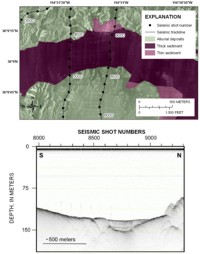
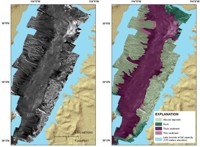
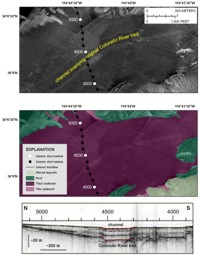
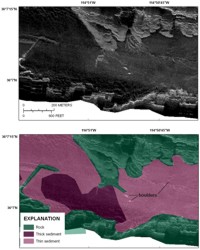
Lake Mead lies in the Basin and Range Province of the Southwestern United States, and the morphology of the lake is controlled by the geomorphology of the region. Where the original Colorado River crossed basin provinces it was flanked largely by the Tertiary Muddy Creek Formation, a muddy sandstone of lacustrine origin, or Quaternary alluvial deposits (Longwell, 1960). By contrast, where the river cut through the ranges it is bordered by steep, high-relief walls composed primarily of Precambrian to Tertiary igneous, volcanic, and metamorphic rocks (Longwell, 1960). Four different lake-floor types were identified using the sidescan-sonar imagery and seismic-reflection data: rock outcrops, alluvial deposits, thin post-impoundment sediment deposits, and thick post-impoundment sediment deposits (fig. 2). The rock outcrops and alluvial deposits predate the lake, while the post-impoundment sediments have accumulated since completion of the Hoover Dam in 1935. The post-impoundment sediment deposits were divided into two categories as a way to provide a qualitative description of where these sediments are concentrated in the reservoir. The transition from thick to thin sediment cover was chosen as 1 m (fig. 3). More detailed discussions of the post-impoundment sediment composition and thickness are provided by Smith and others (1960) and Twichell and others (2003; 2005). Areas of rock outcrop appear on the sidescan images either as high-backscatter or as alternating bands of high and low backscatter (fig. 4). The high-backscatter signature represents steep rock walls that face the sonar, while the alternating high- and low-backscatter bands appear to represent terraced outcrops. The terraces probably are controlled by bedding of the underlying sedimentary strata. The distribution of these two signatures coincides with the distribution of different rock types surrounding the lake. The areas of rock outcrop associated with uniform high backscatter occur where the lake is flanked by Precambrian gneiss or Cretaceous through Tertiary volcanic and intrusive rocks (Longwell, 1960; Wilson and others, 1969). These rocks form the steep cliffs that border the narrow parts of the lake. Areas of alternating bands of high and low backscatter occur along the northern side of Boulder Basin and the northwestern section of Overton Arm, places where sedimentary strata are exposed adjacent to the lake (Longwell, 1960; Ludington and others, 2005). Rock outcrops cover approximately 100 km2 (26%) of the 388 km2 imaged by sidescan sonar (table 1) and are most extensive in Boulder Basin (fig. 5). Their distribution is shown in figure 2. Alluvial deposits are the second pre-impoundment geologic unit that is still preserved on large sections of the lake floor. These deposits show on the sidescan-sonar images as areas of moderate backscatter dissected by an intricate network of small channels with low-backscatter floors (fig. 6). These channels can be braided, but mostly are distributary in nature. Alluvial deposits cover approximately 185 km2 of the area imaged by sidescan sonar (table 1). They cover 48 percent of the surveyed area and are most extensive in Virgin Basin (fig. 5). Their distribution is shown in figure 2. The sediment that has accumulated in the lake since impoundment mostly has a low-backscatter signature associated with its surface (fig. 7). This post-impoundment sediment fill has been divided into two provinces based on the seismic-reflection data, namely, thin and thick sediment cover. Because of the continuous coverage of the lake floor provided by the sidescan mosaic, the outline of the post-impoundment deposits can be mapped in more detail than can be derived from the seismic profiles that are spaced several hundred meters apart (fig. 7). Thick sediment fills the former Colorado River channel and onlaps the older alluvial deposits that remain exposed along the flanks of large parts of the lake (fig. 2 and fig. 7). Because of the dramatic contrast in acoustic signatures, the edge of the post-impoundment sediment is easy to identify (fig. 7). This deposit has an irregular edge with embayments and promontories coinciding with tributary valleys and spurs that were formed prior to filling of the lake (fig. 2 and fig. 3). Within the area of thick sediment cover, the backscatter signature is not uniform. In Iceberg Canyon (fig. 1), at the easternmost end of the lake, post-impoundment sediment exceeds 30 m in thickness and the surface has a moderate-backscatter return. Cores from here recovered sandy sediment, and this coarser sediment is probably the cause of the moderate-backscatter signature from this part of the lake floor (Twichell and others, 2005). In Gregg Basin (fig. 1), the post-impoundment sediment surface has low backscatter along the edges of the basin and at its southern end; it has moderate backscatter in the central and northern part of the basin (fig. 8). Cores from this basin show a transition from sandy sediment in the northern part of the basin to silt along its edges and near its southern end (Twichell and others, 2005). In Temple, Virgin, and Boulder Basins, cores show that the upper few meters of the thick post-impoundment sediment deposit is clay with scattered silt laminae. In these basins the post-impoundment sediment has a low-backscatter surface except for localized landslide deposits and two parallel bands of moderate backscatter that can be traced through the centers of the western part of Virgin Basin and Boulder Basin (fig. 9). These moderate-backscatter bands mark the flanks of a subtle channel that is evident in the seismic profiles that cross it (fig. 9). The seismic profiles show that this channel, which only has about 2 m relief, directly overlies the bed of the original Colorado River. Thick post-impoundment sediment covers 83 km2 of the surveyed area (table 1), which accounts for 21 percent of the surveyed area. The thick sediment cover is most extensive in Boulder Basin (fig. 5), with its distribution throughout the lake shown in figure 2. The thin post-impoundment sediment cover is less extensive than the thick sediment cover and is limited to the floors of Overton Arm, Las Vegas Bay (considered part of Boulder Basin in table 1 and figure 5) and the smaller tributary valleys that are found around the remainder of the lake (fig. 2). Where seismic profiles are available, the sediment cover in these valley floors is patchy and rarely exceeds 1 m in thickness. High-backscatter targets along these channel floors are probably boulders, and their presence further supports a sediment cover too thin to completely bury the pre-existing geology (fig. 10). The only places where sediment does exceed 2 m are in the deltas at the mouths of some of the small tributary rivers such as Las Vegas Wash (fig. 2). Thin post-impoundment sediment covers approximately 21 km2 of the surveyed area (table 1). It covers 5 percent of the surveyed area and is most extensive in Overton Arm (fig. 5 ). Its complete distribution is shown in figure 2. |

![]() U.S. Department of the Interior |
U.S. Geological Survey
U.S. Department of the Interior |
U.S. Geological Survey
[an error occurred while processing this directive]
URL: https://pubsdata.usgs.gov
Page Contact Information: Contact USGS
Page Last Modified: Wednesday, 07-Dec-2016 22:18:34 EST