U.S. Geological Survey Open-File Report 2009-1150
Surficial Geology of the Floor of Lake Mead (Arizona and Nevada) as Defined by Sidescan-Sonar Imagery, Lake-Floor Topography, and Post-Impoundment Sediment Thickness
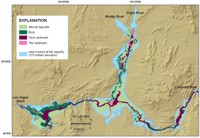
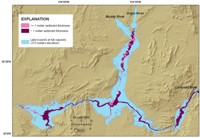
Sidescan-sonar imagery, high-resolution seismic profiles, bathymetry, and geologic maps of Arizona and Nevada were used to complete the surficial geologic map of the lake floor. The sidescan imagery was the primary dataset used for this analysis (fig. 1). A full description of the processing and mapping procedures used to create the digital sidescan mosaics is given in Twichell and others (2003). Due to the large size and irregular shape of the lake, the sidescan imagery was divided into five interpretive areas (from west to east): Boulder Basin, Virgin Basin, Overton Arm, Temple Basin, and Gregg Basin. The original sidescan mosaics were generated with a pixel size of 2 m and published in both Universal Transverse Mercator (UTM), Zone 11, World Geodetic System 84 (WGS84) projection as well as geographic, WGS84 coordinate system (Twichell and others, 2003). The lake-floor surface as it was at the time of the sidescan data collection in 2001 is the combination of two products. The first product is the multibeam bathymetry collected by the Bureau of Reclamation in 2001 in areas known to be covered by post-impoundment sediment. The second product is a surface generated from the digitized pre-impoundment contours available from the Digital Raster Graphics (DRGs). These contours were based on topographic measurements that predate filling of the reservoir. These data provide a good representation of the present elevation of the lake floor that is free of post-impoundment sediment cover. The merging of the multibeam datasets and digitized contours was described in the report by Twichell and others (2003). The present-day lake floor was then combined with existing USGS Digital Elevation Model (DEM) data to create a comprehensive present-day surface for the study area (U.S. Geological Survey, 1999). An analysis of the seismic data acquired in 1999-2001 is provided by Twichell and others (2003; 2005) and is briefly summarized here. Using digital seismic interpretation software (Landmark SeisWorks®), sediment thickness was measured along each profile and converted from travel times to meters using a speed of sound in water of 1,500 meters per second (m/s). These thickness measurements were gridded to generate an isopach map of the post-impoundment sediment (Twichell and others, 2003). For the analysis presented here, we differentiate only between thin and thick sediment cover, where 1 m is selected as the transition between thin and thick sediment (fig. 3). Thin and thick post-impoundment sediment cover information is incorporated into the surficial geology map; however, the isopach map with absolute thicknesses is also available in the data catalog. Digital versions of geologic maps of Arizona and Nevada were compiled by Ludington and others (2005) and used in the interpretation of the lake-floor geology discussed in this report. As the sidescan-sonar imagery could not differentiate between different rock types, much of the detail presented in these maps could not be projected under the lake, but the maps did help differentiate between areas of rock outcrop and alluvial deposits. Interpretive geologic mapping was done using Environmental Systems Research Institute (ESRI) software ArcMap (version 9.3). The sidescan imagery, bathymetry, isopach map, and State geologic maps were all imported to ArcMap and, as necessary, reprojected to geographic coordinates (WGS84). The interpretation was completed in ArcMap by creating polygons around the different geologic units identified on the lake floor. The interpretation was completed at scales of 1:10,000 or smaller for the entire area covered by sidescan-sonar imagery (fig. 2), and is available as a shapefile in the geographic, WGS84 coordinate system in the data catalog section of this report. |

![]() U.S. Department of the Interior |
U.S. Geological Survey
U.S. Department of the Interior |
U.S. Geological Survey
[an error occurred while processing this directive]
URL: https://pubsdata.usgs.gov
Page Contact Information: Contact USGS
Page Last Modified: Wednesday, 07-Dec-2016 22:18:35 EST