U.S. Geological Survey Open-File Report 2009–1231
Integrated Multibeam and LIDAR Bathymetry Data Offshore of New London and Niantic, Connecticut
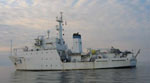
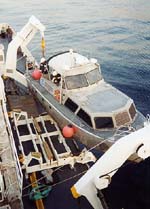
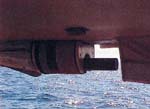
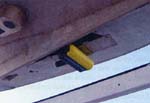
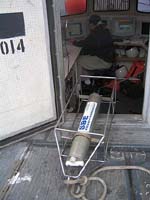
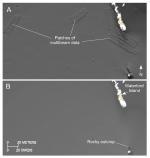
Multibeam BathymetryTwo 8.5–m aluminum Jensen launches deployed from the NOAA Ship Thomas Jefferson were used to acquire the multibeam echosounder (MBES) bathymetric data during April-May 2005 (figs. 4, 5). Survey H11441 was completed off New London; survey H11442 was completed off Niantic, Connecticut. Although most of the deeper parts of these surveys were completely covered during MBES acquisition, coverage in the shallower areas (<10 m) was limited to numerous, small, site-specific developments around target areas and reconnaissance cross lines. The MBES data were collected with hull-mounted RESON SeaBat 240–kilohertz (kHz) 8101 and 455–kHz 8125 shallow-water systems (figs. 6, 7). These systems measure two-way sound travel time across a 150–degree swath and 120–degree swath, respectively. The SeaBat 8101 has 101 beams at a 1.5–degree beam spacing. The SeaBat 8125 has 240 beams with a cross-track beam width of 0.5 degrees at nadir. Original horizontal resolution of the MBES data was <1 m, but combined base surfaces were generated at 3 m for survey H11442 and 4 m for survey H11440. Vertical resolution of the MBES data is about 0.5 percent of the water depth. The bathymetric data were acquired in XTF (extended Triton data format) and processed by NOAA using CARIS HIPS (Hydrographic Image Processing System) software for quality control, to incorporate sound velocity and tidal corrections, and to produce the continuous digital terrain model (DTM). Navigation was by TSS POS/MV 320 differential GPS-assisted inertial navigation systems; the differential GPS beacons used were from Moriches, New York, and Sandy Hook, New Jersey. HYPACK MAX was used for acquisition line navigation. Sound-velocity corrections were derived using frequent SEACAT CTD (conductivity-temperature-depth) profiles (fig. 8). Typically, a CTD cast was conducted for every 3 hours of MBES acquisition. Tidal-zone corrections were calculated from data acquired from National Water Level Observation stations at New London, Connecticut, and Montauk, New York. Vertical datum is mean lower low water. Detailed descriptions of the MBES acquisition and processing can be found in the descriptive reports (National Oceanic and Atmospheric Administration, 2005a; 2005b). Hydrographic LIDAR DataEleven reconnaissance cruises were conducted aboard a leased lobster boat to monitor water clarity prior to commencement of airborne survey operations. These cruises, which utilized Secchi disks to determine water clarity, were conducted between the Connecticut River and Fishers Island from May 9, 2003, to January 11, 2004, when water clarity was deemed adequate. The LIDAR data were acquired by Tenix LADS, Inc., from January 25 to March 3, 2004, with a LADS Mk II system. Airborne survey operations were conducted aboard a Dash 8-202 series aircraft (fig. 9) with a Nd:YAG laser at heights between 365 and 670 feet, at ground speeds between 140 and 210 knots, and variably at 4x4–m (primarily for survey H11224) and 3x3–m (primarily for survey H11225) laser-spot spacings. Green laser pulses were scanned beneath the aircraft in a rectilinear pattern. The returned green-laser energy reflected from the sea surface and sea floor were captured and digitally recorded. Received infrared laser energy, supplemented by an Altitude Heading Reference System (AHRS) inertial height reference and kinematic GPS, was used to determine the height of the aircraft. Real-time positioning was provided by wide area differential global positioning system (WADGPS). Acquired data were processed with Tenix's Ground System, which uses proprietary software. Detailed descriptions of the LIDAR acquisition and processing can be found in the descriptive reports (National Oceanic and Atmospheric Administration, 2004a; 2004b). Data ProcessingThe CARIS field sheets (grids) for the four surveys were inspected to determine whether vertical and (or) horizontal offsets were present where the surveys overlapped. Both NOAA LIDAR surveys (H11224 and H11225) showed no offset in either the vertical or horizontal direction. The same result was found for the two NOAA multibeam surveys (H11441 and H11442). A consistent 25–cm vertical offset was found between the multibeam and LIDAR datasets, however, with the multibeam data being consistently 25 cm shallower than the overlapping LIDAR data (fig. 10). Although 25 cm is within the vertical error budget as reported by Tenix for the LADS system and as reported for the Reson 8101 and 8125 systems installed on the NOAA launches, the two multibeam surveys were offset (deeper) by 25 cm and thus referenced to the LIDAR surveys to correct this discrepancy and remove the resultant artifacts from the data. We chose to lower the multibeam soundings, rather than raise the LIDAR data, primarily to keep the LIDAR 0-m depth contour (sea surface as obtained by the LADS system) at the MLLW sea level, but also because the Tenix LADS surveys were conducted using real-time kinematic GPS techniques and were judged to be the more accurate in the vertical dimension. The CARIS base surfaces (field sheets) from each survey were imported as gridded data into the Fledermaus DMagic program to make DTM files in DMagic. Importing the field sheets as gridded data preserves the floating-point format and original resolutions. The two multibeam survey grids were exported as ESRI ASCII raster files using DMagic and imported into ArcMap using the ascii2raster tool. Subsequently, 25 cm was added to the value of each multibeam survey raster grid cell, creating a new raster for each survey that could then be combined with the LIDAR datasets. The adjusted multibeam rasters were imported back into DMagic to create new DTM files that could be combined with the LIDAR DTM files. The DTM files from survey H11441 (now 25 cm deeper) and survey H11224 were combined into one file using the Fledermaus command line option dtmmerge. The same procedure was done for the two DTM files from surveys H11442 and H11225. The dtmmerge program was used to combine the input grid files and set the resolution of the output combined grid to the lowest resolution input grid, in this case the 4-m LIDAR grids. Finally, these two new combined grids were merged into one large grid that contained all four survey datasets. Output soundings for the combined grids are based on the average of the nearest input grid soundings for any particular output grid cell. The combined H11441–H11224 grid, the combined H11442–H11225 grid, and the grid containing data from all four surveys were all exported from DMagic as ESRI ASCII raster files and then converted into rasters within ArcMap using the ascii2raster conversion tool. Subsequently, these raster files were reprojected into the geographic, WGS84 coordinate system using the Project Raster data management tool. The resampling technique was bilinear; transformation 5 was selected. The color, hill-shaded GeoTIFF images with world registration files of the three combined datasets were created within DMagic and IVS Image Viewer. Color ramps for all three GeoTIFFs were set to the same range, sun illumination is from the north at 45 degrees above the horizon, and vertical exaggeration is 4x. More detailed descriptions of the processing steps performed by the USGS to create the datasets presented in this report are included in the metadata files. These files can be accessed through the Data Catalog section of this report. |
Click on figures for larger images.
|

![]() U.S. Department of the Interior |
U.S. Geological Survey
U.S. Department of the Interior |
U.S. Geological Survey
URL: https://pubsdata.usgs.gov/pubs/of/2009/1231/html/methods.html
Page Contact Information: Contact USGS
Page Last Modified: Wednesday, 07-Dec-2016 22:25:06 EST