
Bathymetry and Acoustic Backscatter: Northern Santa Barbara Channel, Southern California
Summary
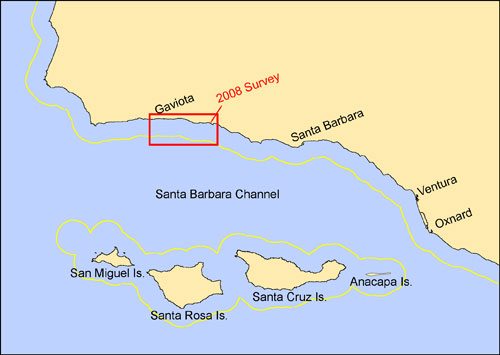
Figure 1. The Santa Barbara Channel in southern California showing the location of the
2008 USGS bathymetry and backscatter mapping (red box). The yellow line shows the
3-nautical mile California State jurisdictional limit.
In the summer of 2008, as part of the California Seafloor Mapping Program (CSMP), the U.S. Geological Survey (USGS), Coastal and Marine Geology mapped a stretch of coast in the Santa Barbara Channel, Southern California east of Gaviota (fig. 1). The CSMP is a cooperative partnership between Federal and State agencies, universities, and industry that is designed to create a comprehensive coastal/marine geologic and habitat basemap series to support the Marine Life Protection Act (MLPA) initiative.
Partners include,
1. California Coastal Conservancy
2. California Ocean Protection Council
3. California State University, Monterey Bay - Seafloor Mapping Lab
4.
Fugro Pelagos Inc.
5. Center for Habitat Studies - Moss Landing Marine Laboratories
6. California State Geological Survey
7.
NOAA National Marine Sanctuaries
8. NOAA Office of Coast Survey
9. NOAA National Marine Fisheries Service
10.
U.S. Geological Survey, Western Coastal and Marine Geology Team
During the past several years the USGS (Cochrane and others, 2007) and CSUMB have partnered to map the nearshore region of the Santa Barbara Channel from the 10-m isobath offshore to the 3-nautical mile State limit. Prior to this nearshore mapping, the deeper waters of the Channel were mapped by the USGS (Dartnell and others, 2005) and Monterey Bay Aquarium Institute.
This report provides the bathymetry and acoustic backscatter data collected during the 2008 USGS mapping mission. The data are provided in a number of different formats, including XYZ (x-coord, y-coord, depth or intensity), GEOTIFF, and ASCIIGRID, for use in many GIS programs. These data can be used for a number of applications, including characterization of benthic habitats, fisheries management, monitoring environmental change, assessment of earthquake and tsunami hazards, and understanding geologic history and change.
DATA COLLECTION
The 2008 mapping mission (USGS Field Activity ID: S-8-08-SC) collected high-resolution bathymetry and coregistered acoustic backscatter data using a 234.5 kHz SEA (AP) Ltd. SWATHplus-M phase-differencing sidescan sonar aboard the USGS R/V Parke Snavely (fig. 2). See table 1 for the system specifications. The survey was completed in 16 days, from July 8, 2008, to July 23, 2008, and about 135 survey lines were collected covering approximately 104 sq km in waters depths ranging from about 10 to 110 m.
 |
| Figure 2. U.S. Geological Survey, Coastal and Marine Geology Research Vessel Parke Snavely. |
Table 1: SWATHplus-m Sonar Specifications
| Sonar Frequency | 234.5 kHz | |
| Maximum Water Depth | 100m | |
| Maximum Swath Width | 300 m (typically 7 to 12 times water depth) | |
| Resolution Across Track (best case) | 5cm | |
| Transmit Pulse Length | 34 ms to 500 ms | |
|
||
| 150 m Swath Width | 10 pings per second | |
| 300 m Swath Width | 5 pings per second | |
| Vertical Accuracy (Range Dependant) | ||
| 57 m | 0.1 m | |
| 114 m | 0.2 m | |
| 171 m | 0.3 m |
DATA PROCESSING
GPS Data Processing
The survey vessel was equipped with a CodaOctopus F190 attitude and position system. This system combines Real Time Kinematic (RTK)(Mowafy, 2000) GPS data (2-cm error ellipse) and inertial motion measurements so that high-precision position and attitude corrections are fed in real-time to the sonar acquisition equipment. During the duration of the survey, two RTK reference stations were occupied along the Santa Barbara coast to ensure full coverage of the survey area. Prior to the survey, the RTK system was calibrated by occupying a USGS benchmark for several hours. During the survey, the WGS84 (G1150) reference frame was used for both horizontal and vertical measurements.
Sound Velocity Measurements
Sound velocity profile measurements were collected regularly throughout the survey with an Applied Micro Systems, SvPlus 3472. This instrument provides time-of-flight sound velocity measurements using invar rods with a sound velocity accuracy of +/− 0.05 m/s, pressure measured by a semiconductor bridge strain gauge to an accuracy to 0.15 percent (Full Scale) and temperature measured by thermistor to an accuracy of 0.05 degrees Celsius. In addition, an Applied Micro Systems Micro SV accurate to +/ − 0.03 m/s was deployed on the transducer frame for real-time sound velocity adjustments at the transducer-water interface.
Sonar Sounding and Backscatter Intensity Processing
GPS data and measurements of vessel motion are combined in the F190 hardware to produce a high-precision vessel attitude packet. This packet is transmitted to the Swath Processor acquisition software in real-time and combined with instantaneous sound velocity measurements at the transducer head before each ping. Up to 10 pings per second are transmitted with each ping consisting of 2,048 samples per side (port and starboard). The returned samples are projected to the seafloor using a ray-tracing algorithm working with the previously measured sound velocity profiles. A series of statistical filters are applied to the raw samples that discriminate the seafloor returns from other unintended targets in the water column. Finally, the processed data are stored, line-by-line in processed trackline files.
The individual soundings stored in the processed trackline files are combined into a 2-m resolution raster in the Grid Processor software. Each bin stores statistics on the samples that fell within the cell including the mean elevation value, the mean backscatter amplitude, the sample count, and measurements of sample precision, such as standard deviation. The 2-m binned elevation values, amplitude values, and the associated bin standard deviation values were exported from Grid Processor as an XYZ point cloud.
The WGS84 (G1150) ellipsoidal coordinates of the survey were transformed into NAD83 (CORS96) ellipsoidal coordinates using a 7-parameter Helmert transformation available in the CS2CS program in the Proj.4 library (Version 442 for 32-bit Windows). The seven required parameters for the procedure were calculated using an Epoch date of 8 July 2008 according to procedure outlined in Soler and Snay (2004). Finally, the resulting NAD83 (CORS96) elevation postings were transformed into NAVD 1988 using the NOAA VDatum (Version 2.2.4) with the Geoid03 model.
A script divided the 2-m binned point cloud into 2 x 2 km tiles. Each tile was gridded using Surfer (Version 9.2.397) and a linear Krigging algorithm and 0.20 cm nugget (the mean standard deviation of all 2-m cells in the survey). Finally, the 2-km tiles were mosaiced into a contiguous raster and converted to an ESRI GRID (fig. 3).
INITIAL RESULTS
BATHYMETRY
The seafloor in the survey area can generally be described as having little relief (fig. 3) compared to other regions of the Santa Barbara Channel. This region is within the east-west tectonic grain of the western Transverse Ranges (Jennings, 1977; Ashley and others, 1997; Saucedo and others, 2000). Low-relief (2-3m) outcrops are found in the nearshore region in less than about 12-m water depth. Kelp cover was considerable near shore at the time of the survey, and only the deeper limits of these outcrops were mapped. A nearshore shelf break begins in the western part of the survey area (A in fig. 3) in about 20 m water depth and trends southwest beyond the 2008 mapping area and eventually merges with the continental shelf break near Point Conception. East and west of Refugio Beach State Park is a series of low relief lobes that appear to flow downslope on a seafloor with less than 3 degrees of slope (B in fig. 3). These lobes appear to be formed by sediment flowing out of the larger canyons in the Santa Ynez Mountains and into the nearshore environment.
 |
| Figure 3. Shaded relief bathymetry in the northern Santa Barbara Channel, southern California, offshore Refugio and El Capitan Beach State Parks. The red box shows the location of the close-up view in Figure 4, while the green box shows the location of the close-up view in Figure 6. The land imagery was generated from IfSAR data available at http://www.csc.noaa.gov/digitalcoast/data/coastalifsar/ . The figure has a sun illumination azimuth of 300 degrees at an angle of 45 degrees. |
Farther offshore, in water depths from about 65 m to the continental shelf break at approximately the 100 m isobath, two main regions of folded ridges and pinnacles are exposed on the seafloor (C and D in fig. 3). These two regions have different morphological characteristics even though they are separated by only 10 km. The western region (C in fig.3; fig. 4) is located within two east-west fold trends (Molino and Secondary Molino fold trends) that are associated with the southward-dipping homocline of the Santa Ynez Range (Ashley and others, 1997). The ridges and pinnacles are the surface expressions of anticlinal and synclinal structures within the fold trends. At mid-shelf, a folded ridge with 1-2 m of relief (E in figs. 3 and 4) bends 180 degrees in a horseshoe pattern. This is a plunging anticlinal structure consisting of the Miocene Sisquoc Formation and Pliocene "Repetto Formation" of Ashley and others (1977). Offshore of this anticlinal structure, a series of 1-m high stepped ridges trend east-west just inshore of the continental shelf break (fig. 4). These linear ridges lie within the Secondary Molino fold trend and merge with more folded ridges to the east. Finally, a series of low-relief gullies incise into the continental shelf break implying that sediment flows from the continental shelf down into the Santa Barbara Basin in this region.
 |
| Figure 4. Close-up view of shaded relief bathymetry in the western, offshore part of the survey area. See the red box in Figure 3 for the location. Profile P-P' shows the location of the bathymetric profile in Figure 5. Figure 4 has a sun illumination azimuth of 300 degrees at an angle of 45 degrees. |
 |
| Figure 5. Bathymetric profile over a pinnacle with over 5 m of relief. See Figure 4 for profile location. |
Towards the east, the Molino and Secondary Molino fold trends begin to die out offshore Refugio Beach State Park (Ashley and others, 1977), and the eastern set of exposed ridges and pinnacles (green box in fig. 3) do not appear to be formed by these structures. Here the ridges trend north-south with relief of 1 m to more than 2-m (figs. 6 and 7).
 |
| Figure 6. Close-up view of shaded relief bathymetry in the eastern, offshore part of the survey area. See the green box in Figure 3 for the location. Profile Q-Q'' shows the location of the bathymetric profile in Figure 7. Figure 6 has a sun illumination azimuth of 300 degrees at an angle of 45 degrees. |
 |
Figure 7. Bathymetric profile over a series of ridges and troughs with 1 -2 m of relief. See Figure 6 for profile location. |
ACOUSTIC BACKSCATTER
All of the seafloor features described in the bathymetry section show prominently in the acoustic backscatter data (fig. 8). In the backscatter data provided in this report, brighter tones indicate higher backscatter intensity possibly from rock or coarser grained sands, while darker tones indicate lower backscatter intensity possibly from finer sediments. As with many sonar mapping systems (bathymetric side scan and multibeam), the intensity is not just a product of the sea floor composition. The intensity represents a complex interaction between the acoustic pulse and the seafloor, as well as characteristics within the subsurface. Backscatter intensity is dependent on the acoustic source level; the frequency used to image the seafloor (234 kHz for this study); the grazing angle; the composition of the seafloor including, grain size, water content, bulk density, and seafloor roughness; and volume reverberations to a few centimeters depth (Urick, 1983; Gardner and others, 1991; Augustin and others, 1996; Blondel and Murton, 1997).
 |
| Figure 8. Acoustic backscatter image in the northern Santa Barbara Channel, S. CA, offshore Refugio and El Capitan Beach State Parks. The brighter tones are higher backscatter intensity while the darker tones are lower backscatter intensity. The land imagery was generated from USGS DEM's. |
The nearshore shelf break (A in fig. 8) shows as higher backscatter. This however is probably due to a slope affect where the slope of the shelf break has higher intensity due to the angle of incidence to the sonar transducer. The nearshore lobes offshore Refugio Beach State Park (B) have slightly higher backscatter than the surrounding seafloor. The rougher seafloor in the offshore regions (C and D in fig. 8) shows up prominately as higher backscatter including the horseshoe shaped ridge of the plunging anticline (E). A pipeline can also be seen in the backscatter imagery trending northeast-southwest from between El Capitan Beach and Refugio Beach State Parks to oil platforms located offshore of the survey area.
Initial seafloor geology interpretations based on the bathymetry and backscatter data and prior knowledge of other regions in the northern Santa Barbara Channel reveal a mixture of bedrock, mixed boulders, cobbles, and sand, and hemipelagic sedimented seafloor. The rougher seafloor with higher backscatter intensity is likely either bedrock or boulder ridges. The smooth seafloor with high backscatter is likely composed of coarse sands, while the smooth seafloor with lower backscatter is likely sedimented sea floor composed of finer sands and muds.CONCLUSIONS
The bathymetry and backscatter data are provided in this report (data) in a number of different formats, including XYZ (x-coord, y-coord, depth or intensity), GEOTIFF, and ASCIIGRID. FGDC metadata is also provided. As part of the California State Mapping Project these data will be ground-truthed with seafloor video, photography, and sediment samples. Final products will include a seafloor character map that will identify areas of rougose rock, mixed (boulder, cobble, sand), and sedimented seafloor. Other products will include seafloor habitat and geologic maps. These data and maps can be used for a number of applications including characterization of benthic habitats, fisheries management, monitoring environmental change, assessment of earthquake and tsunami hazards, and understanding geologic history and change.
ACKNOWLEDGEMENTS
Thanks to Jamie Grover for his skill as captain of the R/V Snavely, to Thomas Reiss for his RTK expertise, and to George Tate, Gerry Hatcher, and Jackson Currie for their marine technical skills. Thanks to Brian Edwards and Eleyne Phillips for their helpful reviews of this report.
REFERENCES
Ashley, R.J., Berry, R.W., and Fischer P.J., 1997, Offshore geology and sediment distribuion of the El Capitan-Gaviota Continental Shelf, Northern Santa Barbara Channel, California. Journal of Sedimentary Petrology, v. 47, no. 1, p. 199-208.
Augustin, J.M., Le Suave, R., Lurton, X., Voisset, M., Dugelay, S., and Satra, C., 1996, Contribution of the multibeam acoustic imagery to the exploration of the sea-bottom. Marine Geophysical Researches, v. 18 p. 459-486.
Blondel, P. and Murton, B.J., 1997, Handbook of seafloor sonar mapping, John Wiley and Sons, New York, 314p.
Cochrane, G.R., Golden, N.E., Dartnell, P., Schroeder, D.M., and Finlayson, D.P., 2007, Seafloor Mapping and Benthic Habitat GIS for Southern California, Volume III. USGS Open-File Report 2007-1271. https://pubs.usgs.gov/of/2007/1271/.
Dartnell, P., Cochrane, G.R., and Dunaway, M., 2005, Multibeam Bathymetry and Backscatter Data: Northeastern Channel Islands Region, Southern California. USGS Open-File Report 2005-1153. https://pubs.usgs.gov/of/2005/1153/.
Gardner, J.V., Field, M.E., Lee, H.J., and Edwards, B.E., 1991, Ground-truthing 6.5-kHz side scan sonographs: what are we really imaging, Journal of Geophysical Research, v. 96, p. 5955-5974.
Jennings, C.W., 1977, Geologic map of California: California Department of Conservation, Division of Mines and Geology, Geologic Data Map No. 2, scale 1:750,000.
Mowafy, A., 2000, Performance Analysis of the RTK Technique in an Urban Environment, The Australian Surveyor v. 45, no. 1, p. 47-54.
Proj.4 (2009) http://trac.osgeo.org/proj/
Saucedo, G.J., Bedford, D.R., Raines, G.L., Miller, R.J., and Wentworth, C.M., 2000, California Division of Mines and Geology, GIS data for the geologic map of California: CDMG CD-ROM 2000-007.
Soler, T. and Snay, R., 2004. Transforming Positions and Velocities between the International Terrestrial Reference Frame of 2000 and North American Datum of 1983. Journal of Surveying Engineering, v. 130, no. 2.
Surfer 9.2 (2009) http://www.goldensoftware.com/
Vdatum 2.2.4 (2009) http://vdatum.noaa.gov/
Urick, R.J., 1983, Principles of underwater sound, 3rd edition, McGraw-Hill Book Company, New York, 423p.
For more information contact: Peter Dartnell
