U.S. Geological Survey Open-File Report 2010-1006
Geophysical and Sampling Data from the Inner Continental Shelf: Northern Cape Cod Bay, Massachusetts

|
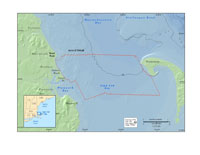
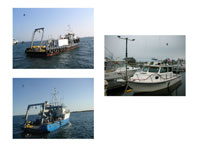
Survey OperationsThe data presented in this report were collected in northern Cape Cod Bay during four geophysical surveys (USGS field activity numbers 06012, 07001, 07002, and 08002) and one bottom sampling survey (07003) conducted by the USGS between 2006 and 2008 (fig. 1; table 1). Surveys 06012 and 07002 consisted of 24 hours per day operations conducted aboard the R/V Megan T. Miller, (fig. 2A) and focused on the eastern portions of the study area generally deeper than 30 m. Surveys 07001 and 08002 consisted of daytime only operations conducted aboard the R/V Rafael (fig. 2B) and focused on the western, nearshore portions of the study area that are generally shallower than 30 m. Sampling operations conducted aboard the R/V Connecticut (fig. 2C) during survey 07003 were performed 24 hours per day and covered the entire survey area. Table 1. Survey details for the data collected in the northern Cape Cod Bay study area. Additional data were collected outside the northern Cape Cod Survey area during USGS surveys 06012, 07001, 07003. The data from those surveys, not included in this report, may be found in Barnhardt and others (2010).
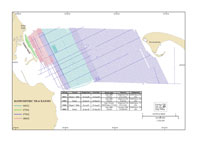
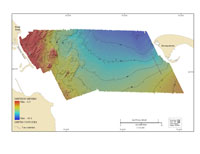
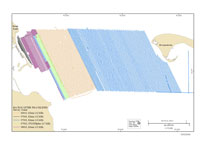
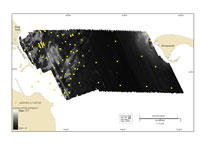
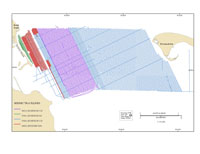
BathymetryBathymetric data were acquired using a Systems Engineering & Assessment, Ltd. (SEA) SWATHplus interferometric sonar system operating at a frequency of 234 or 117 kilohertz (kHz) (figs. 3-4; table 1). During surveys 06012 and 07002, the sonar transducers were mounted on a rigid pole from the starboard side of the R/V Megan T. Miller (fig. 2A), about 2.6 m below the water line. During surveys 07001 and 08002, the sonar transducers were mounted on a rigid pole from the bow of the R/V Rafael (fig. 2B), about 0.5 m below the water line. A motion reference unit (TSS Ltd. Dynamic Motion Sensor (DMS) 2-05 for 06012, and Coda Octopus F180 for 07001, 07002, and 08002) was mounted directly above the transducers and continuously measured vertical displacement (heave) and attitude (pitch and roll) of the vessel during acquisition. Data were acquired with a sonar transmit power of 6-8 (on a relative scale ranging from 1-15 representing 0-100 percent power levels), transmit length of 11-39 cycles, and a receive length of 2,048 or 4,096 samples, depending on the individual survey. Navigation was recorded with a GPS antenna mounted on top of the pole, directly above the SWATHplus transducers. Horizontal and vertical offsets between navigation and attitude antennas and the SWATHplus transducers were applied during acquisition in the configuration files for the SWATHplus and Octopus F180 software. Sound-velocity profiles were collected approximately every 2 hours during all surveys using a hand-casted Applied MicroSystems SV Plus sound velocimeter. A total of 3,289 km of bathymetry were surveyed at an average speed of 5 knots (fig. 3). The lines were spaced 75 to 200 m apart to obtain overlapping swaths of data and complete coverage of the seafloor. The swath width collected by the SWATHplus system was adjusted based on the trackline spacing for the specific survey. Real-Time Kinematic Global Positioning System (RTK-GPS) navigation was used to determine the horizontal and vertical position (x, y, z) of the GPS antenna mounted above the SWATHplus transducers with sub-meter accuracy. The RTK-corrected coordinates were transmitted to the ship from a land-based RTK-DGPS station established by the USGS at NOAA tidal station # 8446009 in Brant Rock, MA (fig. 1). Vertical water-level heights were referenced to Mean Lower Low Water (MLLW) using the offset between North American Vertical Datum of 1988 (NAVD 88) and MLLW published for the tidal benchmark at the station. SWATHplus acquisition software and the Computer Aided Resource Information System (CARIS) Hydrographic Information Processing System (HIPS 6.1) were used to process the raw bathymetric soundings. Navigation data were inspected and edited to eliminate erroneous fixes. Soundings were adjusted using corrections from the motion reference unit (MRU), RTK-GPS water-level heights, and sound-velocity profile data. Spurious soundings were eliminated, and the final processed soundings were gridded at a resolution of 5-m per pixel (fig. 4). Acoustic BackscatterApproximately 3,009 km of acoustic backscatter data were acquired using a Klein 3000 dual-frequency sidescan-sonar operating at 132/445 kHz, or a SWATHplus interferometric sonar operating at 117-kHz (fig. 5). During surveys 06012 and 07002 the Klein 3000 towfish was deployed from an A-frame and towed approximately 20 m astern and 5 m below the surface and collected data with a 200-m swath width (100 m on either side of the vessel). During surveys 07001 and 08002, the Klein 3000 towfish was deployed approximately 3 m astern from a davit on the port side and 1 m below the sea surface and collected data with a 100-m swath width. Backscatter data collected with the SWATHplus sonar were used for lines L68-L73 of survey 07002 because the A-frame used for the Klein 3000 sidescan sonar was inoperable between August 1 and 2, 2007. The 132-kHz data were acquired using a 75-100 m range, a 50 millisecond (ms) pulse length, and a time-varying gain (tvg) of 9-12 decibels (dB) as recorded in the Klein SonarPro acquisition software (versions 9.6 and 10.0) and later corrected for beam angle and slant range distortions by using Xsonar/ShowImage as described in Danforth (1997). The SWATHplus backscatter data were acquired with Swath Processor acquisition software and processed for radiometric normalization corrections using SXP Tools (unpublished USGS software). Each survey line was mapped into geographic space at 1-m pixel resolution, then imported into PCI Geomatica (version 10.1) and combined into a single mosaic. The mosaic was exported out of PCI as an 8-bit georeferenced Tagged Image File Format (TIFF) image (fig. 6).Seismic-Reflection ProfilingApproximately 3,270 km of chirp seismic-reflection data were collected in the northern Cape Cod Bay survey area (fig. 7). During surveys 06012 and 07002, chirp seismic data were collected using an EdgeTech Geo-Star FSSB sub-bottom profiling system and an SB-0512i towfish (FM swept frequency 0.5-12 kHz), which was mounted on a catamaran and towed astern of the R/V Megan T. Miller. EdgeTech J-Star seismic-acquisition software was used to control the Geo-Star topside unit, digitally log trace data in the EdgeTech JSF format, and record GPS navigation coordinates to the JSF trace headers. Data were acquired using a 0.25-second (s) shot rate, a 9-millisecond (ms) pulse length, and a 0.5- to 6-kHz frequency spectrum during survey 06012, and a 0.25-s shot rate, a 5-ms pulse length, and a 0.5- to 8-kHz frequency spectrum during 07002. Recorded trace lengths were either 250 or 266 ms. Northwest-southeast oriented tracklines were spaced 100 m apart for 06012 and 07002. Tielines collected during 07002 were spaced between 1,000 and 3,500 m apart. During survey 07001, chirp seismic data were collected using an EdgeTech Geo-Star FSSB sub-bottom profiling system and an SB-424 towfish (FM swept frequency 4-24 kHz), which was mounted on a rigid pole on the starboard side of the R/V Rafael. EdgeTech J-Star and Triton Imaging, Inc. SB-Logger seismic-acquisition software was used to control the Geo-Star topside unit, digitally log trace data in EdgeTech JSF and SEG-Y Revision 1 formats, respectively, and record GPS navigation coordinates to the JSF and SEG-Y trace headers. Data were acquired using a 0.25-s shot rate, a 10-ms pulse length, and a 4- to 16-kHz frequency spectrum. Recorded trace lengths were approximately 250 ms. Northwest-southeast oriented tracklines were spaced between 75 and 100 m apart. During survey 08002, chirp seismic data were collected using a dual-frequency (3.5 and 200 kHz) Knudsen Engineering Limited Chirp 3200 system with transducers mounted on a rigid pole on the starboard side of the R/V Rafael. Knudsen SounderSuite seismic-acquisition software was used to control the Chirp 3200 system, digitally log trace data in the SEG-Y Revision 1 format, and record GPS navigation coordinates to the SEG-Y trace headers. Data were acquired using a 0.25- or 0.5-s shot rate, a 1- or 2-ms pulse length, and a center frequency of 3.5 kHz. Recorded trace lengths were 67 and 135 ms, depending on the shot rate interval. Northwest-southeast oriented tracklines were spaced between 75 and 150 m apart. All of the raw chirp seismic-reflection data were post-processed using SIOSEIS (Henkart, 2007) and Seismic Unix (Stockwell and Cohen, 2007). Post-processing included the inspection and editing of navigation data, the auto identification of seafloor reflections based on amplitude, and the removal of sea-surface heave from the trace data. Profiles of the final processed trace data are included in this report as 8-bit, grayscale, variable-density plots in the Joint Photographic Experts Group (JPEG) format. The final shot-point and trackline navigation are also included in two ESRI shapefiles. Ground ValidationSurficial Sediment Samples and Grain-Size AnalysesSediment samples were collected at 98 stations with a modified Van Veen grab sampler at the end of the drift. Sediment samples were not obtained at 10 locations because of hard or rocky seafloor. The upper 2 cm of sediment from the top of the Van Veen grab were sampled and analyzed at the USGS sediment laboratory for grain size following the standard procedures described in Poppe and others (2005). The analytical data for each sample included location, bulk weight, percent of sample in each 1-phi size class from -5 phi to 11 phi, sediment classification, kurtosis, and other sediment-related statistics. These data are available in spreadsheet or geospatial format in Appendix 2 (Textural Analyses). Photography and VideoThe USGS SEABed Observation and Sampling System (SEABOSS; Valentine and others, 2000) was deployed from the R/V Connecticut during survey 07003 to validate the geophysical data collected in the northern Cape Cod Bay survey area (fig. 6; table 1). At each of the 109 planned stations, the SEABOSS was lowered to the seafloor from a J-frame on the starboard side of the R/V Connecticut and collected continuous bottom video (not included in this report) as the vessel and sampler drifted for about 5-7 minutes at each station. One hundred of the stations were located within the northern Cape Cod Bay survey area, and nine stations were sampled to the west, at the entrance to Plymouth Bay. Six hundred and seventy-three high-resolution digital photographs were taken with a Minolta Dimage A2 digital camera at user-defined locations along the drift. Photographs were saved to the memory card in the camera in JPEG format with a 3,264 x 2,448 pixel resolution. |