U.S. Geological Survey Open-File Report 2010-1251
Moderate-Resolution Sea Surface Temperature Data for the Nearshore North Pacific
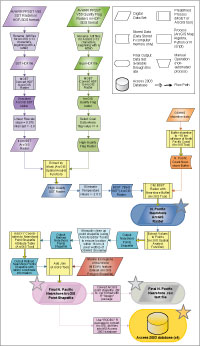
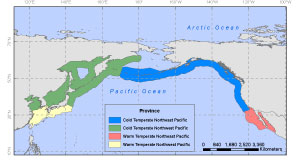
The steps taken to convert AVHRR data to nearshore SST data are detailed in flow-chart form in Figure 1. As the focus was on nearshore environments, the study area in each ecoregion is limited to within approximately 16 km of the coastline (fig. 2). The grid cell resolution of the AVHRR PFSST data was 4 km² and the offshore distance was determined by counting four grid cells seaward of the coastline defined by the Global Self-consistent, Hierarchical, High-resolution Shoreline (GSHHS) data set (Wessel and Smith, 1996). The Marine Geospatial Ecology Tools v. 0.8 (MGET) were used to convert the Pathfinder PFSST V5 and V5.1 data from its native HDF-SDS format to ArcGIS GRID raster format (Roberts and others, 2010). MGET was developed by Duke University's Marine Geospatial Ecology Laboratory for exploring spatial aspects of ecological data and is integrated into the ESRI ArcGIS environment for use in conjunction with other geoprocessing tools, including Python, Matlab, R, and C++. The MGET extension is available at http://code.env.duke.edu/projects/mget. HDF to GRID conversion is a two step process. The georeferencing (header information) parameters for data conversion must be extracted first using MGET or another HDF tool. The extracted parameters are then used in the MGET conversion tool to create ArcGIS rasters (GRIDs). A parallel processing path is followed whereby a HDF SST file, which contains the mean SSTs recorded by the AVHRR instrument over a one-month period, and its corresponding HDF Quality (hereafter qual) file are transformed (by MGET) into ArcGIS GRIDs. The SST GRIDs were then scaled using the equation provided in the AVHRR header in order to obtain SST values in degrees Celsius. Application of this scaling equation on floating point data created variable precision of the SST values (RASTERVALU) from 0 to 8 digits. The SST values were not rounded or truncated during the data processing. The qual value GRIDs were transformed into binary masks in which pixels of flag values ≥ 4 were converted into 1s and those with values 0-3 were converted to 0s (as discussed in the data description). The monthly SST data were produced by applying the qual mask to the SST GRID raster to eliminate SST values with corresponding quality flag values of less than 4. The next step was to eliminate implausible SST values (< -2.0 °C) that occasionally appear at the higher latitudes. The ArcToolbox buffering tool (available with the ArcInfo version of the ESRI software) was used to create a buffer to isolate SST raster pixels within 16 km of the GSHHS shoreline. This buffer is essentially a polygon shapefile that functions as a clipping feature. It was used to crop the global SST rasters to the North Pacific nearshore extent. These nearshore raster data are available for download from the "downloads" page of this website (click "downloads" on the left-side menu). For each nearshore raster data file, a point shapefile was created in which each point represents the centroid of a corresponding grid cell and was assigned the associated SST value. The Spatial Analyst ArcGIS extension "Extract Values to Points" tool was used to collect these point values. These steps were systematically repeated to generate a point shapefile of near-coastal SST values—one for each month of each year in the 1981-2009 record. To ensure consistent results, the processes of reading in the native SST HDF files through the point extraction step was automated through a combination of using the ModelBuilder tool within ArcGIS and manual scripting in the Python 2.5 language. Each individual monthly mean file contains approximately 40,000 points. In the datasets offered here, we include the points having NoData values, designated as "-9999." As previously described, the lack of data at these points can be due to glint, sea-ice cover, atmospheric obscuration, or the coarseness of the MODIS land mask used in comparison to the GSHHS shoreline. All SST values are recorded in degrees Celsius and are found under the "RASTERVALU" heading. In addition to the nearshore raster dataset, and nearshore point shapefile dataset (also available in .csv format), a dataset is provided consisting of four Access databases created by exporting the ArcGIS .dbf files directly into Access databases (.mdb format) using the RODBC package in R. The Access 2003 databases are divided by Marine Province (Warm Temperate Northwest Pacific, Cold Temperate Northwest Pacific, Warm Temperate Northeast Pacific, Cold Temperate Northeast Pacific, see Figure 3). This division was necessary due to the 2 GB size constraint on each Access 2003 database. The Access databases are also publically available through the download links provided on the left-hand side bar.
|

![]() U.S. Department of the Interior |
U.S. Geological Survey
U.S. Department of the Interior |
U.S. Geological Survey
URL: http://pubsdata.usgs.gov/pubs/of/2010/1251/processing.html
Page Contact Information: GS Pubs Web Contact
Page Last Modified: Wednesday, 07-Dec-2016 23:21:53 EST