 |
Figure 1. Location of the combined multibeam and LIDAR bathymetric dataset (eliscomb) released in this report (red polygon) and other bathymetric and backscatter surveys completed in Long Island Sound. Also shown are the locations of onshore end moraines (black polygons). Other surveys by the NOAA Ships Thomas Jefferson and Rude are shown in light gray and include H11043—Poppe and others (2004, 2006a); H11044—McMullen and others (2005), Poppe and others (2008a); and H11045—Beaulieu and others (2005); H11255—Poppe and others (2006c); H11250—Poppe and others (2006b, 2007a); H11252/H11361—Poppe and others (2007b, 2008b); H11441/H11442/H11224/H11225—Poppe and others (2010a); H11445—McMullen and others (2010); H11251—Poppe and others (2010b); H11446—McMullen and others (2011); and H11997—Poppe and others (2011). Sites of USGS sidescan-sonar surveys are shown in dark gray and include Norwalk—Twichell and others (1997); Milford—Twichell and others (1998); New Haven Harbor and New Haven Dumping Grounds—Poppe and others (2001); Roanoke Point—Poppe and others (1999a); Falkner Island—Poppe and others (1999b); Hammonasset—Poppe and others (1997); Niantic Bay—Poppe and others (1998c); New London—Lewis and others (1998), Zajac and others (2000, 2003); Fishers Island Sound—Poppe and others (1998b). |
 |
Figure 2. Port-side view of the National Oceanographic and Atmospheric Administration Ship Thomas Jefferson at sea. The 30-foot survey launch normally stowed on this side of the ship has been deployed. |
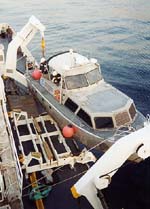 |
Figure 3. The National Oceanographic and Atmospheric Administration Launch 3102 being deployed from the NOAA Ship Thomas Jefferson. |
 |
Figure 4. Starboard-side view of the National Oceanographic and Atmospheric Administration Launch 3102 at sea. |
 |
Figure 5. The RESON 7125 multibeam echosounder system hull-mounted to the National Oceanographic and Atmospheric Administration Ship Thomas Jefferson. |
 |
Figure 6. The RESON Seabat 8101 multibeam echosounder system hull-mounted to the National Oceanographic and Atmospheric Administration Launch 3102. |
 |
Figure 7. The RESON Seabat 8125 multibeam echosounder system hull-mounted to the National Oceanographic and Atmospheric Administration Launch 3101. |
 |
Figure 8. Sea-Bird Electronics, Inc., conductivity-temperature-depth (CTD) profiler. Data derived from frequent deployments of this device were used to correct sound velocities for the multibeam data. |
 |
Figure 9. Brooke Ocean Technology Moving Vessel Profiler with a Sea-Bird Electronics, Inc., conductivity-temperature-depth (CTD) profiler used to correct sound velocities for the multibeam data. |
 |
Figure 10. Image shows a Dash 8-202 series aircraft containing the airborne part of the LADS Mk II system at the Groton - New London airport, Connecticut. |
 |
Figure 11. Digital terrain model of the sea floor produced from the combined multibeam and LIDAR bathymetry collected during National Oceanographic and Atmospheric Administration surveys H11224, H11225, H11250, H11251, H11252, H11361, H11441, H11442, H11445, H11446, H11997, H11999, H12012, and H12013 and gridded to 4 meters. Image is sun-illuminated from the north and vertically exaggerated 5X. Hotter colors (reds) are shallower areas; cooler colors (blues and purples) are deeper areas. See key for depth ranges. |
 |
Figure 12. Locations of detailed planar views of the 4-meter digital terrain model (yellow polygons) produced from the contiguous National Oceanographic and Atmospheric Administration surveys in eastern Long Island Sound. |
 |
Figure 13. Detailed planar view of exposed bedrock from the 4-meter digital terrain model (DTM) released in this report. Bathymetric data from this part of the DTM were originally collected during National Oceanic and Atmospheric Administration surveys H11250 and H11997. Glacially smoothed bedrock ridges parallel similar features and glacial striations onshore (Goldsmith, 1962); strike ridges parallel those of the onshore Avalon Terrane. Location of view is shown in figure 12. |
 |
Figure 14. Detailed planar view of bedrock outcrops off Black Point from the 4-meter digital terrain model (DTM) released in this report. Bathymetric data from this part of the DTM were originally collected during National Oceanic and Atmospheric Administration survey H11442. Comet structures suggest westward transport. Location of view is shown in figure 12. |
 |
Figure 15. Detailed planar view of the rough bouldery sea floor north of Rocky Point from the 4-meter digital terrain model (DTM) released in this report. Bathymetric data from this part of the DTM were originally collected during National Oceanic and Atmospheric Administration survey H11251. Boulders rest on the surface of the submerged Harbor Hill-Roanoke Point-Fishers Island end moraine. Location of view is shown in figure 12. |
 |
Figure 16. Detailed planar view of a previously unrecognized recessional end moraine in western Block Island Sound from the 4-meter digital terrain model (DTM) released in this report. Bathymetric data from this part of the DTM were originally collected during National Oceanic and Atmospheric Administration survey H11250. Location of view is shown in figure 12. |
 |
Figure 17. Detailed planar view of the large scour depression at the northern entrance to Plum Gut from the 4-meter digital terrain model (DTM) released in this report. Bathymetric data from this part of the DTM were originally collected during National Oceanic and Atmospheric Administration surveys H11445, H11446, and H11997. Note the presence of comet structures suggesting westward transport and the sand-wave fields. Location of view is shown in figure 12. |
 |
Figure 18. Detailed planar view of transverse sand waves around the western end of Six Mile Reef from the 4-meter digital terrain model (DTM) released in this report. Bathymetric data from this part of the DTM were originally collected during National Oceanic and Atmospheric Administration survey H11361. Note that asymmetry of the sand waves and scour around the wreck of the 80-meter Lake Hemlock, a converted WW1 cargo ship, indicate net westward sediment transport. Location of view is shown in figure 12. |
 |
Figure 19. Detailed planar view of barchanoid and transverse sand waves in the southwestern part the 4-meter digital terrain model (DTM) released in this report. Bathymetric data from this part of the DTM were originally collected during National Oceanic and Atmospheric Administration survey H11999. Note the variety of sand-wave morphologies present, abrupt transitions from the sand-wave fields to the relatively flat surrounding sea floor, and data gaps from incomplete multibeam coverage during acquisition. Location of view is shown in figure 12. |
 |
Figure 20. Detailed planar view of anthropogenic artifacts off New London, Connecticut, from the 4-meter digital terrain model (DTM) released in this report. Bathymetric data from this part of the DTM were originally collected during National Oceanic and Atmospheric Administration survey H11441. Note the presence of the dredged harbor channel, associated mooring anchors, and dredge spoils in the New London Dumping Ground. Location of view is shown in figure 12. |
 |
Figure 21. Detailed planar view of the sea floor around Hatchet Reef near the mouth of the Connecticut River from the 4-meter digital terrain model (DTM) released in this report. Bathymetric data from this part of the DTM were originally collected during National Oceanic and Atmospheric Administration survey H12013. Note asymmetry of the scour around bedrock outcrops indicating net southwestward sediment transport and data gaps from incomplete multibeam coverage during acquisition. In this case, full hydrographic coverage was achieved with sidescan sonar. Location of view is shown in figure 12. |


