U.S. Geological Survey Open-File Report 2011–1149
Sea-Floor Geology of Long Island Sound North of Duck Pond Point, New York
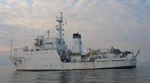
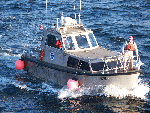
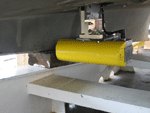
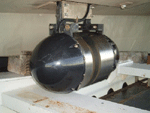
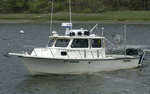
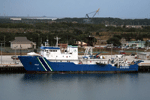
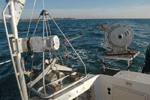
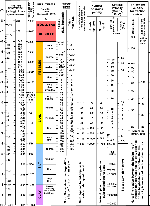
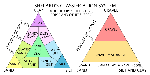
Multibeam-Echosounder DataBetween October 2 and October 29, 2008, the NOAA Ship Thomas Jefferson and two 8.5-m-long launches, 3101 and 3102, were used to collect MBES data for NOAA survey H11999 (figs. 4 and 5). The Thomas Jefferson was equipped with a RESON SeaBat 7125 (fig. 6), operating at a frequency of 400 kilohertz (kHz). Launch 3101 used a RESON SeaBat 8125 (fig. 7), which operates at 455 kHz, and launch 3102 used a RESON SeaBat 8101 (fig. 8), which operates at 240 kHz. Ship positioning was determined by differential global positioning system with corrections from U.S. Coast Guard beacons in Acushnet, Massachusetts, and Moriches, N.Y. Water depths were referenced to the mean lower low water tidal datum by applying a discrete tidal zoning model with verified water levels from tide gauges at Thames River, New London, Connecticut, and New Haven Harbor, New Haven, Conn. MBES data were acquired in extended Triton data format (XTF) and recorded digitally through a Triton Imaging Inc. ISIS data acquisition system. XTF data were processed using CARIS Hydrographic Image Processing System (HIPS) software to incorporate sound-velocity and tidal corrections and check the quality of the data. Sound-velocity corrections were derived from Sea-Bird Electronics Inc. SEACAT conductivity-temperature-depth (CTD) profiles, which were conducted every 3 to 4 hours during MBES acquisition. Vertical resolution of the MBES data is about 0.5 percent of the water depth. The data were gridded to 2-m horizontal resolution and saved to a CARIS HIPS database. Vertically exaggerated (x5), hill-shaded (illuminated from the north at 45°) imagery was created using CARIS HIPS software. Further information on the MBES data acquisition and equipment is detailed in the H11999 Descriptive Report (National Oceanic and Atmospheric Administration, 2008). Sediment Samples and Bottom PhotographySediment samples and bottom photography, including both still images and video photography, were obtained during USGS cruises 2010-010-FA, aboard the USGS research vessel (RV) Rafael (fig. 9), and 2010-015-FA, aboard the U.S. Environmental Protection Agency (EPA) ocean survey vessel (OSV) Bold (fig. 10). On April 17, 2010, 15 stations in the study area were occupied during cruise 2010-010-FA. Samples and photographs were collected with the small SEABed Observation and Sampling System (SEABOSS). On May 24, 2010, eight stations were occupied in the study area during cruise 2010-015-FA, which used the mid-sized SEABOSS to collect samples and photography. Both SEABOSS systems are modified Van Veen grab samplers with still and video cameras attached (fig. 11). Photography is used to help characterize the sea-floor environments and observe floral and faunal communities. Sediment samples were obtained from the upper 2 centimeters (cm) of the sea floor for grain-size analysis at the USGS Woods Hole Coastal and Marine Science Center's Sediment Lab. Samples were wet-sieved to separate coarse (diameters greater than or equal to 0.0625 millimeters (mm)) and fine (diameters less than 0.0625 mm) fractions. Coarse fractions of samples were analyzed using sieves, and fine fractions were analyzed using a Coulter Counter. Sediment descriptions are based on Wentworth's (1922) nomenclature (fig. 12) and Shepard's (1954) size classifications (fig. 13). Detailed information on grain-size analysis procedures is provided in Poppe and others (2005). Interpretations presented in this report are based on bathymetry, sediment data, and still and video photography. Morphology and height are used to characterize bedforms. Sand waves are higher than 1 m, megaripples are 0.2 to 1 m high, and ripples are less than 0.2 m high (Ashley, 1990). Bathymetric data are not to be used for navigation. To view files in PDF format, download a free copy of Adobe Reader. |