Bathymetry and Acoustic Backscatter—Elwha River Delta, Washington
Figures
-
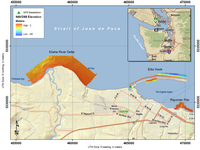 Figure 1.
(1.4 MB) Figure 1.
(1.4 MB)
Location map of the Elwha River Delta, Washington, Port Angeles Harbor, and the surrounding areas with 2010 U.S. Geological Survey bathymetry and acoustic-backscatter survey areas shown. The GPS base station used for vertical control of the survey occupied a temporary benchmark "Mills" positioned at the base of Ediz Hook about 10 km from the far western edge of the Elwha survey area.
-
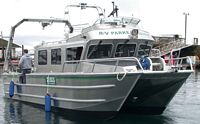 Figure 2.
(0.2 MB) Figure 2.
(0.2 MB)
Photograph of the U.S. Geological Survey R/V Parke Snavely.
-
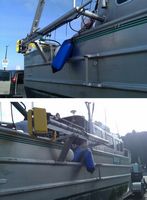 Figure 3.
(0.9 MB) Figure 3.
(0.9 MB)
Fore and aft photographs of the SWATHplus sonar pole mount on the R/V Parke Snavely.
-
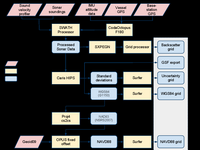 Figure 4.
(0.1 MB) Figure 4.
(0.1 MB)
Processing workflow diagram for converting soundings to a Digital Elevation Model (DEM).
-
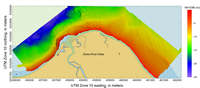 Figure 5.
(0.9 MB) Figure 5.
(0.9 MB)
Plan view of Elwha River Delta, Washington, bathymetry.
-
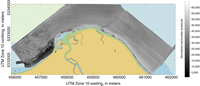 Figure 6.
(0.4 MB) Figure 6.
(0.4 MB)
Normalized backscatter amplitude of the Elwha River Delta, Washington.
-
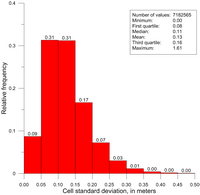 Figure 7.
(0.1 MB) Figure 7.
(0.1 MB)
Histogram of cell standard deviations in the Elwha River Delta, Washington, survey area.
-
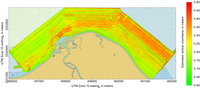 Figure 8.
(0.7 MB) Figure 8.
(0.7 MB)
Estimated vertical uncertainty of the elevation values in the Elwha River Delta, Washington, survey dataset.
-
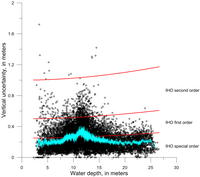 Figure 9.
(0.1 MB) Figure 9.
(0.1 MB)
Uncertainty in sounding elevation for the Elwha River Delta, Washington, survey as a function of water depth, with International Hydrographic Organization (IHO) standards shown for comparison. Sounding uncertainty is calculated as 1.96 x the standard deviation of sounding elevations in a 1 m x 1 m grid. For clarity, only 1 percent of the dataset (143,473 randomly selected points) is shown. The maximum vertical uncertainty allowed for each IHO survey order is plotted as red lines; the 51-point running average vertical uncertainty of the dataset is shown in cyan.
-
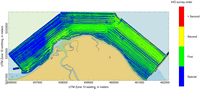 Figure 10.
(0.8 MB) Figure 10.
(0.8 MB)
Bathymetric uncertainty (95-percent confidence) classified by minimum International Hydrographic Organization (IHO) Survey Standards.
-
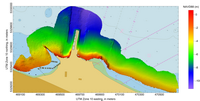 Figure 11.
(0.6 MB) Figure 11.
(0.6 MB)
Bathymetry around Rayonier Pier, Port Angeles Harbor, Washington.
-
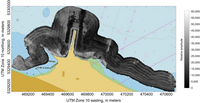 Figure 12.
(0.4 MB) Figure 12.
(0.4 MB)
Acoustic backscatter around Rayonier Pier, Port Angeles Harbor, Washington.
-
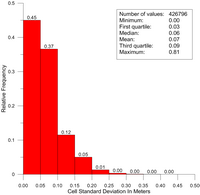 Figure 13.
(0.1 MB) Figure 13.
(0.1 MB)
Histogram of elevation standard deviations for Rayonier Pier, Port Angeles Harbor, Washington. Ninety-five percent of the elevation cells in the Rayonier Pier data set have total vertical uncertainty (TVU) less than 35 cm.
-
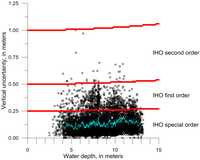 Figure 14.
(0.1 MB) Figure 14.
(0.1 MB)
Uncertainty in sounding elevation around Rayonier Pier, Port Angeles Harbor, Washington, as a function of water depth, with International Hydrographic Organization (IHO) standards shown for comparison. Sounding uncertainty is calculated as 1.96 x the standard deviation of sounding elevations in a 1 m x 1 m grid. For clarity, only 1 percent of the data set (8,420 randomly selected points) is shown. The maximum vertical uncertainty allowed for each IHO Survey order is plotted as red lines; the 51-point running average vertical uncertainty of the dataset is shown in cyan.
-
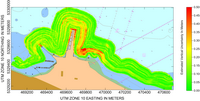 Figure 15.
(0.3 MB) Figure 15.
(0.3 MB)
Rayonier Pier, Port Angeles Harbor, Washington, survey estimated vertical uncertainty. Most of the area has vertical uncertainty in the 10-cm to 15-cm range; however, one trackline was collected with degraded GPS position fixes, resulting in an increase in vertical uncertainty of as much as 50 cm.
-
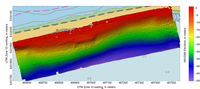 Figure 16.
(0.9 MB) Figure 16.
(0.9 MB)
Ediz Hook (inside), Port Angeles Harbor, Washington, bathymetry. This site was once a log storage area for the harbor, and many logs are visible in the bathymetry and backscatter.
-
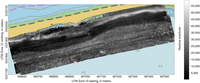 Figure 17.
(0.7 MB) Figure 17.
(0.7 MB)
Acoustic backscatter of the Ediz Hook (inside), Port Angeles Harbor, Washington, survey area.
-
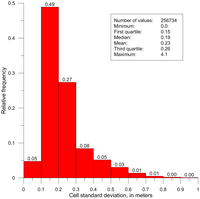 Figure 18.
(0.1 MB) Figure 18.
(0.1 MB)
Histogram of elevation standard deviations for 1 m x 1 m cells in the Ediz Hook (inside), Port Angeles Harbor, Washington, survey area.
-
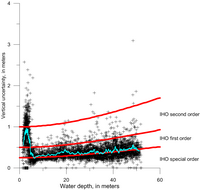 Figure 19.
(0.1 MB) Figure 19.
(0.1 MB)
Uncertainty in sounding elevation around Ediz Hook (inside), Port Angeles Harbor, Washington, as a function of water depth, with International Hydrographic Organization (IHO) standards shown for comparison. Sounding uncertainty is calculated as 1.96 x the standard deviation of sounding elevations in a 1 m x 1 m grid. All of the dataset points are shown (5,168 points). The maximum vertical uncertainty allowed for each IHO Survey order is plotted as red lines; the 51-point running average vertical uncertainty of the data set is shown in cyan.
-
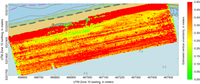 Figure 20.
(0.7 MB) Figure 20.
(0.7 MB)
Ediz Hook (inside), Port Angeles Harbor, Washington, survey estimated vertical uncertainty. Most of the area has total vertical uncertainty about 45 cm to 75 cm, which is close to or exceeds the uncertainty threshold required of International Hydrographic Organization (IHO) order-1 surveys. However, the seafloor here is strewn with logs and debris and the elevated total vertical uncertainty likely reflects this fact rather than degraded sonar performance.
-
 Figure 21.
(0.4 MB) Figure 21.
(0.4 MB)
Ediz Hook (outside), Port Angeles Harbor, Washington, bathymetry.
-
 Figure 22.
(0.7 MB) Figure 22.
(0.7 MB)
Ediz Hook (outside), Port Angeles Harbor, Washington, relative backscatter amplitude.
-
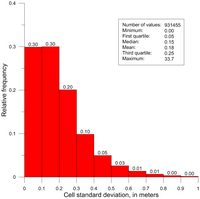 Figure 23.
(0.1 MB) Figure 23.
(0.1 MB)
Histogram of elevation standard deviations for 1 m x 1 m cells in the Ediz Hook (outside), Port Angeles Harbor, Washington, survey area. Ninety-five percent of the survey grid had standard deviations < 0.5 m.
-
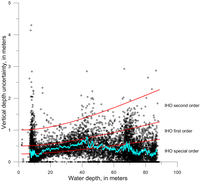 Figure 24.
(0.1 MB) Figure 24.
(0.1 MB)
Uncertainty in sounding elevation around Ediz Hook (outside), Port Angeles Harbor, Washington, as a function of water depth, with International Hydrographic Organization (IHO) standards shown for comparison. Sounding uncertainty is calculated as 1.96 x the standard deviation of sounding elevations in a 1 m x 1 m grid. All of the dataset points are shown (9,256 points). The maximum vertical uncertainty allowed for each IHO survey order is plotted as red lines; the 51-point running average vertical uncertainty of the dataset is shown in cyan.
-
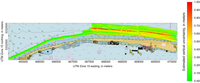 Figure 25.
(0.4 MB) Figure 25.
(0.4 MB)
Ediz Hook (outside), Port Angeles Harbor, Washington, survey estimated total vertical uncertainty (TVU). Most of the area has TVU less than 40 cm, which meets International Hydrographic Organization (IHO) first-order survey standards.
|


 Figure 1
 Figure 2
 Figure 3
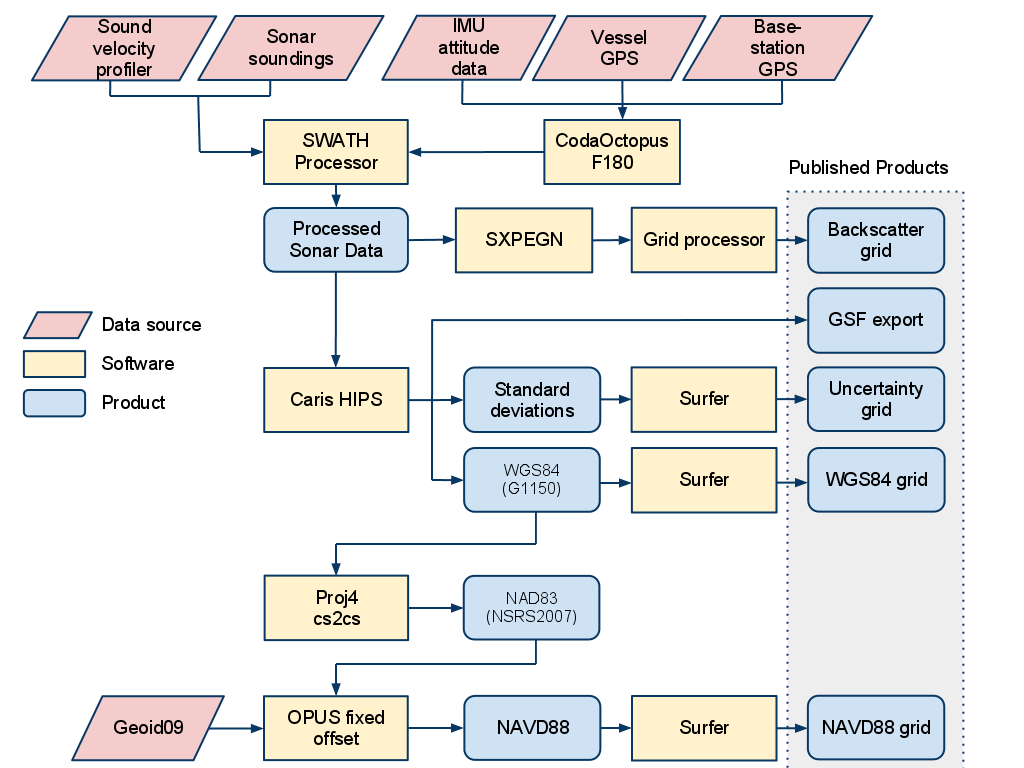 Figure 4
 Figure 5
 Figure 6
 Figure 7
 Figure 8
 Figure 9
 Figure 10
 Figure 11
 Figure 12
 Figure 13
 Figure 14
 Figure 15
 Figure 16
 Figure 17
 Figure 18
 Figure 19
 Figure 20
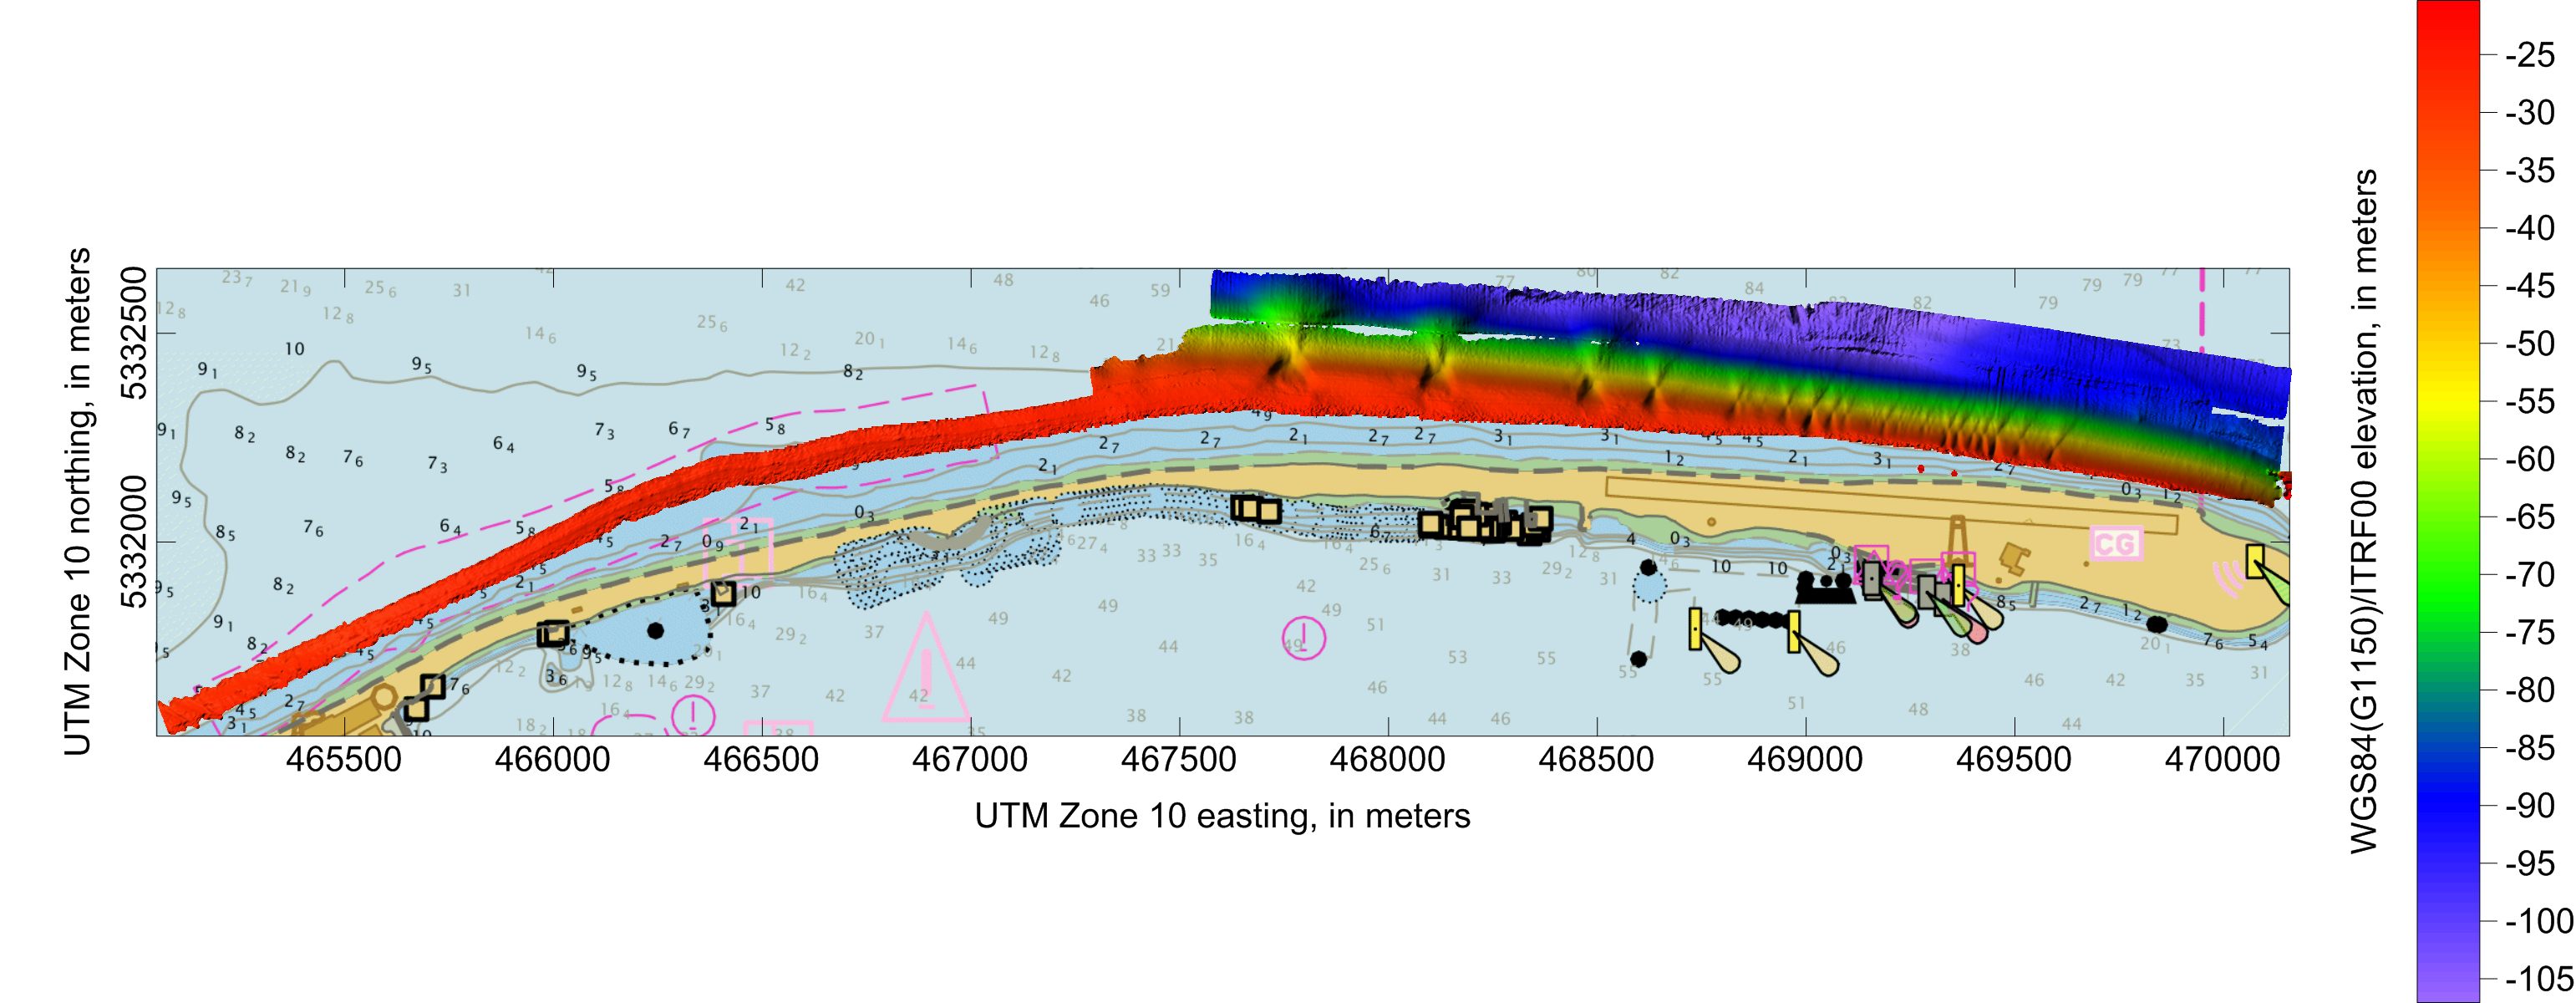 Figure 21
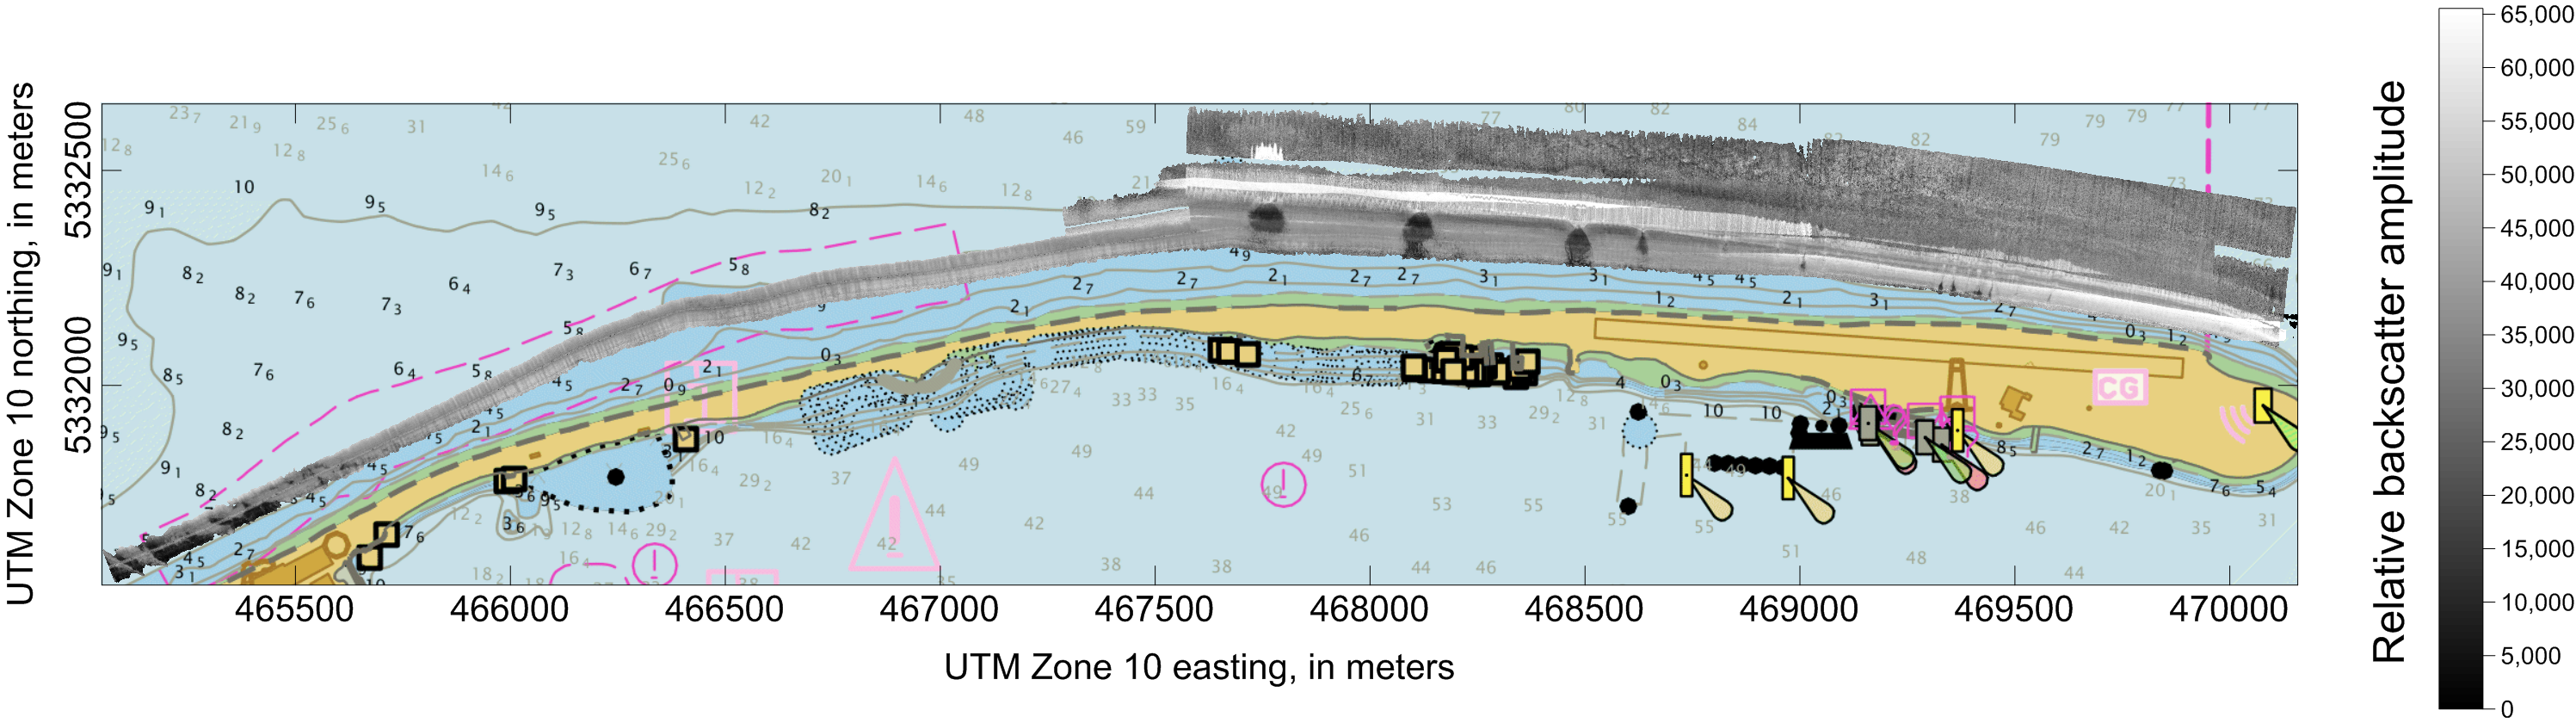 Figure 22
 Figure 23
 Figure 24
 Figure 25