Open-File Report 2011-1246
Moderate-Resolution Sea Surface Temperature Data and Seasonal Pattern Analysis for the Arctic Ocean Ecoregions
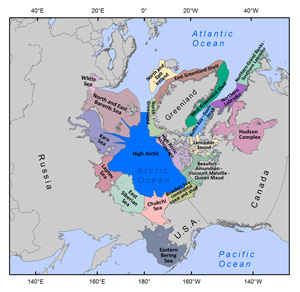
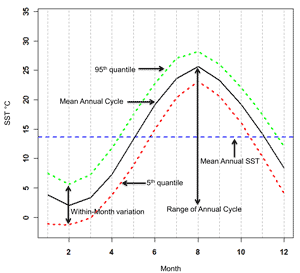
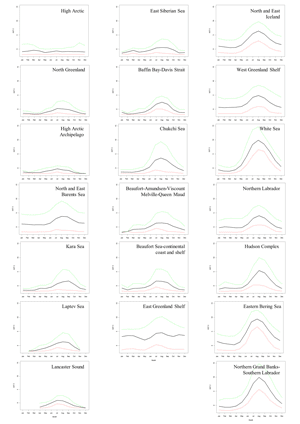
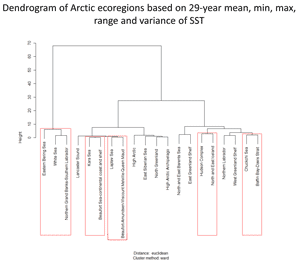
MEOW FrameworkIn the effort to characterize Arctic Ocean environments at a regional scale, we analyzed the SST measurements by marine "ecoregions" as defined by The Nature Conservancy in their MEOW biogeographic schema (Spalding and others, 2007). The MEOW schema is a global hierarchical classification system of coastal zones that divides the world's coastal areas into 12 distinct marine "realms." The realms are further divided into 62 marine "provinces," which are further divided into 232 "ecoregions." The analyses presented here focus on the 19 ecoregions within the Arctic realm (fig. 1). Additionally, the Arctic Ocean to the north of the MEOW Arctic ecoregions is included in the analyses, resulting in the creation of one additional ecoregion named "High Arctic." The following protocol is used to describe the SST patterns within an individual ecoregion. All 29 years of the derived SST values of mean monthly SST grid cells within an ecoregion were pooled to calculate the monthly mean SSTs for each ecoregion, as well as a suite of other metrics derived from the monthly means as summarized in tables 2 and 3. Study AreaThe Arctic and High Arctic ecoregions are shown in figure 1. We do not adhere to the strict definition of the Arctic including only the area north of the Arctic Circle (about 66.5 ºN circle of latitude). We include the entire areas of the Eastern Bering Sea and Northern Grand Banks-Southern Labrador ecoregions, which fall outside of the Arctic Circle. Much of the High Arctic is subject to perennial sea ice cover, and thus has a relatively steady annual surface temperature cycle, with little month-to-month (or within-month) variations (fig. 3). However, even lower latitude ecoregions (for example, the Bering Sea) are greatly affected by seasonal sea ice cover and have been the subject of recent research due to dramatic reductions in seasonal sea ice and multi-year sea ice, especially notable within the last decade. Presence of sea ice keeps benthic waters cold by preventing convection and mixing with surface water. Spatial sea ice cover and summer retreat is variable from year-to-year, and young ice can greatly influence the rate and potential for summer ice melt (Drobot and others, 2008). However, it is the thicker, multi-year ice that moderates long-term Arctic water temperatures, and multi-year ice is becoming progressively younger (Maslanik and others, 2007). The trend in sea ice reduction has been concurrent with a shift in biodiversity away from benthic shelf populations and towards pelagic species—a trend threatening to disrupt the stability of Arctic food-webs (Grebmeier and others, 2006; Mueter and Litzow, 2008). Arctic Annual CyclesTable 2 identifies and defines the metrics used in the analysis and figure 3A provides a diagrammatic description of these metrics. Table 3 provides summary statistics for most of the metrics. Figure 3B shows the mean annual SST cycles experienced within Arctic ecoregions over the 29-year period with statistical metrics that are summarized in table 2. The mean annual SST (29-year mean) among the Arctic ecoregions ranges from -1.2 ºC in the High Arctic Archipelago ecoregion to a maximum of 3.8 ºC in the Eastern Bering Sea. There is a significant decreasing trend of variance in SST with mean latitude. The ecoregions with the greatest variance are the White Sea, Eastern Bering Sea, and Northern Grand Banks-Southern Labrador, and those with the least variance are the High Arctic and High Arctic Archipelago ecoregions (fig. 3B). Undoubtedly, this is the result of sea ice extent over the Arctic Ocean. The mean annual SST cycles in the Arctic ecoregions are shown in figure 3B. Within an ecoregion, the range of the annual cycle is defined by the difference between the minimum 29-year monthly mean and the maximum 29-year monthly mean SST (see fig. 3A, table 2). The minimum monthly mean SST in the Eastern Bering Sea and North and East Iceland occurs in April. The High Arctic, North and East Barents Sea, Northern Labrador, and East Greenland Shelf have minimums occurring in May, and the East Siberian Sea and Beaufort-Amundsen-Viscount Melville-Queen Maud experience SST minimums in January. The remainder of the Arctic ecoregions have minimum monthly-mean SSTs occurring in February and March. The annual cycle temperature ranges generally are greater at lower latitudes and in inland/marginal water bodies (for example, White Sea and Northern Grand Banks-Southern Labrador ranges greater than 10 ºC) as opposed to ecoregions at polar latitudes (High Arctic and High Arctic Archipelago ranges less than 2 ºC). The greatest annual cycle temperature range occurs in the White Sea ecoregion, which has a range of 11 °C, and the High Arctic ecoregion has the smallest range of about 0.8 °C. The second type of temporal fluctuation experienced within each ecoregion is referred to as within-month SST variations, which is defined as the 5th and 95th quantiles and shown as the dotted envelopes in figure 3. Arctic ecoregions experience a large range of within-month temperatures. In general, this range is greatest in summer months (June–October), with some notable exceptions (for example, High Arctic). Many ecoregions have a wide span of within-month SST variability throughout the year, including North and East Barents Sea, East Greenland Shelf, North and East Iceland, West Greenland Shelf, Eastern Bering Sea, and Northern Grand Banks-Southern Labrador. These ecoregions tend to be along conduits open to the Pacific or Atlantic Ocean basins, such as the Bering Strait and Davis Strait, respectively. This flow between the Arctic Ocean and larger water bodies allows easy mixing and within-month temperature variations of as much as 10 °C. Clustering AnalysisTo compare the SST regimes of the ecoregions, we performed a Euclidean-distance measure hierarchical clustering analysis based on ecoregion SST means, minimums, maximums, ranges, and variances. In each case, the ecoregional SSTs group into two main branches (fig. 4), one of which contained the White Sea and Northern Grand Banks-Southern Labrador ecoregions irrespective of what SST metric was used. The High Arctic and High Arctic Archipelago ecoregions always cluster together for each SST metric, and are always grouped on the alternate branch from the White Sea and Northern Grand Banks-Southern Labrador ecoregions. Similarly, the Beaufort-Amundsen-Viscount Melville-Queen Maud and Beaufort Sea-continental coast and shelf ecoregions are nearly always grouped together by SST clustering metric and are always on the same major branch as the High Arctic and High Arctic Archipelago pair, opposing the Northern Grand Banks-Southern Labrador/White Sea at the first major clustering division. Lancaster Sound, Laptev Sea and Kara Sea are always closely related. Perhaps the most variable of the Arctic ecoregions is North Greenland, which is never found to be equivalent to any other ecoregion clustered by any of the SST metrics explored here. The Eastern Bering Sea ecoregion also shows a great deal of variation amongst the clustering metrics, but is not always uniquely discernible from all other ecoregions as is North Greenland. As seen in figure 4, which shows the Arctic ecoregions clustered based on all SST metrics simultaneously, five statistically significant cluster groups can be discerned. The red boxes denote clusters where p > 0.95. The minimum, maximum, and mean SST Arctic ecoregion clusters correspond generally, but not perfectly, to latitudinal similarities between ecoregions. An exception is the Hudson Complex ecoregion, which despite its comparatively low-latitude experiences low SSTs and little within-month variation during winter, and relatively high SSTs with a vast within-month SST range in summer. The behavioral enigma of this ecoregion may be due to fresh water influence in the system, which controls the circulation by causing convective mixing in the winter, and rapid sea-ice breakup, melt, and water column stratification in summer (Galbraith and Larouche, 2011).
|
|

![]() U.S. Department of the Interior |
U.S. Geological Survey
U.S. Department of the Interior |
U.S. Geological Survey
URL: http://pubsdata.usgs.gov/pubs/of/2011/1246/analysis.html
Page Contact Information: GS Pubs Web Contact
Page Last Modified: Thursday, 08-Dec-2016 00:16:49 EST