U.S. Geological Survey Open-File Report 2012-1234
Application of a Hydrodynamic and Sediment Transport Model for Guidance of Response Efforts Related to the Deepwater Horizon Oil Spill in the Northern Gulf of Mexico Along the Coast of Alabama and Florida
Title Page | Contents | List of Figures | List of Tables | Conversion Factors | Abbreviations | Executive Summary | Introduction | Methods | Results | Digital Data Files | Discussion | Summary and Conclusions | References Cited | Appendix 1. Scenarios | Appendix 2. Example Model Input Files | Appendix 3. Calculations of Mobility and Potential Flux | Appendix 4. File Naming Conventions | Appendix 5. Time Step of Maximum Ebb and Flood for Inlets in the Model Domain
 |
||
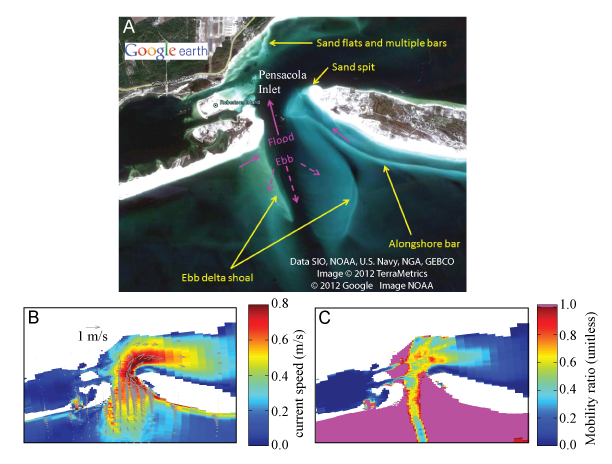
| Figure 30. A, Morphologic features (yellow arrows) at the Pensacola Inlet, Fla., that interact with the tidal flow (pink arrowssolid arrows indicate flood tide flows and dashed arrows indicate ebb tide flows). B, Modeled inlet flow speeds and C, 2.5-centimeter surface residual ball (SRB) mobility for low threshold calculations during flood tide with moderately large waves (scenario H4_D7; fig. 2). Areas where the mobility ratio is 1 (in pink) indicate that SRB mobility threshold is exceeded. | ||


