
Sutphin, D.M., Drew, L.J., Fowler, B.K., 1999, Estimated gravel resources of the Soucook River valley, Loudon, New Hampshire, 7.5' Quadrangle using improved techniques for assessing gravel resources in glaciofluvial deposits [abstr.]: Geological Society of America, Program with Abstracts, Northeastern Section 34 th annual meeting, v. 31, no. 2, p. 71
Contents: Estimates of Sand-and-Gravel Resources in Esker Deposits | Estimates of Sand-and-Gravel Resources in Nonesker Deposits | Examples of Input and Output Data in the Geographic Information System (GIS) Geology
|
|
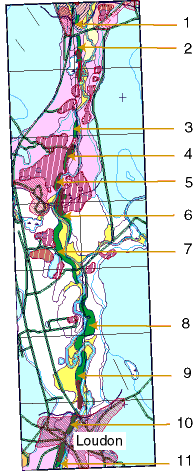
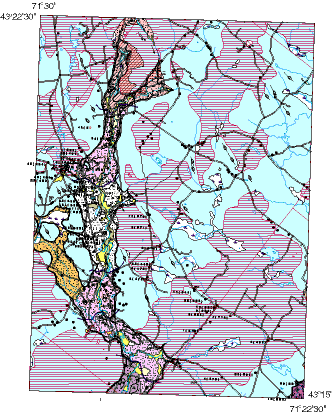
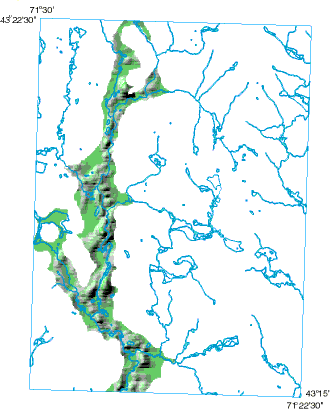
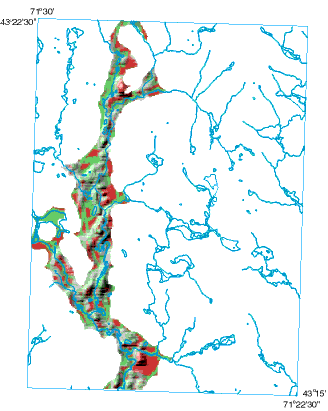
| Study area - Part of the 1:24,000 geologic map of the Loudon quadrangle (Goldsmith, written commun.) showing esker deposits (dark green), aligned like beads on a string, in the Soucook River Valley. Number denotes the esker number in the table below. | |
 |
|
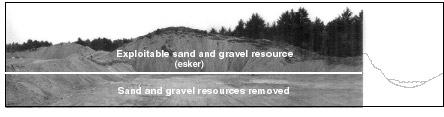
| Photograph of the north face of an esker being consumed for sand and gravel resources in the Loudon, NH, quadrangle. About 1,000 ft of the esker have been removed. Resources below the horizontal surface at the foot of the esker have been sterilized because they are encroaching the water table. |
| Estimated in-place and sterilized sand and gravel resources in esker deposits in the Soucook River Valley part of the Loudon quadrangle. (Sand and gravel in eskers 4 and 5 have been removed by previous mining.) | |||||||
|---|---|---|---|---|---|---|---|
| Esker No. | In-place resources (m3) | Sterile resources (m3) | Exploitable resources (m3) | Sand (yd3) | Gravel (yd3) | Sand (st) | Gravel (st) |
| 1 | 17,300 | 5,240 | 12,100 | 11,100 | 4,750 | 13,300 | 7,120 |
| 2 | 151,500 | 71,100 | 80,400 | 73,600 | 31,500 | 88,300 | 47,300 |
| 3 | 122,000 | 879 | 121,000 | 111,000 | 47,600 | 133,000 | 71,400 |
| 4 | 0 | 0 | 0 | 0 | 0 | 0 | 0 |
| 5 | 0 | 0 | 0 | 0 | 0 | 0 | 0 |
| 6 | 91,800 | 8,420 | 83,300 | 76,300 | 32,700 | 91,600 | 49,100 |
| 7 | 487,000 | 0 | 487,000 | 446,000 | 191,000 | 535,000 | 287,000 |
| 8 | 625,000 | 54,300 | 570,000 | 522,000 | 224,000 | 627,000 | 336,000 |
| 9 | 288,000 | 85,000 | 203,000 | 186,000 | 79,700 | 223,000 | 119,000 |
| 10 | 77,000 | 72,600 | 4,350 | 4,000 | 1,710 | 4,780 | 2,560 |
| 11 | 285,000 | 248,000 | 36,600 | 33,500 | 14,400 | 40,300 | 21,600 |
| Total | 2,140,000 | 546,000 | 1,600,000 | 1,460,000 | 627,000 | 1,760,000 | 941,000 |
| Conversion factors (m, meter; ft, foot; yd, yard; st, short ton): 1 m3 = 35.3147 ft3 = 1.30795 yd3 1 yd3 gravel = 1.5 st gravel 1 yd3 sand = 1.2 st sand |
|||||||
|
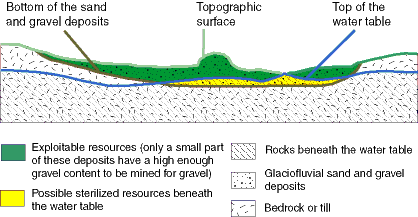
Cross section showing the relation among the topographic surface, the water table surface, and surface of the bottom of the sand and gravel deposits. |
The approach taken to estimate the sand and gravel resources in nonesker deposits consisted of several steps, each of which used GIS. The geologic map was used to define the area expected to contain glaciofluvial gravel resources, which was mostly the footprint of glacial Lake Hooksett. Much of the quadrangle was omitted because the glacio-fluvial system was confined to the valley floor. Areas outside of the valley floor are unlikely to contain sand and gravel deposits, because the rock type is glacial till.
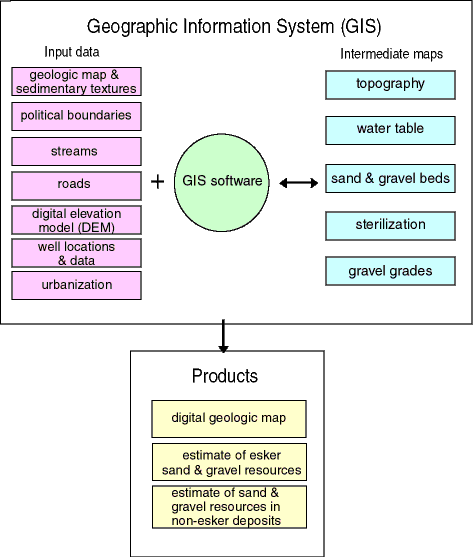 |
Schematic showing how the various parts of the GIS were used to estimate the sand and gravel resources in the Soucook River Valley part of the Loudon quadrangle. |
Digital lattices were created that represent the following stratigraphic surfaces in the study area: topography, water table, bottom of the sand and gravel deposits, percent gravel, and sterilization. The elevation of the bottom of the sand and gravel deposits was subtracted from the topography to give the thickness of the deposits. Where the water table was above the bottom of the deposits, the elevation was subtracted to give the thickness of the deposits above the water table. The thickness of the deposits was multipied by the percent gravel to yield the amount of gravel in the deposits above the water table. Finally, the sterilization map was used as a mask to keep sterilzed deposits from being counted as resources.
| Estimated sand and gravel resources in glaciofluvial deposits in the Soucook River Valley part of the Loudon quadrangle | |||||||
|---|---|---|---|---|---|---|---|
| Category | Total Resources | Sand | Gravel | Sand | Gravel | ||
| Cubic meters | Cubic yards | (yd3) | (yd3) | (st) | (st) | ||
| Part 1 totals: Nonsterile sand and gravel in eskers |
1,600,000 | 2,090,000 | 1,460,000 | 627,000 | 1,760,000 | 941,000 | |
| Part 2 totals: Nonsterile gravel above water table |
8,950,000 | 11,700,000 | 0 | 11,700,000 | 0 | 17,600,000 | |
| Nonsterile sand above water table |
37,200,000 | 48,600,000 | 48,600,000 | 0 | 58,400,000 | 0 | |
| Parts 1 and 2 totals: | 47,700,000 | 62,400,000 | 50,100,000 | 12,300,000 | 60,100,000 | 18,500,000 | |
| Total nonsterile sand and gravel above the water table |
46,100,000 | 60,300,000 | 48,600,000 | 11,700,000 | 58,400,000 | 17,600,000 | |
| Total sand and gravel above the water table including all the eskers regardless of sterilization |
64,500,000 | 84,400,000 | 67,800,000 | 16,700,000 | 81,300,000 | 24,900,000 | |
| Conversion factors (m, meter; ft, foot; yd, yard; st, short ton): 1 m3 = 35.3147 ft3 = 1.30795 yd3 1 yd3 gravel = 1.5 st gravel 1 yd3 sand = 1.2 st sand |
|||||||
 |
 |
| Geologic Map - The geologic map (Goldsmith, written commun.) was used to define where (and where not) glaciofluvial deposits occur in the Loudon quadrangle.
Click here to download a Post Script copy of the map (2.7 Mb)
|
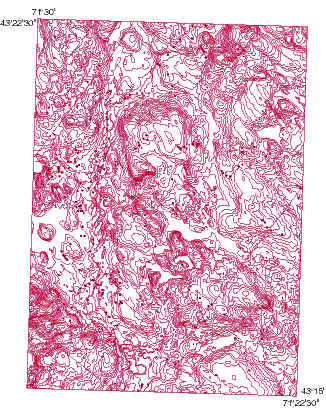
Topography - A digital elevation model (DEM) of the Loudon quadrangle was downloaded from the USGS internet site and used to represent the land surface. The 20-ft contours are from the topographic map.
Click here to download a Post Script copy of the map (1.6 Mb) |
 |
 |
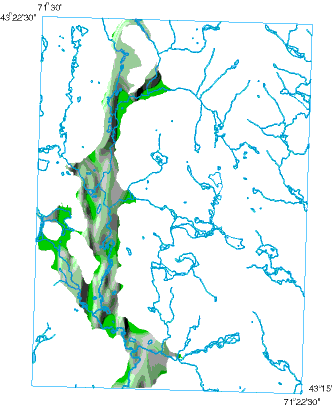
| Sand and Gravel Thickness - Shaded relief map showing the estimated thickness of sand and gravel deposits in the Soucook River Valley part of the Loudon quadrangle. Deposits range from 2 to more than 72 ft thick.
Click here to download a Post Script copy of the map (2.2 Mb)
|
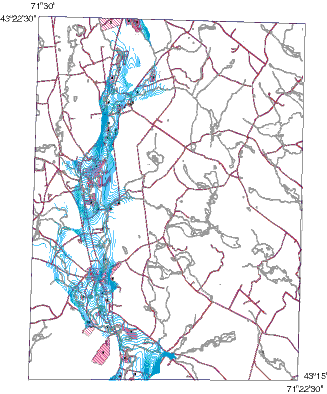
Surface of the Water Table (10-ft contours) - Map showing the surface of the water table at 10-ft contours (blue) in the Soucook River Valley part of the Loudon quadrangle. The surface was developed from well data and stream elevations.
Click here to download a Post Script copy of the map (1.1 Mb) |
 |
 |
| Percent Gravel Surface - Shaded relief map showing gravel percentages for areas in the Soucook River Valley. Percentages range to as much as 40 percent and were estimated from water-well data. The relief map is overlain with streams and stream buffers.
Click here to download a Post Script copy of the map (6.5 Mb)
|
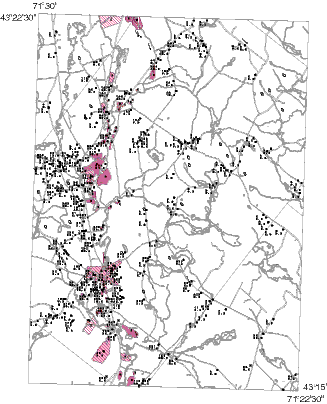
Locations of Water Wells - Map showing locations of water wells in the Loudon quadrangle. Data from water wells was used to determine the thickness and approximate percentage of sand and gravel in glaciofluvial deposits that they penetrated. Sterilized areas are in red.
Click here to download a Post Script copy of the map (2.0 Mb) |
 |
 |
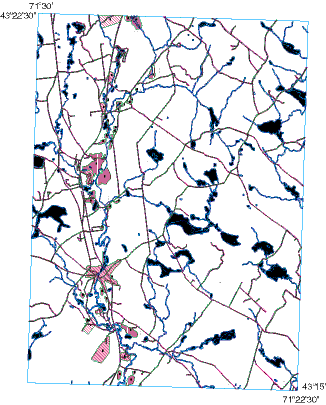
| Sterilized Areas - Map showing roads, streams, and their buffer zones, and urbanized areas. These areas were excluded from the resource estimates because of the small likelihood that the sand and gravel resources in them would be mined.
Click here to download a Post Script copy of the map (1.0 Mb) |
Non-Sterilized Areas Having Sand and Gravel Resources - Shaded relief map of the Soucook River Valley part of the Loudon quadrangle showing the thickness of the sand and gravel deposits. Nonsterilized areas are in red.
Click here to download a Post Script copy of the map (2.2 Mb) |
This page is URL: https://pubs.usgs.gov/posters/NH_gravel/
Maintained by Eastern Publications Group Webteam
Last modified 09.20.00 (jmw)