Professional Paper 1386–A
Gallery contains 4 columns, so you may need to scroll to the right to see all images.
pp1386a1-fig01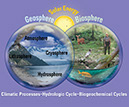 |
pp1386a1-fig02 |
pp1386a1-fig03 |
pp1386a1-fig04![Figure 4.—Graph of the “Keeling Curve,” the instrumental record of the measurement of the concentration of carbon dioxide (CO2) in the Earth’s atmosphere at the Mauna Loa Observatory, Hawaii from 1958 (313 ppm) to 2009 (390 ppm). From figure at National Oceanic and Atmospheric Administration (NOAA) Web site: [http://www.esh.noaa.gov/gmd/ccgg/trends/co2_data_mlo.html].](images/gallery-1/thumb/pp1386a1-fig04.jpg) |
pp1386a1-fig05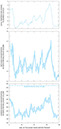 |
pp1386a1-fig06 |
pp1386a1-fig07![Figure 7.—Conceptual diagram of the hydrologic cycle modified from U.S. Geological Survey Web site: [http://ga.water.usgs.
gov/edu/watercycle.html].](images/gallery-1/thumb/pp1386a1-fig07.jpg) |
pp1386a1-fig08![Figure 8.—Graph showing fluctuation in glacier ice volume on the Earth’s land areas during the last 600,000 years [through six glacials (lower sea levels) and interglacials (higher sea levels)]. Maximum volume of glacier ice on land drops sea level approximately -125 m below today’s sea level; minimum volume of glacier ice on land, with maximum carbon dioxide concentrations in the Earth’s atmosphere of about 280 ppm, raises sea level approximately 6 to 7 m. Modified from figure in Houghton (1997, p. 55)](images/gallery-1/thumb/pp1386a1-fig08.jpg) |
pp1386a1-fig09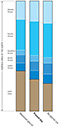 |
pp1386a1-fig10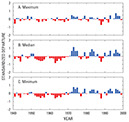 |
pp1386a1-fig11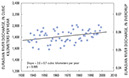 |
pp1386a1-fig12![Figure 12.—Trend (1950 to 2000) in the difference between annual precipitation and annual stream discharge for selected major river basins in the United States: Mississippi, Columbia, Colorado, Susquehanna, Sacramento, and Southeast Basins. Data were area-weighted averaged. Figure modified from Walter and others (2004); reproduced with permission. [mm, millimeters; mm a-1, millimeters per year’]](images/gallery-1/thumb/pp1386a1-fig12.jpg) |
pp1386a1-fig13![Figure 13.—Trend in seasonal [A, summer; B, winter] and [C] cumulative mass balances for about 300 mountain and subpolar glaciers, not including the Greenland and Antarctica ice sheets. Figure based on Dyurgerov (2003).](images/gallery-1/thumb/pp1386a1-fig13.jpg) |
pp1386a1-fig14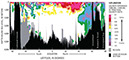 |
pp1386a1-fig15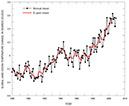 |
pp1386a1-fig16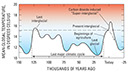 |

![]() U.S. Department of the Interior |
U.S. Geological Survey
U.S. Department of the Interior |
U.S. Geological Survey
URL: http://pubsdata.usgs.gov/pubs/pp/p1386a/gallery-1.html
Page Contact Information: GS Pubs Web Contact
Page Last Modified: Thursday, 01-Dec-2016 16:24:42 EST
