Professional Paper 1386–A
Select image for high resolution and Save to download 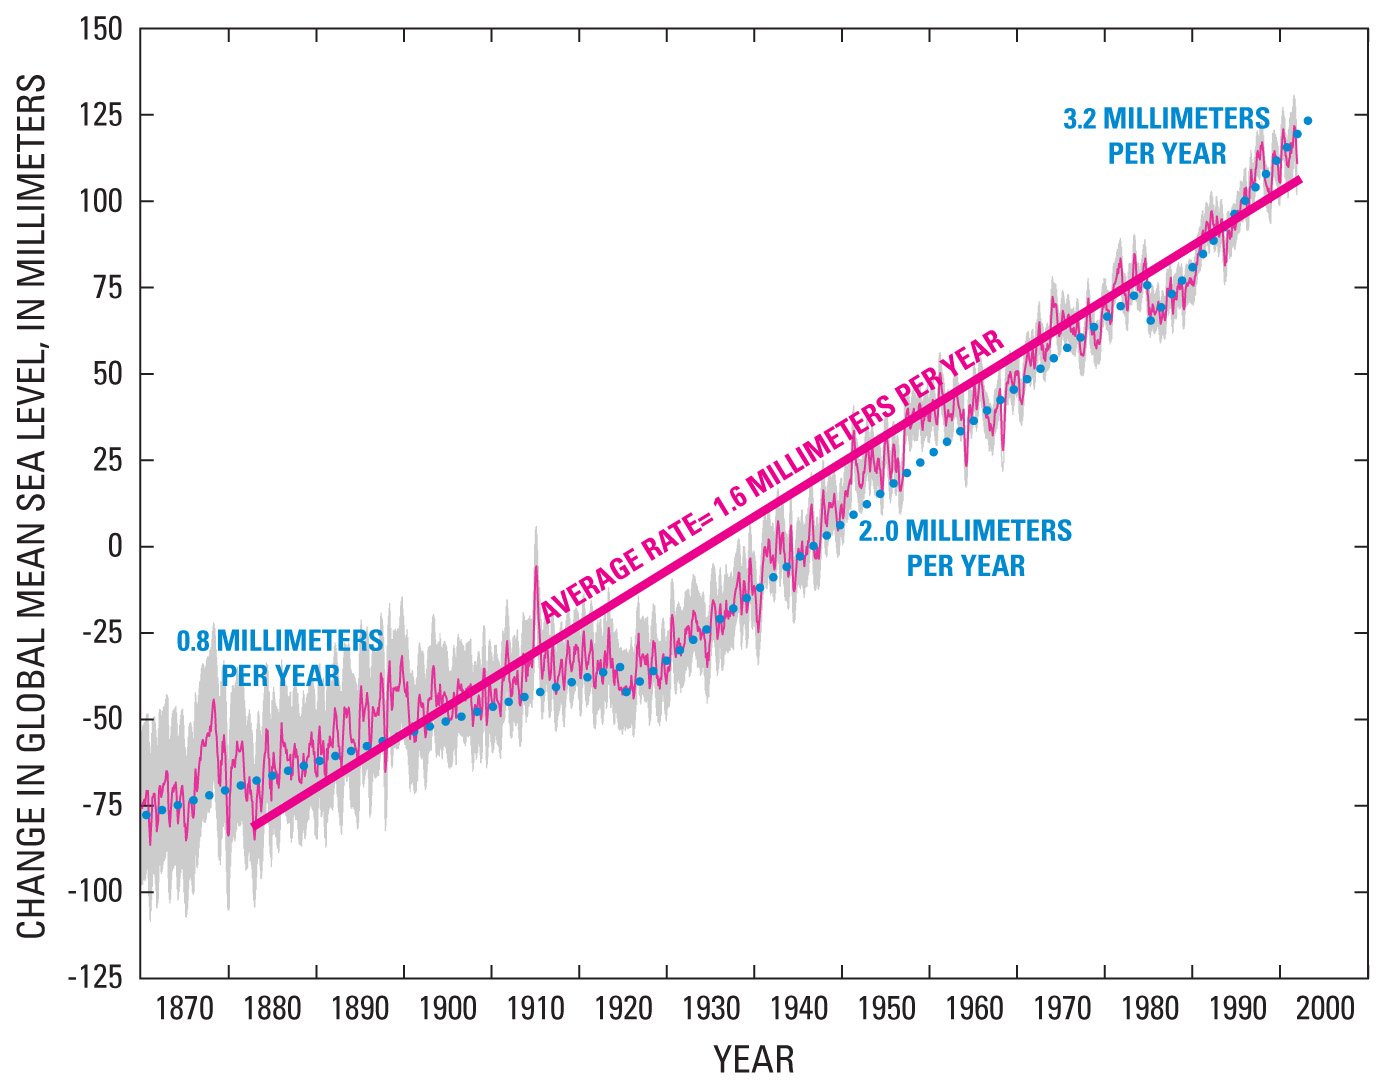 Figure 46. Tide-gauge observations from about 1870 to 2005. Note change in rate of rise in sea level, the result of steric increase in volume of a warmer ocean and from runoff of glacial meltwater. Modified from Church and White (2006). |

![]() U.S. Department of the Interior |
U.S. Geological Survey
U.S. Department of the Interior |
U.S. Geological Survey
URL: http://pubsdata.usgs.gov/pubs/pp/p1386a/gallery2-fig46.html
Page Contact Information: GS Pubs Web Contact
Page Last Modified: Thursday, 01-Dec-2016 16:25:15 EST
