![]()
![]()
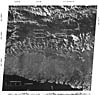
The Landsat scene (1643-00253, band 7; 27 April 1974; Path 110, Row 63), which includes the Puncak Jaya glaciers, is shown at 1:1,000,000 scale in figure 8. The major ice fields appear just above the center of the scene, with the small ice field on Ngga Pilimsit about 12 km west of these. The glaciers are discernible on all MSS bands but are most clearly delineated on the near-infrared MSS bands 6 and 7. On MSS bands 4 and 5 it is difficult to distinguish the ice from unvegetated limestone, which also has a high reflectivity. This is particularly noticeable around Ngga Pilimsit, even on MSS band 7 (fig. 8). The Ngga Pilimsit ice body consists of a small ice cap, several hundred meters in diameter, on the summit, plus a similar-sized glacier on a ledge below and to the southwest of the summit (fig. 9). Only the lower ice field can be distinguished from the surroundings on MSS band 7 (fig. 8), although there is a slight variation in the gray scale between the summit ice and the surroundings on MSS band 6 (fig. 10).
 |
Figure
8.-Landsat 1 image (1643-00253, band 7; 27 April 1974) showing the ice
fields of the Puncak Jaya region (near center). |
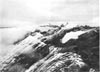 |
Figure
9.-Oblique aerial photograph looking east at the Ngga Pilimsit ice cap
in 1972. In 1942 the summit ice dome and the lower glacier were joined.
Photograph acquired during the Carstensz Glaciers Expeditions (CGE). |
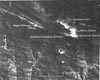 |
Figure 10.-An approximately 1:275,000-scale enlargement of part of a Landsat 1 image (1643-00253, band 6; 27 April 1974) showing the Puncak Jaya glaciers (right) and Ngga Pilimsit (left). |
A Landsat MSS false-color composite (bands 4, 5, and 7) of this scene has been
examined, but, in general, it shows less than separate examination of the individual
bands. The MSS band 7 image best displays the area surrounding the ice fields.
The glaciers are at an elevation of more than 4,300 m astride the crestal ridges
of this part of the central range of New Guinea. To the south the elevation
decreases abruptly within a distance of 40 km to the lowland swamps, which extend
to the Arafura Sea 50 km farther south. The southern face of the range is carved
by gullies of the predominantly north-south drainage system. To the north the
land surface falls more gradually, and high grassy plateaus, more than 3,000
m in elevation, extend east-west immediately north of the divide.
Large morainal ridges can be seen immediately north of the ice fields of the Puncak Jaya region shown in figure 8, extending up to 5 km onto the Kemabu Plateau. These remnants of the youngest Pleistocene glaciation (Wisconsinan, or Würm) can be mapped directly from the Landsat image and show a distribution very similar to that given on the CGE 1:250,000-scale map sheet cited previously. Minor differences between the two maps are largely due to discrepancies in the base map for the CGE sheet. Similarly, a plot from the Landsat image of the prominent lakes on the plateau, and the river courses, shows minor discrepancies in the 1:1,000,000-scale Royal Australian Air Force (RAAF) Operational Navigation Chart of the region (ONC M-13, edition 4, 1973).
The present-day ice-covered areas are shown in more detail in figure 10. MSS band 6 provides the clearest delineation of the ice, although we have also made extensive use of the MSS band 7 image. Even the Southwall Hanging Glaciers, less than 100 m in the north-south dimension, are clearly shown on the image.
In our analysis we have used only standard Landsat photographic
products, and not digital data or photographic images with enhanced gray scales.
A map of the 1974 ice extent (fig. 11)
has been produced by using both simple optical enlargement of the image and
density contours produced from the image by using a scanning microdensitometer.
Similar techniques were used by Krimmel and Meier (1975) for the study of South
Cascade Glacier, Washington' State, U.S.A.
 |
Figure
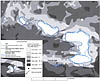
ll.-Satellite-derived boundary of the Puncak Jaya glaciers in 1974 compared
with the 1972 CGE boundary. Inset shows the 1974 boundary of the Ngga Pilimsit
ice cap, 12 km west-northwest of Puncak Jaya. (See text section "Observation
and Mapping of the Glaciers Shown on Landsat Images" for a discussion of
the method used to produce the figure.) |
Ice and snow boundaries were first traced from a 1:1,000,000-scale positive transparency optically enlarged to a scale of 1:20,000. All four MSS bands were used to derive a resultant "composite minimum brightness" map: that is, only those areas that appeared light on all four bands were plotted as glacierized on the final map. As noted previously, MSS bands 6 and 7 gave a minimum ice area. Although this technique is highly subjective, and the observer did use knowledge of the local terrain to interpret the images, it did reveal several interesting features when compared with the 1972 ice boundary shown in figure 2.
Along the northern edge of the eastern section of the Northwall
Firn, the ice boundary is conterminous with the tops of high cliffs, and massbalance
changes do not lead to changes in the shape of the ice margin. Here the satellite-derived
ice margin is very similar in shape and position to the margin as plotted photogrammetrically
from the 1942 air photographs. The excellent agreement at these points is an
indication of the accuracy and resolution obtainable from the Landsat image.
The far western end of the Northwall Firn, however, does not correlate well
on the two plots, although the positions are similar. This is thought to be
due to errors in the CGE map, because this ice margin was determined only from
oblique aerial photographs. Similarly, there are discrepancies along the eastern
ice border, also limited by precipitous cliffs, and the least accurate region
of the CGE map.
On both MSS bands 6 and 7, the ablation zone appears considerably darker on the Meren Glacier than on the other ice fields. The Meren snout supports a heavy population of cryoalgae (Kol and Peterson, 1976) and is riddled with englacial lakes (Peterson, 1976). These features lower the surface reflectivity, and an apparent snowline is evident on the Meren at elevations of between 4,550 and 4,650 m. This compares with the equilibrium-line elevation determined in 1972 as 4,580 m. There is some indication of a snowline, although not as obvious, in other areas where the cryoalgae are not as concentrated.
There is also some evidence of continued glacier retreat, from the satellite observations. The terminus of the Meren Glacier appears to have retreated about 200 m, and the large central part of the Northwall Firn appears to have separated further into two independent firn fields, or at least into two sections joined by a thin band of snow-free ice. The retreat of the Meren Glacier is confirmed by a single ground observation made in December 1974, 8 months after the satellite image was obtained, which showed a retreat of 185 m since 1972 (R. Mitton, pers. commun.) but a slightly different terminus shape than that derived from the Landsat image (fig. 8).
The 1981 vertical aerial photography obtained during the combined Indonesian and Australian mapping, although taken after a fresh snowfall, also suggests that the central Northwall Firn had separated into two parts after 1972, and this separation is clearly seen in a recent, but undated, oblique aerial photograph (Dick and Fenwick, 1984).
As a more objective check on the ice edge, an MSS band 7, 1:1,000,000-scale positive transparency was scanned with a microdensitometer to produce the gray-scale contours shown in figure 11. The microdensitometer aperture was set to scan an area equivalent to 80 m by about 200 m on the ground (or about 1 by 2.5 times the size of Landsat picture elements (pixels)), and scans were made every 0.2 mm on the image (200 m on the ground) along the direction of the glacial valleys. The density contours plotted in figure 11 have been condensed from the 15 Landsat photographic gray-scale levels (1 = white, 15 = black).
The snow-covered
areas are clearly delineated by Landsat gray-scale levels of 5 and less, but
the interpretation of areas showing a level of 6 to 9 is more ambiguous. The
image was made with a solar elevation angle of 50° and an azimuth of 62°.
Steep, unvegetated limestone slopes facing the Sun, for example the eastern
and northern walls and the north face of the Puncak Jaya massif, show a gray-scale
level of 6 to 8. These slopes may also have a scattered snow cover (compare
fig. 4). Elsewhere, for example on the ablation zone of the Meren Glacier
and possibly in other areas near southern or western ice edges, gray-scale levels
of 6 to 9 indicate bare ice. The unvegetated limestone, not directly sunlit,
shows a level of 9 to 11, and lakes, or heavily shaded areas, a level of 11
to 12. Because the Southwall Hanging Glaciers are less than 100 m wide, they
do not show in the contours made from a scanning interval of 200 m, but they
can be seen on the optically enlarged image.
The December 1974 ice boundary shown in
figure 11 has been plotted from a
combination of the density contours and the optical enlargement and is compared
with the 1972 CGE ice boundary. The inset map of the Ngga Pilimsit ice cap,
the first produced for that area, has been derived from the density contours
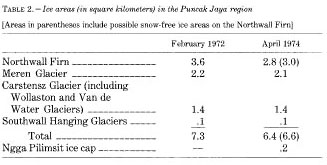
of the MSS band 6 image. Table 2 shows the 1974 ice areas compared with 1972
areas, after the latter have been corrected for map errors revealed by the satellite
data. Continued retreat of the ice fields between 1972 and 1974 is apparent.
Location and observation of the small Mandala ice field on Landsat imagery is not as simple as for the much larger Puncak Jaya glaciers or for the Ngga Pilimsit ice cap, which can be located relative to the Puncak Jaya glaciers. We have been able to use first-hand knowledge of the terrain features in the Puncak Jaya area when interpreting the Landsat images; we do not have such knowledge of Puncak Mandala.
Neither maps, such as the 1:1,000,000-scale U.S. Defense Mapping Agency Operational Navigation Chart, ONC M-13, nor the latitude and longitude gridding on the primary Landsat image products is accurate enough to locate Puncak Mandala by absolute geographical position. We can, however, locate the region relative to the extensive drainage net of the Sungai Pulau (Einlanden River), which shows similar features on the images and map (although separated by about 11 km in absolute position near Puncak Mandala). This drainage net, on the southern slopes of the New Guinea cordillera, shows up most clearly in images obtained during February, March, and April, when the rivers are swollen following the southwest monsoons.
Identification of the ice field is further complicated by light-colored limestone (especially where recently deglaciated), short-lived snowfalls, and even the smallest convective or orographic clouds, which are common and are often as large as or larger than the ice cap. The Puncak Mandala ice cap can, however, be identified on Landsat images of 19 August 1981, 21 March 1983, and 3 January 1984 (although there is also new snow in the last scene) (table 1). While the imagery confirms the continued existence of this very small ice cap, we do not believe that the imagery can be used either to map or to record changes in the ice field without ground-observation data for the region.
Changes
in the Puncak Jaya Glaciers, 1974 to 1983
The recent images obtained by the Australian Landsat Station (table
1) allow continued monitoring of fluctuations of the Puncak Jaya glaciers.
Examination of the images for 8 September 1982 and 19 March 1983 shows no significant
change in extent of the ice fields since 1974, meaning that no change in ice
edge of greater than 100 m has occurred. Separation of the Northwall Firn into
four independent firn fields is confirmed by these images, but even the smallest,
western portion of the Northwall Firn and the Southwall Hanging Glaciers are
largely unchanged since 1974. The low albedo of the ablation zone of the Meren
Glacier makes it difficult to distinguish the ice from recently deglaciated
limestone in front of the glacier.
While not in immediate danger of disappearing altogether, it would appear that the Meren and Carstensz; Glaciers, the only true valley glaciers in New Guinea, are becoming relatively simple firn fields or ice caps and are becoming less sensitive to climatic variations.
Landsat MSS images offer the possibility of monitoring glaciers as small as those on the Puncak Jaya massif and of identifying the even smaller ice masses of Ngga Pilimsit and Puncak Mandala.
The Landsat imagery can be used to monitor glacier retreat (or advance), to correct errors in existing maps, and possibly to give a gross indication of the mass balance from the snowline elevation, which, in this region, varies little seasonally. We must stress, however, that proper interpretation of the images requires knowledge of the terrain from ground studies. Although obviously lacking the resolution of aerial photographs, the Landsat images offer greater frequency of coverage, consistency of data, and, for these equatorial regions, uniformity of illumination (Sun angle). Provided proper and adequate ground truth is available, even more detailed information could be obtained from analysis of the Landsat digital data or by the use of the higher resolution Landsat thematic mapper data.
The authors
acknowledge the consistently helpful and patient support of staff of the Australian
Landsat Station in directing us to the most suitable imagery, and both H.M.S.
Hartono, Director, Indonesian Geological Research and Development Centre, and
David Trail, Bureau of Mineral Resources, Australia, Irian Jaya Geological Mapping
Project, for making available the 1976 and 1980 aerial photographs.
| Home | Volume Contents | Irian Jaya References | Glaciers of New Zealand |
U.S. Geological Survey, U.S.Department
of the Interior
This page is https://pubs.usgs.gov/prof/p1386h/indonesia/indonesia2.html
Contact: Richard S. Williams, Jr.,
and Jane G. Ferrigno
Last modified 05.03.00