|
|
|
||||
| Professional Paper 1643 |
| About USGS / Science Topics / Maps, Products & Publications / Education / FAQ |
[available in hard copy; order with the USGS Store]
|
Contents
|
ABSTRACT [back to top]
Information from marine high-resolution and conventional seismic-reflection surveys, aeromagnetic mapping, coastal exposures of Pleistocene strata, and lithologic logs of water wells is used to assess the active tectonics of the northern Puget Lowland and eastern Strait of Juan de Fuca region of the Pacific Northwest. These data indicate that the Devils Mountain fault and the newly recognized Strawberry Point and Utsalady Point faults are active structures and represent potential earthquake sources.
The north-dipping (45°-75°) Devils Mountain fault extends westward for more than 125 kilometers from the Cascade Range foothills to Vancouver Island. The Devils Mountain fault is bounded by northwest-trending en-echelon folds and faults, a pattern that strongly suggests it is a left-lateral, oblique-slip, transpressional "master fault." Aeromagnetic anomalies coincide with both the trace of the Devils Mountain fault and en-echelon structures. Quaternary strata are deformed on nearly all crossing seismic-reflection profiles, and onshore subsurface data indicate offset of upper Pleistocene strata.
The west-northwest-trending, subvertical Strawberry Point fault cuts across northern Whidbey Island and has a minimum length of about 25 kilometers. On the west coast of Whidbey Island and in the Strait of Juan de Fuca, the fault has south-side-up offset and forms the northern boundary of an uplift of pre-Tertiary basement rock. Exposures and subsurface logs of upper Pleistocene strata from Strawberry Point on the east coast of Whidbey Island indicate that the fault bifurcates into a 2-kilometer-wide zone as it crosses Whidbey Island. Each of the four fault splays within this zone has apparent north-side-up offset, and upper Pleistocene strata between the faults exhibit considerable shortening (dips as steep as 45°). The vertical fault trace, reversal of offset along strike, and evidence for associated contractional deformation suggest that the Strawberry Point fault is an oblique-slip, transpressional fault.
The northwest-trending, subvertical Utsalady Point fault similarly cuts across northern Whidbey Island and has a minimum length of 25 kilometers. It forms the southern margin of the pre-Tertiary basement horst block on the west coast of Whidbey Island, where it has north-side-up offset. Offshore seismic-reflection data from east of Whidbey Island indicate that it also bifurcates eastward into a broad (1.5 kilometer) zone of several splays. Onshore outcrops and subsurface logs from Camano Island indicate a probable reversal of offset (to south side up) along the zone and display both faulting and folding (dips as steep as 24°) in upper Pleistocene strata. As with the Strawberry Point fault, the vertical fault trace(s), reversal of offset, and evidence for associated contractional deformation suggest the Utsalady Point fault is an oblique-slip, transpressional fault.
Collectively, the Devils Mountain, Strawberry Point, and Utsalady Point faults represent a complex, distributed, transpressional deformation zone. The cumulative slip rate on three main faults of this zone probably exceeds 0.5 millimeter/year and could be much larger. This new information on fault location, length, and slip rate should be incorporated in regional seismic hazard assessments.
INTRODUCTION [back to top]
Seismic hazard assessments depend on understanding the locations, lengths, and slip rates of active faults. Obtaining this information is difficult in the Puget Lowland of Washington State, where most landforms were generated during the last glaciation and are quite young (≈12-20 ka), and vegetation covers much of the landscape. As a result, the earthquake hazard posed by many significant faults in this region is poorly understood. Several potentially significant faults occur in the northern Puget Lowland and eastern Strait of Juan de Fuca region (Gower and others, 1985). These include the southern Whidbey Island fault, the Devils Mountain fault, and associated structures (Gower and others, 1985; Johnson and others, 1996).
Johnson and others (1996) integrated seismic-reflection data, well logs, and information from outcrops to document Quaternary deformation along the southern Whidbey Island fault. Our purpose in this report is to present comparable new geologic and geophysical information and synthesis that demonstrate Quaternary activity on the Devils Mountain fault and two newly defined structures, the Strawberry Point and Utsalady Point faults. These faults are the major components of an oblique-slip transpressional deformation zone that extends westward for more than 125 kilometers from the Cascade Range foothills across the eastern Strait of Juan de Fuca.
ACKNOWLEDGMENTS [back to top]
For the U.S. Geological Survey seismic-reflection surveys, we thank Guy Cochrane, Kevin O’Toole, Larry Kooker, Fred Payne, Curtis Lind, and the captain and crew of the Robert Gray for help in data collection, and John Miller and William Stephenson for help in data processing. For the Geological Survey of Canada seismic-reflection surveys, we thank the captain, crew, and scientific staff of the CCGS John P. Tully on cruises PGC96006 and PGC97007. The U.S. Geological Survey research cruises were supported by the Coastal and Marine Geology Program and the Earthquake Hazards Reduction Program (EHRP). Geological Survey of Canada surveys were funded in part by a U.S. Geological Survey EHRP grant to David C. Mosher. We thank Michael Fisher for organizing the Seismic Hazard Investigations in Puget Sound (SHIPS) marine seismic-reflection survey and providing access to the SHIPS data base. We are grateful to Mobil and ARCO for providing industry seismic-reflection data. Douglas Kelly and Myrtle Jones provided important water-well data and insights, and Jon Cox drafted early versions of several stratigraphic correlation diagrams. David Dethier, Donald Easterbrook, James Yount, Joseph Dragovich, and David Norman provided important insights on the glacial geology of northern Whidbey Island. Constructive reviews were provided by Thomas Brocher, David Dethier, Donald Easterbrook, Joseph Dragovich, Derek Booth, Kathy Troost, John Oldow, and David Harding. We benefited from stimulating discussions with these reviewers and with Robert Bucknam, James Evans, Carol Finn, Art Frankel, Ralph Haugerud, Robert Karlin, Harvey Kelsey, Daniel Muhs, Alan Nelson, Thomas Pratt, Rowland Tabor, Timothy Walsh, Craig Weaver, Ray Wells, and John Whetten.
GEOLOGIC SETTING [back to top]
Western Washington and southwestern British Columbia lie within the structurally complex continental margin of the Pacific Northwest (figure 1). Oblique convergence of the Juan de Fuca plate below North America (Engebretson and others, 1985), along with larger-scale shearing of the Pacific Plate against North America, provides the driving force for crustal faulting and deformation. (See, for example, Wang, 1996, Wells and others, 1998; Stanley and others, 1999.) The Washington Coast Range and Olympic Mountains represent part of a forearc sliver that is moving northward relative to the Cascade Range and is buttressed to the north by pre-Tertiary basement in the San Juan Islands and on Vancouver Island. The boundary between these two terranes is apparently a distributed deformation zone that extends through Washington's Puget Lowland (Johnson and others, 1996). The active Seattle fault (Bucknam and others, 1992; Johnson and others, 1994, 1999; Nelson and others, 1999) and southern Whidbey Island fault (Johnson and others, 1996) occur within this distributed zone. Both the Seattle fault and the southern Whidbey Island fault are associated with significant aeromagnetic and gravity anomalies (for example, Finn and others, 1991; Blakely, Parsons, and others, 1999; Blakely, Wells, and Weaver, 1999), marking the southern boundary of the Seattle basin and the southwest boundary of the Everett basin (figure 1), respectively.
Johnson and others (1996) have described the southern Whidbey Island fault (figure 1) as a broad (6 - 11 km) transpressional zone comprising three main splays, within which the local late Quaternary uplift rate is at least 0.6 mm/yr. This zone represents part of the boundary of the forearc sliver, juxtaposing Eocene marine basaltic basement on the south and southwest with heterogeneous pre-Tertiary basement on the northeast. This crustal boundary is buried in the Puget Lowland but is exposed on southern Vancouver Island as the Leech River fault (figure 1; Muller, 1983; Clowes and others, 1987).
The Devils Mountain fault (Hobbs and Pecora, 1941; Loveseth, 1975; Tabor, 1994) forms the northern boundary of the Tertiary to Quaternary Everett basin (Johnson and others, 1996) and is associated with an alignment of aeromagnetic anomalies that extend more than 100 km from the Cascade Range foothills to Vancouver Island (figs. 2, 3). At its east end, the Devils Mountain fault merges with the north-trending Darrington fault zone (Tabor, 1994). In the Cascade Range foothills, the fault forms a prominent ≈30-km-long topographic lineament aligned with Lake Cavanaugh (figure 4). Farther west, the Devils Mountain fault trace extends through Quaternary deposits of the Skagit River delta and Whidbey Island and into the eastern Strait of Juan de Fuca. Based on interpretation of petroleum-industry seismic-reflection data, Johnson and others (1996) suggested that the fault continues its westerly trend across the strait (figure 1). Previously, Whetten and others (1988) and Tabor (1994) suggested that to the west of Whidbey Island, the trace of the Devils Mountain fault extends northwest into an exposed fault zone that juxtaposes disparate pre-Tertiary rocks in the southern San Juan Islands.
Loveseth (1975) suggested left-lateral slip on the Devils Mountain fault based on its onland linearity, juxtaposition of upper Eocene to lower Oligocene continental and marine strata, and horizontal slickensides (Hobbs and Pecora, 1941) in the fault zone. Whetten (1978) suggested as much as 60 km of left-lateral slip. Tabor (1994) inferred that the Devils Mountain fault was continuous with the north-trending Darrington fault zone to the east (figure 1) and suggested that pre-34 Ma right-lateral slip was probable, based on fault fabric and offset rock units. Evans and Ristow (1994), who also regarded the Devils Mountain and Darrington faults as one continuous structure, argued for left-lateral slip on the basis of orientations of folds in rocks straddling the fault. Johnson and others (1996) noted that on seismic-reflection data from the eastern Strait of Juan de Fuca, the Devils Mountain fault is locally imaged as a north-dipping reverse fault.
Oligocene rocks are clearly deformed along the Devils Mountain fault zone, but an upper age limit for faulting has not yet been determined. Loveseth (1975) and Adair and others (1989) did not report deformation in upper Pleistocene strata along the fault in the Cascade Range foothills, but both noted the youthful appearance of the topographic lineament coinciding with the structure (figure 4). Naugler and others (1996) first reported Quaternary displacement on the Devils Mountain fault on the basis of high-resolution seismic-reflection data from Lake Cavanaugh (figs. 1, 4) that reveal both faulting and folding of inferred upper Pleistocene to Holocene lacustrine sediments. In a regional study of latest Pleistocene glaciomarine deposition, Dethier and others (1995, their figure 7) noted that the Devils Mountain fault coincides with a significant (≈10 m) inflection point on a graph of the maximum altitude of glaciomarine drift.
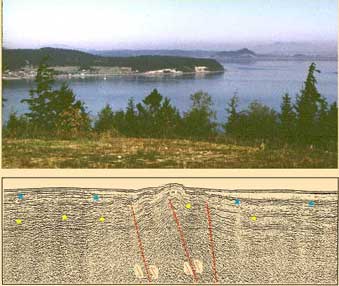
South of the Devils Mountain fault, Gower and others (1985) proposed the presence of another potentially active structure, the northern Whidbey Island fault, based on interpretation of gravity and magnetic anomalies (MacLeod and others, 1977), and on faulting of Quaternary sediments exposed at Strawberry Point on northeastern Whidbey Island (figure 2). Our offshore and onland investigations, including recent high-resolution aeromagnetic surveys (Blakely, Wells, and Weaver, 1999; Blakely and Lowe, 2001), reveal two faults in the vicinity of the inferred northern Whidbey Island fault. Neither of these faults coincides with the trace of the northern Whidbey Island fault as inferred by Gower and others (1985), so we do not use that name in this report and recommend that it be abandoned. Instead, we refer to the two structures as the Strawberry Point fault and the Utsalady Point fault, named for sites (figure 2) where the faults have deformed upper Pleistocene deposits exposed in coastal bluffs.
FAULT MAPPING, STYLE, AND RATES OF DEFORMATION [back to top]
Devils Mountain fault
Offshore seismic-reflection and onshore geologic data indicate that the Devils Mountain fault is continuous from the Cascade Range foothills (Whetten and others, 1988; Tabor and others, 1988; Tabor, 1994) across northern Whidbey Island and into the eastern Strait of Juan de Fuca, a minimum distance of approximately 125 km (figure 1). The Devils Mountain fault was recognized on all but one of 14 crossing high-resolution seismic-reflection profiles and all deeper industry profiles, and it appears to cut and (or) fold inferred Quaternary reflections on virtually every profile (figs. 8-26). The dip of the upper 1-2 km of the fault plane varies from about 45° to 75° (61° ± 10° for crossing seismic profiles) to the north with the steepest dips to the east in profiles flanking Whidbey Island. The pattern of juxtaposed reflections on some profiles also suggests out-of-plane (strike-slip) offsets.
For its entire length, the fault coincides closely with the southern margin of a variable-amplitude aeromagnetic anomaly (figure 3). The variability in amplitude is inferred to correlate mainly with the lithology of basement rocks, being strongest where pre-Tertiary igneous basement occurs and weakest where the basement consists of pre-Tertiary and Tertiary sedimentary rocks (figure 6). The fault also roughly corresponds with a change in the depth to the base of uppermost Pliocene(?) to Pleistocene strata (figure 7).
Seismic-reflection and aeromagnetic data east of Whidbey Island in Skagit Bay (figs. 2, 3, 8) suggest at least one tear fault or transfer zone along the Devils Mountain fault that could represent a segment boundary. A second segment boundary could be present in the eastern Strait of Juan de Fuca south of southeastern San Juan Island. In this area, the westernmost USGS high-resolution seismic-reflection profile (figure 5A, west of figure 20) did not image a fault zone on strike with the Devils Mountain zone to the east and west. Although a nearby industry profile (figure 21) did image a fault along the strike of the Devils Mountain fault, this structure does not appear to deform the Quaternary section and may be an inactive strand. Other possible segment boundaries or gaps may be present along the fault trace but are presently unrecognized.
North of the Devils Mountain fault in the eastern Strait of Juan de Fuca, seismic-reflection data indicate three zones of northwest-trending folds and faults (figure 2). Mapping these structures is limited by the incomplete coverage by seismic-reflection profiles (figure 5); however, their trends correspond closely with aeromagnetic anomalies (figure 3). Figure 2 shows their minimum lengths and extent. The eastern zone occurs at the south end of Rosario Strait and coincides closely with a high-amplitude aeromagnetic anomaly (figure 3) that forms the southern boundary of a Jurassic ophiolite (Whetten and others, 1980). These faults and folds are well imaged on seismic-reflection data collected by Puget Power (1979). The middle zone of northwest-trending faults and folds occurs south of western Lopez Island and correlates with low-amplitude aeromagnetic anomalies that extend northwest parallel to the southwest coast of San Juan Island (figs. 2, 3). The gradients of these magnetic anomalies indicate sources deeper than the section imaged by the seismic data, but it appears that the structure of these deeper sources is controlling the structural pattern of the upper 1 km. The western zone occurs at the mouth of Haro Strait and coincides closely with moderate- to high-amplitude aeromagnetic anomalies (figs. 2, 3). Many of the northwest-trending structures in these three zones cut and (or) fold reflections in inferred Quaternary strata. Thus, these faults and folds appear to be Quaternary en-echelon structures active at the same time as the Devils Mountain fault and not older, inactive features cut by a younger Devils Mountain fault.
The Devils Mountain fault probably continues west of our data base, passing a few kilometers south of the city of Victoria and merging to the west with the Leech River and (or) the San Juan fault on southern Vancouver Island (Muller, 1983). At present, however, neither the Leech River or San Juan fault has been recognized as an active or potentially active fault. An alternative is that much or all of the deformation along the fault is transferred to the presumed en-echelon northwest-trending structural zone that coincides with the prominent aeromagnetic anomaly in Haro Strait (figs. 2, 3) which extends onto Vancouver Island north of Victoria. Geological Survey of Canada seismic-reflection Line 35 (figure 26) is important in distinguishing between these two end-member alternatives. This line crosses the Devils Mountain fault south of the northwest-trending structural zone in Haro Strait and shows significant deformation of the base of the uppermost Pliocene(?) to Pleistocene section on the west-trending fault trace.
The map-view geometry of the Devils Mountain fault and associated structures resembles that described for many left-lateral, oblique-slip fault zones (for example, Christie-Blick and Biddle, 1985), with the Devils Mountain fault acting as the "master fault" within a broadly distributed zone of deformation. This map geometry notably contrasts with the expected structural pattern across a zone of normal contraction, a setting in which secondary faults and folds would have trends similar to that of a master fault. Based on the distinctive map pattern, we believe that the Devils Mountain fault is a transpressional, oblique-slip fault, characterized by both north-south shortening and left-lateral slip.
The vertical component of slip on the Devils Mountain fault can be constrained with onshore subsurface data (figure 30) from Whidbey Island, assuming that stratigraphic interpretation of the top of the Whidbey Formation is correct and that similar amounts of postdepositional modification of this surface have occurred on each side of the fault. Given the interpretation in figure 30, the vertical separation on the top of the Whidbey Formation (80 ka; figure 6) across the fault is about 11.9 ± 8.3 m. This offset requires between about 4 to 24 m of fault offset (12-14 m for the mean), assuming (based on nearby seismic-reflection profiles) the fault dips 60°-75° in this area. The result is a late Pleistocene vertical slip rate of about 0.05-0.30 mm/yr (0.15-0.18 mm/yr for the mean) and a shortening rate of 0.01-0.15 mm/yr (figure 38).
Glaciomarine features provide another possible tool for constraining fault offset. Dethier and others (1995) noted a ≈10 m inflection point (up to the north) coinciding with the Devils Mountain fault on a graph showing elevation of a ≈13 ka glaciomarine surface representing the maximum altitude of the marine limit. These data are consistent with the north-side-up offset on the Devils Mountain fault determined in this investigation. At present, however, data points for such glaciomarine features are too widely spaced to provide valid constraints for the Devils Mountain fault and other local structures. New high-resolution topographic imaging tools such as airborne laser terrane mapping (for example, Kitsap County Public Utility District, 1998; Bucknam and others, 1999: Nelson and others, 1999; Harding and Berghoff, 2000) may provide the best opportunity for the type of detailed investigations needed to use glacial and glaciomarine landforms in studies of active faults in this region.
The vertical component of slip on the Devils Mountain fault can also be estimated using offshore high-resolution seismic-reflection data. The drawback to this approach is that multiple cycles of widespread Quaternary glacial erosion and deposition in the eastern Strait of Juan de Fuca have affected both bedrock and Pleistocene deposits. As a result, the age of the lowest preserved uppermost Pliocene(?) to Pleistocene deposits on any one profile is unknown, and correlation of Quaternary units across the fault zone is either difficult or impossible. The most conservative approach is to use the base of the uppermost Pliocene(?) to Pleistocene section as a datum and to assign this surface a maximum age of 2 Ma (see section, “Identification and age of the base of the uppermost Pliocene(?) to Pleistocene section”). Using this datum on six profiles (figs. 8, 10, 13, 16, 20, 26) yielded minimum Quaternary slip rates varying from 0.03 to 0.13 mm/yr (figure 38). We applied the methods of Schneider and others (1996, their figure 10) to Geological Survey of Canada Line 37 (figure 25), a special case in which a fault-propagation fold is imaged above the locally blind Devils Mountain fault. The vertical and horizontal components of fold growth are 180 m and 135 m, respectively, and inferred uppermost Pliocene(?) to Pleistocene fault displacement is 225 m on a plane dipping 53°. Using 2 Ma as the base of the Quaternary section yields an approximate minimum vertical slip rate of about 0.11 mm/yr.
The longer term minimum slip rates determined from seismic-reflection data are thus consistent with the shorter term, approximate, late Pleistocene vertical-slip rate (0.05-0.31 mm/year) estimated from onshore subsurface data (figure 38). We emphasize that this rate reflects only the vertical component of slip on a structure we infer to be an oblique-slip fault.
Strawberry Point fault
Seismic-reflection data and local onshore geology suggest that the west-trending Strawberry Point fault is continuous from the eastern Strait of Juan de Fuca to at least Skagit Bay, a minimum distance of 22 km (figs. 2, 27). It occurs as one discrete subvertical structure with its south side up along western Whidbey Island and in the easternmost Strait of Juan de Fuca (figs. 10, 13), where it forms the northern boundary of a relatively nonmagnetic basement block (figure 3). The pre-Tertiary sedimentary rocks that form the core of this block are exposed at Rocky Point on the west coast of Whidbey Island (figure 2). We infer about 80-200 m of vertical relief on the base of the uppermost Pliocene(?) to Pleistocene section along the Strawberry Point fault on two seismic-reflection profiles (figs. 10, 13) west of Whidbey Island. Assuming a maximum age of 2 Ma for this contact (see section, “Identification and age of the base of the uppermost Pliocene(?) to Pleistocene section”), this relationship yields a minimum vertical slip rate for the Quaternary of 0.04-0.10 mm/yr (figure 36). The occurrence of late Holocene (≈1.7 ka) bulrush rhizomes at sea level on the south side of the fault at Rocky Point (figure 27; table 2) provides a horizontal datum that rules out south-side-up vertical offset of more than a few meters on the Strawberry Point fault in the last 1,750 years.
Onshore and offshore Strawberry Point on eastern Whidbey Island, deformation is distributed on several subvertical splays and gentle to moderate folds in a ~2-km-wide zone. Inferred stratigraphic offsets (figure 32 ) suggest that the four main subvertical splays have north-side-up displacement, opposite to the sense of vertical fault slip on the Strawberry Point fault west of Whidbey Island. Using the top of the Whidbey Formation as a datum, the fold south of fault 1 (figure 27) has a late Pleistocene uplift rate of about 0.38 mm/year (figure 37). The shortening rate required to produce this uplift is about 0.09 mm/yr (method of Rockwell and others, 1988). The cumulative minimum latest Quaternary (80 ka to present) vertical slip rate for faults 1 and 2 is inferred to be about 0.25 mm/yr given the favored, more conservative stratigraphic correlation. The folded strata between faults 2 and 3 require an uplift rate of 0.88 mm/yr and a shortening rate of 0.19 mm/yr.
The amount of vertical slip on faults 3 and 4 is not well constrained. Outcrops of upper Pleistocene strata locally dip 24° to 48° (figure 27), making projections of stratigraphic surfaces tenuous. Making the speculative assumption that dips and stratigraphic contacts are continuous yields vertical slip rates as high as 1.0-1.5 mm/yr on fault 3 and about 0.1 mm/yr on fault 4. Shortening rates recorded by folded strata between faults 3 and 4 are likewise difficult to estimate because of poor outcrops; our poorly constrained best estimate is ≈0.08 mm/yr.
The cumulative vertical slip rate on the four splays of the Strawberry Point fault at Strawberry Point is thus inferred to be a minimum of about 0.25 mm/yr, but larger rates are probable. The cumulative shortening rate recorded by folded strata within and adjacent to the fault zone is a minimum of about 0.35 mm/yr.
Folding in outcrops within and adjacent to the Strawberry Point fault zone at Strawberry Point indicate contractional deformation that, together with the reversal of the sense of vertical offset in the zone across Whidbey Island, strongly suggests the Strawberry Point fault is an oblique-slip transpressional fault (Christie-Blick and Biddle, 1985). Regional fault geometry (see Fault Mapping, Style and Rates of Deformation, Devils Mountain fault) suggests left-lateral displacement, but we have not identified piercing points that could be used to quantify the sense, amount and rate of inferred lateral slip.
Utsalady Point fault
Seismic-reflection profiles and local onshore geology suggest that the northwest-trending Utsalady Point fault is continuous from the eastern Strait of Juan de Fuca across Whidbey Island, Saratoga Passage and Camano Island, a minimum distance of 28 km (figure 2). East of Whidbey Island, the projection of the Utsalady Point fault zone coincides with the southern margin of a low-amplitude aeromagnetic high (figure 3; Blakely and others, 1999b). This anomaly extends at least 25 km southeast of Utsalady Point, suggesting the fault may have a length of 50 km or more.
The Utsalady Point fault occurs as one discrete subvertical structure with north-side-up offset west of Whidbey Island (figs. 2, 10, 13, 27, 28). We infer about 200-300 m of vertical relief across the fault at the base of the Quaternary section on two seismic-reflection profiles (figs. 10, 13) in this area. Assuming a maximum age of 2 Ma for this contact (see section, “Identification and age of the base of the uppermost Pliocene(?) to Pleistocene section”), this displacement yields a minimum vertical slip rate for the Quaternary of about 0.10-0.15 mm/yr (figure 37). Onshore western Whidbey Island, subsurface data (figure 33 ) indicate more than 300 m of relief on the base of the Quaternary, yielding a minimum vertical slip rate of 0.15 mm/yr since about 2 Ma.
Seismic-reflection data from Saratoga Passage (figure 9) east of Whidbey Island represent the fault as a broad (≈1.5 km) zone comprising several splays, on which significant vertical offset on the base of the Quaternary is not obvious. Camano Island onshore data (figs. 34-37) suggest that the southernmost splay in the zone has north-side-down offset, and therefore that the sense of vertical displacement changes along the strike of the fault. This along-strike variation, together with the evidence for contractional deformation in the fault zone (folding of ≈21 ka beds; figs. 34, 35), suggests that the Utsalady Point fault is also an oblique-slip transpressional structure (Christie-Blick and Biddle, 1985). As discussed above (see Fault Mapping, Style and Rates of Deformation, Devils Mountain fault), regional fault geometry suggests left-lateral displacement, but we know of no piercing points that can be used to quantify the sense, amount and rate of inferred lateral slip.
Subsurface data from Camano Island (figure 37) do not provide sufficient information on the top of the Whidbey Formation for it to be an effective marker in constraining vertical offset along the Utsalady Point fault. As noted above (Evidence for Faulting Onshore, Whidbey and Camano Islands), the top of the Olympia beds is significantly higher on the south side of the southern splay in the zone, but its elevation appears to drop to the north approaching this splay, and this datum is only 11 m higher on the south than to the north in the two wells (106, 107) closest to the splay. Moreover, seismic-reflection data (figure 9) do not show obvious south-side-up offset, and considerable erosional relief occurs on the top of the Olympia beds on Whidbey Island and elsewhere in the Puget Lowland (Troost, 1999, among others). Regardless of uncertainties concerning stratigraphic correlation and vertical slip rate in the Camano Island region, outcrops at Utsalady Point indicate significant post-20 ka deformation in the Utsalady Point fault zone. The folded strata at Utsalady Point record a minimum uplift rate of 0.81 mm/yr and a shortening rate of 0.17 mm/yr.
Discussion
The geometry of structures in the eastern Strait of Juan de Fuca-northern Puget Lowland region suggests that the Devils Mountain fault is a transpressional, left-lateral, oblique-slip "master fault," and that the Strawberry Point fault and Utsalady Point faults are probably en-echelon structures. This deformation may be driven by stress associated with convergence along the continental margin. GPS data from this region (Dragert and Hyndman, 1995; Khazaradze and others, 1999) indicate that this stress produces significant east-northeast-directed crustal strain subparallel to the plate convergence vector. The larger part of this strain is thought to be elastic, recoverable following a large plate-boundary earthquake. A smaller component might result in inelastic crustal faulting and folding. In this setting, left-lateral slip would be favored on east-west-trending structures such as the Devils Mountain fault.
Although there are no obvious piercing points in available data that can be used to quantify the amount and rate of lateral slip across this zone, regional geology provides possible constraints. Whetten (1978) suggested about 60 km of left-lateral slip on the Devils Mountain fault based on offset of the Trafton sequence, a distinctive Mesozoic melange unit (part of the eastern melange belt of Tabor, 1994), using piercing points in the San Juan Islands north of the fault and Cascade Range foothills south of the fault. This potential piercing point is suspect because many workers (such as Whetten and others, 1980; Brandon and others, 1988; Tabor, 1994) have shown that the Trafton unit occurs within a stack of thrust sheets that might have had greater lateral extent than present exposures demonstrate. Also, this unit could occur farther west than present exposures reveal on the south side of the fault in the subsurface of the Everett basin. This possible piercing point does, however, probably reveal the maximum amount of left-lateral slip possible across the zone.
The first obvious record of movement along the Devils Mountain fault dates from about 40 Ma, when coarse (clasts as large as 1 m) alluvial-fan conglomerate of the rocks of Bulson Creek was deposited adjacent to the fault in the Everett basin (Marcus, 1980; Whetten and others, 1988). These conglomerates include silicic volcanic clasts that are petrographically similar to Eocene ash-flow tuff units that crop out north of the fault, apparently limiting the amount of post-40 Ma left-lateral slip to less than about 30 km. Making the highly questionable assumptions that (1) the rate of left-lateral slip has been constant over the last 40 m.y. and (2) 30 km is the maximum amount of left slip possible across the structure, yields a maximum lateral slip rate of 0.75 mm/yr over this time period. There are no similar questionable constraints for the possible amount of lateral slip across the Strawberry Point and Utsalady Point faults.
Vertical slip rates on the Strawberry Point and Utsalady Point faults appear comparable to or higher than those on the Devils Mountain fault (figure 37), the structure that regional fault geometry suggests has been the “master fault” within the system. These rates and the evidence for post-80 ka deformation from outcrops at Strawberry Point and Utsalady Point (figs. 31, 35) may indicate that fault kinematics have changed or are in a transitional period in which local deformation has most recently been concentrated on the Strawberry Point and Utsalady Point faults rather than the Devils Mountain fault. Such changes are common within complex strike-slip fault systems (Christie-Blick and Biddle, 1985) and are not surprising. The map geometry of the Strawberry Point and Utsalady Point faults also indicates that they may be connected at depth and represent components of a large transpressional flower structure (Harding and others, 1983; Christie-Blick and Biddle, 1985).
Given the evidence for left-lateral slip on the Devils Mountain, Strawberry Point, and Utsalady Point faults, we believe that deformation along the northwest-trending southern Whidbey Island fault to the south in the eastern Strait of Juan de Fuca region (figure 1) is mainly contractional. This interpretation is consistent with seismic-reflection data from the eastern Strait of Juan de Fuca presented in Johnson and others (1996, their figure 5), who showed this structure as a zone of thrust faults. Johnson and others (1996) previously suggested a component of right-lateral slip on the southern Whidbey Island fault because it forms a part of the crustal boundary on the east and northeast flank of the north-moving Coast Range block. Right-lateral slip on this crustal boundary is required farther to the south.
Determining the rate of lateral slip across the structural zone comprising the Devils Mountain, Strawberry Point, and Utsalady Point faults is thus an important problem left unresolved by this investigation. The difficulty in constraining lateral slip across this structural zone in large part reflects the recent glacial and post-glacial (≈20 ka) age of the landscape. Landforms of tectonic origin (such as scarps, pressure ridges, terraces, or offset drainages) have been eroded or filled in by repeated pulses of glacial erosion and deposition so that, to a large degree, only landforms generated during or after the last glaciation are evident. Given the rates described previously and the relatively friable nature of many glacial deposits, post-glacial landforms may be subtle and have limited preservation potential.
New high-resolution topographic and bathymetric imaging tools may provide the best opportunity for identification of tectonic landforms in this landscape. For example, Bucknam and others (1999) and Nelson and others (1999) used a high-resolution airborne laser terrane mapping survey to identify a post-glacial scarp in a dense forest in the Seattle fault zone. New multibeam bathymetric surveys from offshore California (Bohannon and others, 1998, among others) have shown many tectonic features and offsets associated with strike-slip faulting in the seafloor, and thus such surveys could have similar value in the eastern Strait of Juan de Fuca.
EARTHQUAKE HAZARDS [back to top]
Earthquake occurrence
The historic earthquake record and recorded seismicity support the interpretation that this region is seismically active. The historic record extends back to about 1850 but is of variable quality until about 1929 (Ludwin and Qamar, 1995); accurate recording of regional earthquakes began in 1969 when the Pacific Northwest Seismograph Network was installed. It is noteworthy that Victoria (figure 1) felt a cluster of at least 14 earthquakes between 1859 and 1870 with two having a Mercalli Magnitude Index of VI. The source of these earthquakes is unknown, but they might be associated with the nearby Devils Mountain fault.
Recorded crustal earthquakes in the study area with magnitude (M) larger than 2.5 are shown in figure 2. Between Haro Strait and Lake Cavanaugh (figs. 1, 2), these earthquakes and smaller events have clustered at depths of 12-20 km along a 50° N. dip projection from the surface trace of the Devils Mountain fault (Stanley and others, 1999). If these events are associated with the Devils Mountain fault, then its north dip imaged by seismic-reflection data decreases slightly with depth. It seems equally likely, however, that these events are associated with the northwest-trending folds and faults here considered to be related to the Devils Mountain fault.
Although fewer earthquakes have been recorded south of the Devils Mountain fault in the study area, at least four events (M > 2.5) may correlate with the Utsalady Point or Strawberry Point faults (figure 2). One M = 5.0 event (1/26/1957) occurred beneath Oak Harbor within the Utsalady Point fault zone; a second M = 5.0 event (1/28/1945) has been located near a projection of the Utsalady Point fault zone a few kilometers east of Camano Island. Relevant smaller events include a M = 3.3 (11/1/2000) earthquake that occurred adjacent to the Utsalady Point zone at Strawberry Point and a M = 3.5 event (3/13/1992) that occurred in the eastern Strait of Juan de Fuca close to the location where the Strawberry Point and Utsalady Point faults converge and terminate.
Significance for earthquake hazards
Geologic and geophysical data indicate that the Devils Mountain fault and the newly recognized Strawberry Point and Utsalady Point faults are active structures that represent potential earthquake sources. Critical source parameters that contribute to earthquake hazard assessment include fault location, length, slip rate, and recurrence interval of large earthquakes (Wells and Coppersmith, 1994; Frankel and others, 1996). Figures 2, 27, and 28 show the locations of these faults in the eastern Strait of Juan de Fuca and northern Puget Lowland. Large earthquakes generated in this source zone could affect broad areas and large populations in the Puget and Fraser Lowlands and on southern Vancouver Island. Urban centers proximal to the fault zone include Victoria (< 5 km from the potential earthquake source), Everett (40 km), Bellingham (45 km), Seattle (75 km), and Vancouver (75 km) (figure 1). Moreover, significant parts of this region are underlain by large deltas and sedimentary basins, areas that are particularly prone to strong ground motion.
Using the relationship between rupture length and moment magnitude (M) defined by Wells and Coppersmith (1994) and assuming that the entire mapped length of the Devils Mountain fault (≈125 km) could rupture in one event, an earthquake of M = 7.5 could be generated on this structure. This investigation recognized two possible segment boundaries on the Devils Mountain fault that might limit rupture during a large earthquake; however no data are available to test this segmentation hypothesis.
Based on their minimum lengths (≈22-28 km), earthquakes of M ≈6.7 could occur on the Strawberry Point and Utsalady Point faults. Each of these faults breaks into several splays east of Whidbey Island (figs. 27, 28), but this bifurcation is unlikely to limit earthquake rupture - it should be assumed that one or more of these splays merges with a single trace of each fault at depth. The Strawberry Point and Utsalady Point faults might also connect at depth, a scenario in which surface deformation could occur along each fault in the same earthquake.
Because incorporating slip rates on faults is an important component of seismic hazard assessment and mapping (Frankel and others, 1996, among others), we presented and explained our best information for each fault (figure 38). We consider these variably speculative rates as starting points and expect that they will be refined and modified in the future as more data accumulate. As stressed above ((Fault Mapping, Style, and Rates of Deformation), determining slip rates across the zone is problematic because (1) data constrain only the vertical component of slip on oblique-slip faults, and (2) both the sense of vertical slip and the vertical slip rate vary along the strike of the Strawberry Point and Utsalady Point faults. Our best estimate for vertical slip on the Devils Mountain fault is 0.05-0.31 mm/yr (figure 38). We suspect that the lateral component of slip may be larger, but probably no more than about 0.75 mm/yr based on regional geologic considerations. We think reasonable minimum vertical slip rates for both the Strawberry Point and Utsalady Point faults are about 0.2 mm/yr and that field evidence for contractional deformation suggests an additional significant lateral component of slip. Thus, the cumulative slip rate on the three main faults of this complex northern Puget Lowland structural zone probably exceeds 0.5 mm/yr and could be much larger. By comparison, Johnson and others (1999) suggested about 0.7-1.1 mm/yr of slip on faults of the Seattle fault zone.
Paleoseismological investigations of the Devils Mountain fault, Strawberry Point, and Utsalady Point faults are lacking, hence no information exists on earthquake recurrence interval. Williams and Hutchinson (2000) reported evidence for four late Holocene tsunami deposits from a marsh near Swantown on the northwest coast of Whidbey Island (figure 27). The overlap in age between the two youngest deposits (1160-1350 and 1400-1700 14C yr B.P.) and inferred great earthquakes at the Cascadia plate boundary, about 250 km to the west, suggests they were emplaced by tsunamis from this source area. The two older layers (1810-2060 and 1830-2020 14C yr B.P.) do not correlate with plate boundary events and may be products of earthquakes on local faults in the eastern Strait of Juan de Fuca, such as the Devils Mountain, Strawberry Point, and Utsalady Point faults. In another investigation, Bourgeois and Johnson (2001) found evidence of three liquefaction events in post A.D. 900 deltaic deposits from the Snohomish River delta, 35 km south of the Devils Mountain fault. One of these events has been correlated with a strong earthquake on the Seattle fault, but the others have not been correlated with known events; the Devils Mountain, Strawberry Point, and Utsalady Point faults are nearby possible earthquake sources. Thorson (1996) speculated that earthquake cycles and recurrence intervals for Puget Lowland faults may have been perturbed during glacial loading and rebound, but this hypothesis cannot be tested with available data for any fault in the Puget Lowland.
CONCLUSIONS [back to top]
Marine seismic-reflection surveys, aeromagnetic mapping, coastal exposures of Pleistocene strata, and lithologic logs of water wells provide important information for assessing the active tectonics of the northern Puget Lowland and eastern Strait of Juan de Fuca region of the Pacific Northwest. These data indicate that the Devils Mountain fault and the newly recognized Strawberry Point and Utsalady Point faults are active structures and represent potential earthquake sources.
The north-dipping (45°-75°) Devils Mountain fault extends westward for more than 125 km from the Cascade Range foothills to Vancouver Island, where it may merge with the Leech River and (or) San Juan faults. The Devils Mountain fault is bounded by northwest-trending en-echelon folds and faults, a map pattern strongly suggesting that it is a left-lateral, oblique-slip, transpressional "master fault." Aeromagnetic anomalies coincide with both the trace of the Devils Mountain fault and en-echelon structures. Quaternary strata are deformed on nearly all seismic-reflection profiles, and onshore subsurface data suggest offset of upper Pleistocene strata.
The west-northwest-trending, subvertical Strawberry Point fault cuts across northern Whidbey Island and has a minimum length of 22 km. On the west coast of Whidbey Island and in the Strait of Juan de Fuca, the fault has south-side-up offset and forms the northern boundary of an uplift of pre-Tertiary basement rock. The fault bifurcates into a 2-km-wide zone as it crosses Whidbey Island. A stratigraphic correlation diagram based on outcrops and water-well logs suggests that each of the four fault splays within this zone has apparent north-side-up offset. Outcrops at Strawberry Point also indicate considerable shortening (dips as steep as 45°) in upper Pleistocene strata between the faults. The vertical fault trace, reversal of offset, and evidence for associated contractional deformation indicate that the Strawberry Point fault is also an oblique-slip, transpressional fault.
The northwest-trending, subvertical Utsalady Point fault similarly cuts across northern Whidbey Island and has a minimum length of 28 km. It forms the southern margin of the uplifted pre-Tertiary basement block on the west coast of Whidbey Island where it has north-side-up offset. Offshore seismic-reflection data from east of Whidbey Island indicate that it also bifurcates into a broad (1.5 km) zone of several splays to the east. Onshore outcrops and subsurface logs from Camano Island indicate a probable reversal of offset (to south side up) along the zone; they also reveal both faulting and folding (dips as steep as 24°) in upper Pleistocene strata. As with the Strawberry Point fault, the vertical fault trace(s), reversal of offset, and evidence for associated contractional deformation suggest that the Utsalady Point fault is an oblique-slip, transpressional fault.
Collectively, the Devils Mountain, Strawberry Point, and Utsalady Point faults represent an active complex, distributed, transpressional deformation zone. The cumulative slip rate on three main faults of this zone probably exceeds 0.5 mm/yr and could be much larger.
| AccessibilityFOIAPrivacyPolicies and Notices | |
| |
|