
Scientific Investigations Report 2004–5034
Interlaboratory-Comparison Program
Figure 1. Intersite-comparison program of the U.S. Geological Survey Qualit...
Figure 2. Distribution of pH and specific-conductance values for intersite-...
Figure 3. Distribution of pH and specific-conductance values for intersite-...
Figure 4. Percentiles for pH and specific conductance from intersite-compar...
Figure 5. Summary of followup studies completed during 2000 for the intersi...
Figure 6. Summary of followup studies completed during 2001 for the intersi...
Figure 7. Blind-audit program of the U.S. Geological Survey.
Figure 8. Paired bucket-sample concentrations minus bottle-sample concentra...
Figure 9. Relation between paired blind-audit differences for major ions an...
Figure 10. Relation between paired blind-audit differences for hydrogen ion...
Figure 11. Relation between paired blind-audit differences and sample volum...
Figure 12. Relation between paired blind-audit differences and sample volum...
Figure 13. Field-audit program of the U.S. Geological Survey.
Figure 14. Paired bucket-sample concentrations minus bottle-sample concentr...
Figure 15. Relation between paired field-audit differences for major ions a...
Figure 16. Relation between paired field-audit differences for hydrogen ion...
Figure 17. Relation between paired field-audit differences for the major io...
Figure 18. Relation between paired field-audit differences and sample volum...
Figure 19. Interlaboratory-comparison program of the U.S. Geological Survey.
Figure 20. Difference between the measured calcium concentration values and...
Figure 21. Difference between the measured magnesium concentration values a...
Figure 22. Difference between the measured sodium concentration values and ...
Figure 23. Difference between the measured potassium concentration values a...
Figure 24. Difference between the measured ammonium concentration values an...
Figure 25. Difference between the measured chloride concentration values an...
Figure 26. Difference between the measured nitrate concentration values and...
Figure 27. Difference between the measured sulfate concentration values and...
Figure 28. Difference between the measured pH concentration values and the ...
Figure 29. Difference between the measured specific-conductance values and ...
Figure 30. Number of data points outside the control limits for the Central...
Figure 31. Median sample chemistry for selected analytes at three National ...
Figure 32. Median hydrogen-ion concentration and specific conductance, medi...
Figure 33. Median absolute error for analyte concentration and deposition f...
Figure 34. Median absolute error for hydrogen-ion concentration and deposit...
Table 1. Site-operator responses and summary statistics for the 2000 inters...
Table 2. Site-operator responses and summary statistics for the 2001 inters...
Table 3. Solutions used in the 2000–2001 blind-audit, field-audit, and inte...
Table 4. Target values for solutions used in the 2000–2001 U.S. Geological ...
Table 5. Selected statistics for the paired bucket-sample concentration min...
Table 6. Relative and absolute bucket-minus-bottle differences calculated a...
Table 7. Results of the 2000 through 2001 Kruskal-Wallis analysis of varian...
Table 8. Selected statistics for the paired bucket-sample concentration min...
Table 9. Number of determinations exceeding the minimum reporting limit for...
Table 10. Relative and absolute bucket-minus-bottle differences calculated ...
Table 11. Most probable values for solutions used in the 2000–2001 U.S. Geo...
Table 12. Comparison of the differences between reported concentrations and...
Table 13. Number of analyte determinations greater than the minimum reporti...
Table 14. Summary of absolute differences for analysis of replicate natural...
Table 15. Comparison of median absolute error, in percent, for each measure...
| Multiply | By | To obtain |
|---|---|---|
| centimeter (cm) | 0.3937 | inch |
| liter (L) | 1.057 | quart |
| milliliter (mL) | 0.03381 | ounce, fluid |
| kilograms per hectare | 0.8922 | pounds per acre |
Temperature in degrees Celsius (°C) may be converted to degrees Fahrenheit (°F) as follows:
°F = 9/5(°C) + 32
The following terms, abbreviations, and acronyms also are used in this report:
microsiemens per centimeter at 25 degrees Celsius (µS/cm)
megohm (MΩ)
microequivalents per liter (µeq/L)
milligrams per liter (mg/L)
kilograms per hectare (kg/ha)
microgram (µg)
absolute value of x = |x|, where x takes the form of numerical values or algebraic expresssions maximum probability of rejecting the null hypothesis when it is true (α)
National Atmospheric Deposition Program/National Trends Network (NADP/NTN)
National Institute of Standards and Technology (NIST)
median absolute error (MAE), in percent
NADP Central Analytical Laboratory (CAL)
Central Analytical Laboratory, replicate natural samples (CALNAT)
median absolute difference (MAD)
quality assurance (QA)
U.S. Geological Survey (USGS)
quality control (QC)
most probable values (MPVs)
Atmospheric Integrated Research Monitoring Network (AIRMoN)
relative percent difference (RPD)
high-density polyethylene (HDPE)
minimum reporting limit (MRL)
High Purity Standards, Inc. (HPS)
Five external quality-assurance programs were operated by the U.S. Geological Survey for the National Atmospheric Deposition Program/National Trends Network (NADP/NTN) from 2000 through 2001 (study period): the intersite-comparison program, the blind-audit program, the field-audit program, the interlaboratory-comparison program, and the collocated-sampler program. Each program is designed to measure specific components of the total error inherent in NADP/NTN wet-deposition measurements.
The intersite-comparison program assesses the variability and bias of pH and specific-conductance determinations made by NADP/NTN site operators with respect to accuracy goals. The accuracy goals are statistically based using the median of all of the measurements obtained for each of four intersite-comparison studies. The percentage of site operators responding on time that met the pH accuracy goals ranged from 84.2 to 90.5 percent. In these same four intersite-comparison studies, 88.9 to 99.0 percent of the site operators met the accuracy goals for specific conductance.
The blind-audit program evaluates the effects of routine sample handling, processing, and shipping on the chemistry of weekly precipitation samples. The blind-audit data for the study period indicate that sample handling introduced a small amount of sulfate contamination and slight changes to hydrogen-ion content of the precipitation samples. The magnitudes of the paired differences are not environmentally significant to NADP/NTN data users.
The field-audit program (also known as the "field-blank program") was designed to measure the effects of field exposure, handling, and processing on the chemistry of NADP/NTN precipitation samples. The results indicate potential low-level contamination of NADP/NTN samples with calcium, ammonium, chloride, and nitrate. Less sodium contamination was detected by the field-audit data than in previous years. Statistical analysis of the paired differences shows that contaminant ions are entrained into the solutions from the field-exposed buckets, but the positive bias that results from the minor amount of contamination appears to affect the analytical results by less than 6 percent.
An interlaboratory-comparison program is used to estimate the analytical variability and bias of participating laboratories, especially the NADP Central Analytical Laboratory (CAL). Statistical comparison of the analytical results of participating laboratories implies that analytical data from the various monitoring networks can be compared. Bias was identified in the CAL data for ammonium, chloride, nitrate, sulfate, hydrogen-ion, and specific-conductance measurements, but the absolute value of the bias was less than analytical minimum reporting limits for all constituents except ammonium and sulfate. Control charts show brief time periods when the CAL's analytical precision for sodium, ammonium, and chloride was not within the control limits. Data for the analysis of ultrapure deionized-water samples indicated that the laboratories are maintaining good control of laboratory contamination. Estimated analytical precision among the laboratories indicates that the magnitudes of chemical-analysis errors are not environmentally significant to NADP data users.
Overall precision of the precipitation-monitoring system used by the NADP/NTN was estimated by evaluation of samples from collocated monitoring sites at CA99, CO08, and NH02. Precision defined by the median of the absolute percent difference (MAE) was estimated to be approximately 10 percent or less for calcium, magnesium, sodium, chloride, nitrate, sulfate, specific conductance, and sample volume. The MAE values for ammonium and hydrogen-ion concentrations were estimated to be less than 10 percent for CA99 and NH02 but nearly 20 percent for ammonium concentration and about 17 percent for hydrogen-ion concentration for CO08.
As in past years, the variability in the collocated-site data for sample volume (measured from the AeroChem Metrics wet-deposition collectors) exceeded the variability measured for precipitation depth (measured from the Belfort rain gages). Estimated MAE for sample volume was nearly identical for all collocated sites at about 3 percent, which implies that error due to sampling-equipment effects was small. Estimated MAE for precipitation depth was about 5 percent or less at CA99 and NH02 but was slightly over 10 percent at CO08.
A fundamental objective of the National Atmospheric Deposition Program (NADP) is to provide scientific investigators worldwide with a long-term, high-quality database of atmospheric-deposition information (Nilles, 2001). The NADP consists of three monitoring networks that are used to collect rainfall data and atmospheric deposition samples for chemical analysis: (1) National Trends Network (NTN), (2) Atmospheric Integrated Research Monitoring Network (AIRMoN), and (3) Mercury Deposition Network (MDN). The NADP/NTN has monitored the effects of wet deposition across the United States since 1978 (Robertson and Wilson, 1985; Peden, 1986). Research scientists use NADP/NTN data to study the effects of acidic deposition on human health and the environment. All operators of NADP/NTN sites adhere to the same sample-collection and analysis procedures using identical wet-deposition collectors, described by Dossett and Bowersox (1999), and standard NADP/NTN sample-handling and shipping protocols are followed at the sites. Samples from the NADP/NTN sites are sent to the Illinois State Water Survey, Central Analytical Laboratory (CAL), for analysis. A protocol report providing detailed information on the quality-assurance (QA) procedures and analytical methods is available (See and others, 1990).
This report describes the results of the external QA programs operated by the U.S. Geological Survey (USGS) in support of the NADP/NTN during 2000–2001 (study period). These programs are designed to (1) assess the variability and bias of onsite determinations of pH and specific conductance (intersite-comparison program); (2) evaluate potential contamination due to handling, processing, and shipping of samples collected within the NADP/NTN (blind-audit program); (3) evaluate potential contamination introduced from field exposure of the samples (field-audit program); (4) estimate the variability and bias of analytical results determined by separate laboratories routinely measuring wet deposition (interlaboratory-comparison program); (5) facilitate integration of data from various monitoring networks; and (6) estimate the overall variability of the monitoring network, from the point of sample collection through laboratory data quality control (collocated-sampler program). The term "major ions" in this text refers to calcium, magnesium, sodium, potassium, ammonium, chloride, nitrate, and sulfate. Throughout this report, concentration results are presented for cations first (calcium, magnesium, sodium, potassium, and ammonium), followed by anions (chloride, nitrate, and sulfate), followed, where appropriate, by hydrogen-ion concentration, specific conductance, precipitation depth, and sample volume. Hydrogen-ion concentrations are calculated from reported pH values and then analyzed herein for selected programs where observed differences in hydrogen-ion concentration are commonly small. Conversion of the pH measurements to hydrogen-ion concentration provides resolution of differences that would be masked by the non-linear pH scale.
Nonparametric rank-based alternatives to traditional hypothesis testing compose the statistical analysis framework in this report. Nonparametric statistical tests were used because the data sets do not adhere completely to the normal distribution requirements of traditional statistics. Hypothesis tests included the Wilcoxon signed-rank test and the Kruskal-Wallis test (Kanji, 1993). The Wilcoxon signed-rank test determines if there is a shift in the distribution due to the treatment of a paired replicate analysis (Hollander and Wolfe, 1999). Because the Wilcoxon signed-rank test is slightly less powerful for paired samples than the paired t-test (Kanji, 1993), results from the paired t-test were included for some of the paired analyses for comparison purposes. The Kruskal-Wallis test (Iman and Conover, 1983) was used to compare two or more independent samples (SAS Institute Inc., 1989).
All null hypotheses were tested at the 95-percent confidence level (α=0.05 statistical significance level), which implies that a 5-percent chance of rejecting the null hypothesis when it is true is acceptable. For each test, the probability of rejecting the null hypothesis when it is true (p-value) is calculated. A p-value less than 0.05 indicates that there is less than a 5-percent chance of rejecting the null hypothesis when it is true. The hypothesis tests are based on two-sided rather than one-sided alternatives, whereby the total acceptable uncertainty of 5 percent (α=0.05) is split between the positive and negative ends of the data distribution. Huntsberger and Billingsley (1981) provide a detailed explanation of two-sided and one-sided hypothesis testing.
The f-pseudosigma values are presented for many of the results in this report. The f-pseudosigma may be thought of as a nonparametric analogue of the standard deviation of a sample of a population. The f-pseudosigma is calculated as the interquartile range (75th-percentile value minus the 25th-percentile value) divided by 1.349 (Iman and Conover, 1983), as shown in equation 1.
| f-pseudosigma = | 75th percentile – 25th percentile | (1) |
| 1.349 |
Relative and absolute percent differences are calculated for each QA program as an estimation of the relative amount of error attributed to individual components of the data-collection process. The absolute percent differences are used to quantify variability, whereas the relative differences are used to quantify bias. The relative and absolute percent differences are calculated for each paired difference as a percentage of the target sample concentration:
Relative percent difference (RPD)
= [(C1–C2)/C3] • 100 (2)
and
Absolute percent difference
= |(C1–C2)/C3| • 100 (3)
where
| C1 | = sample concentration, in milligrams per liter, from the sample exposed in the field to all handling and processing steps of a normal weekly precipitation sample; | |
| C2 | = sample concentration, in milligrams per liter, from the control sample subjected to minimal handling and processing; | |
| and | ||
| C3 | = target concentration of the sample, in milligrams per liter. |
Concise graphical displays such as boxplots were used to depict data distributions and provide visual representations of NADP/NTN data quality. Tukey's "schematic plot" version of the boxplot (Chambers and others, 1983) was used for all boxplots, whereby notches in the sides of the boxes are used to highlight the location of the median. The ends of the box are drawn at the lower and upper quartiles, which are the 25th and 75th percentiles, respectively. Whiskers are drawn from the quartiles to the last value that is located between the quartiles and within a distance of 1.5 times the interquartile range. Values outside the boxplot whiskers are graphed individually as an asterisk. In a normal distribution, there should be one outside value for every 100 data points (Helsel and Hirsch, 1992). Therefore, the occurrence of asterisks more frequently than expected provides a quick indication the data are not normally distributed. The magnitude of measurement bias was quantified in several ways for the convenience of the reader, including units of concentration (for example, milligrams per liter [mg/L]), signed differences, and percent differences.
Intersite-comparison studies are completed by the USGS to assess field pH and specific-conductance measurement accuracy, defined herein as the combined evaluation of variability and bias. If measurements are not accurate, site operators are provided troubleshooting assistance by the USGS. A flow chart depicting the chronological order of the intersite-comparison program is shown in figure 1. NADP/NTN site operators measure pH and specific conductance on weekly precipitation samples, provided that adequate sample volume is obtained. Due to the low ionic strength of precipitation, minor changes may occur between sample collection and laboratory analysis (Bigelow and others, 1989). Many authors have determined that onsite measurements (of pH in particular) are more representative of precipitation than subsequent laboratory determinations (Hem, 1985).
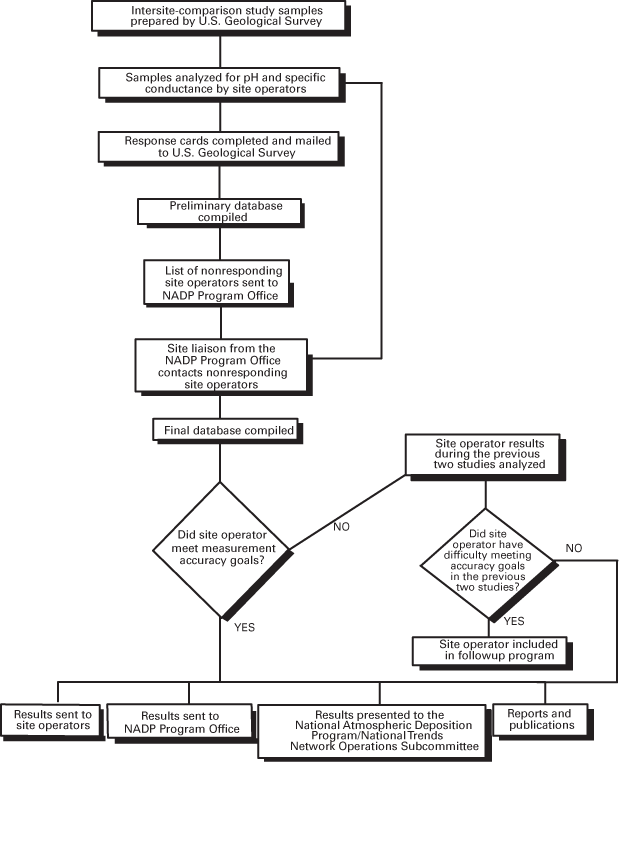
Figure 1. Intersite-comparison program of the U.S. Geological Survey Quality-Assurance Program.
In the intersite-comparison studies, site operators determine the pH and specific conductance of synthetic precipitation-check samples prepared by the USGS. Protocols identical to NADP/NTN weekly sample-measurement methods are used (Gordon and others, 1991; Dossett and Bowersox, 1999). The synthetic precipitation-check samples prepared by the USGS have pH and specific conductance similar to natural wet-deposition samples collected by the NADP/NTN. The USGS check samples are prepared by adding nitric acid and potassium chloride to deionized water. The pH is adjusted to a specific value from 3.9 to 5.3 using the nitric acid. Then the specific conductance of the solution is adjusted using the potassium chloride. The target values of the solutions are verified by pH and specific-conductance measurements prior to sending the solutions to the sites. The same check solution is sent to all sites for each study. Each site's ability to achieve the target values for measured pH and specific conductance is evaluated. Operators also measure check standards provided by the CAL (pH: 4.19 ± 0.05, and specific conductance: 14 ± 2.0 µS/cm), but these measurements are not evaluated herein.
Intersite studies 44 and 45 were completed in June and December 2000, respectively; studies 46 and 47 were completed in June and December 2001, respectively. From the day the samples were mailed, operators were allowed 45 days to perform the field measurements. Sites were not included in the percentage of sites achieving goals if (1) they responded late, (2) the field equipment was completely inoperable, (3) the site was not in operation at the time of the study, or (4) the site did not perform field chemistry during the intersite-comparison study period. Accuracy goals are designed to address the increased difficulty of measuring pH in low-ionic-strength solutions as the hydrogen-ion concentration approaches neutrality (Gordon, 1999). Accuracy goals for pH measurements are based on a multiple-regression function that incorporates the solution's hydrogen-ion concentration and the results from past intersite studies (John D. Gordon, U.S. Geological Survey, written commun., 1995). The accuracy goals are symmetrical in units of hydrogen-ion concentration and, therefore, are asymmetrical in units of pH. The specific-conductance values for all of the intersite-comparison solutions used during the study period were between 10 and 60 µS/cm. For specific conductance, if the most probable specific conductance was greater than 10 µS/cm but less than or equal to 60 µS/cm, the accuracy criterion was ±4 µS/cm. This criterion was chosen to be a factor of two greater than the NADP/NTN quality-control (QC) check sample criteria, which is ±2 µS/cm.
As in past years, the median values obtained from the site operators were used as the most probable values (MPVs) for intersite solutions used during the study period (Gordon, 1999; See and others, 1989). The median values from approximately 200 site-operator measurements are considered a more accurate representation of the most likely values for the intersite solutions than either a few in-house measurements or the theoretical values. Previous studies have found no appreciable deterioration of intersite solutions over the duration of the studies, which further supports the use of the median site-operator values as the MPVs (Gordon and others, 1995). Table 1 contains a summary of the results for studies 44 and 45. Table 2 summarizes the results for studies 46 and 47. The accuracy goals for each study also are provided (tables 1 and 2).
[µS/cm, microsiemens per centimeter at 25 degrees Celsius]
| Site-operator responses | Study number | |
|---|---|---|
| 44 | 45 | |
| Number of site operators receiving samples | 218 | 219 |
| Number of site operators submitting pH values by closing date of study | 192 | 196 |
| Number of site operators submitting specific-conductance values by closing date of study | 192 | 199 |
| Site operators responding late | 13 | 12 |
| Number of nonresponding site operators | 11 | 8 |
| Sites that were not in operation | 0 | 0 |
| Site operators reporting equipment problems: | ||
| pH meter/electrode completely inoperable | 2 | 3 |
| pH meter/electrode problems | 0 | 0 |
| Specific-conductance probe/meter completely inoperable | 2 | 0 |
| Specific-conductance probe/meter problems | 0 | 0 |
| Median pH, target pH | 4.53, 4.50 | 4.09, 4.05 |
| Number of responding sites that met the pH accuracy goals | 164 | 165 |
| Accuracy goals for pH: lower and upper acceptable values | 4.40, 4.64 | 4.01, 4.15 |
| Percentage of responding sites that met the pH accuracy goals | 85.4 | 84.2 |
| f-pseudosigma for pH | 0.052 | 0.044 |
| Median specific conductance, target specific conductance, in µS/cm | 30.7, 30.0 | 38.4, 37.5 |
| Number of responding sites that met the specific-conductance accuracy goals (±4 µS/cm) | 186 | 177 |
| Accuracy goals for specific conductance: lower and upper acceptable values, in µS/cm | 26.7, 34.7 | 34.4, 42.4 |
| Percentage of responding sites that met the specific-conductance accuracy goals | 96.9 | 88.9 |
| f-pseudosigma for specific conductance | 0.964 | 1.483 |
[µS/cm, microsiemens per centimeter at 25 degrees Celsius]
| Site-operator responses | Study number | |
|---|---|---|
| 46 | 47 | |
| Number of site operators receiving samples | 220 | 223 |
| Number of site operators submitting pH values by closing date of study | 189 | 209 |
| Number of site operators submitting specific-conductance values by closing date of study | 193 | 209 |
| Site operators responding late | 12 | 2 |
| Number of nonresponding site operators | 11 | 10 |
| Sites that were not in operation | 0 | 0 |
| Site operators reporting equipment problems: | ||
| pH meter/electrode completely inoperable | 8 | 2 |
| pH meter/electrode problems | 0 | 0 |
| Specific-conductance probe/meter completely inoperable | 4 | 2 |
| Specific-conductance probe/meter problems | 0 | 0 |
| Median pH, target pH | 4.99, 5.05 | 5.06, 5.10 |
| Number of responding sites that met the pH accuracy goals | 171 | 187 |
| Accuracy goals for pH: lower and upper acceptable values | 4.80, 5.19 | 4.84, 5.28 |
| Percentage of responding sites that met the pH accuracy goals | 90.5 | 89.5 |
| f-pseudosigma for pH | 0.067 | 0.074 |
| Median specific conductance, target specific conductance, in µS/cm | 26.1, 25.0 | 15.7, 15.0 |
| Number of responding sites that met the specific-conductance accuracy goals (±4 µS/cm) | 186 | 207 |
| Accuracy goals for specific conductance: lower and upper acceptable values, in µS/cm | 22.1, 30.1 | 11.7, 19.7 |
| Percentage of responding sites that met the specific-conductance accuracy goals | 96.4 | 99.0 |
| f-pseudosigma for specific conductance | 0.741 | 0.371 |
The target pH for intersite-comparison study 44 was 4.50; the resulting median pH of site operators' responses was 4.53. The target specific conductance of study 44 was 30.0 µS/cm; the median value determined from all site-operator measurements was 30.7 µS/cm. More than 85 percent (164 out of 192) of the site operators met the pH accuracy goal of 4.40 to 4.64 in intersite-comparison study 44. The NADP/NTN accuracy goals for specific conductance for study 44 was ±4 µS/cm of the median value of 30.7 µS/cm. Using this criterion, 96.9 percent of responding site operators met the goals for specific-conductance measurements.
The test solution used in intersite-comparison study 45 had a target pH of 4.05 and a calculated specific conductance of 37.5 µS/cm. A total of 165 site operators, 84.2 percent, met the pH accuracy goals of 4.01 to 4.15. The median specific conductance was 38.4 µS/cm, with 88.9 percent of site operators achieving the accuracy goal of ±4 µS/cm of the median value.
For intersite-comparison study 46, the reference solution target pH was 5.05 and the target specific conductance was 25.0 µS/cm. A total of 171 site operators (90.5 percent) met the pH accuracy goals of 4.80 to 5.19 pH units. The median specific-conductance value was 26.1, and 96.4 percent of site operators achieved the median ±4-µS/cm accuracy goal.
The test solution used in intersite-comparison study 47 had a target pH of 5.10 and a calculated specific conductance of 15.0 µS/cm. A total of 187 site operators (89.5 percent) met the pH accuracy goal of 4.84 to 5.28. The median specific conductance was 15.7, with 99.0 percent of site operators achieving the median ±4-µS/cm accuracy goal.
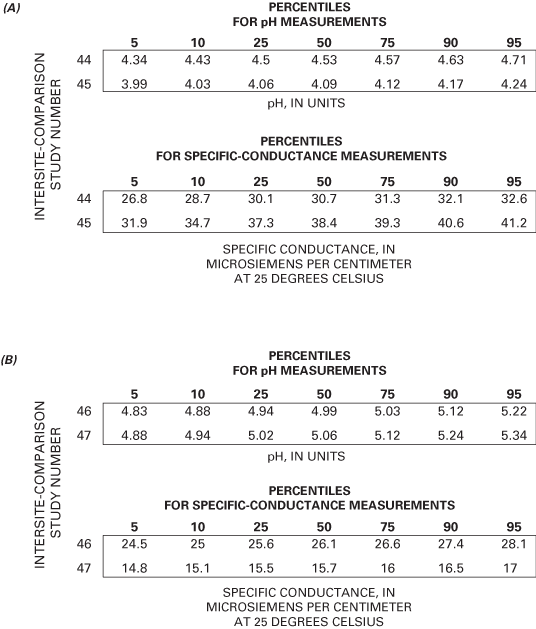
Figure 2 depicts the results of pH and specific-conductance values for all participating site operators in intersite-comparison studies 44 and 45; the results for studies 46 and 47 are shown in figure 3. The boundaries depicted on the scatterplots delineate the pH and specific-conductance values for those site operators meeting the accuracy goals for pH, specific conductance, both measurements, or those not meeting the accuracy goals. The percentile distributions for the reported pH and specific-conductance values for studies 44 through 47 are listed in figure 4.
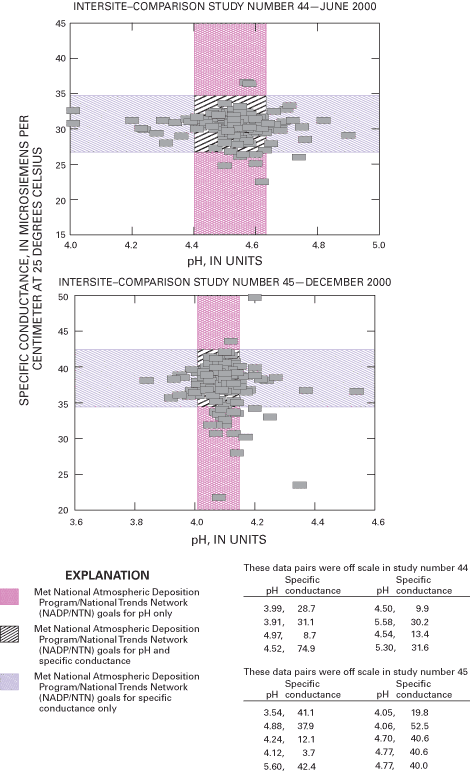
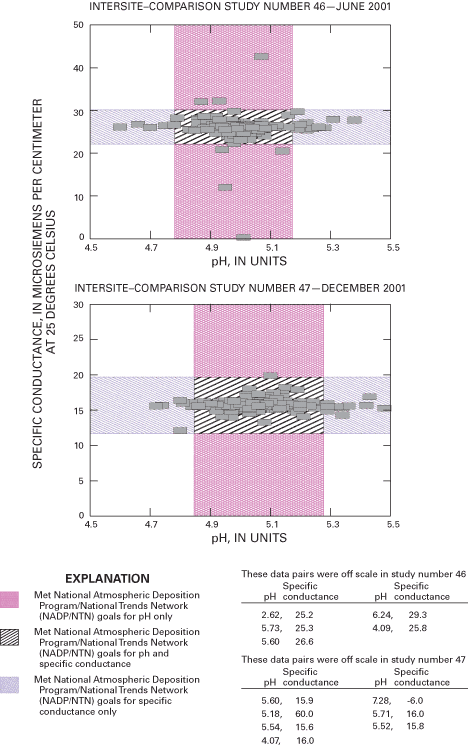
Although performance for field specific-conductance measurement remains high, the data indicate a potential decrease in the quality of field pH measurements during 2000 compared to 1998–99 (Gordon and others, 2003), which can be attributed to a number of potential equipment and operator-related factors. The quality of the pH data improved in 2001. Overall, the results indicate that NADP/NTN field measurements of pH and conductivity are reliable for analysis and interpretation of spatial and temporal trends by NADP data users.
After the initial intersite-comparison study results are tabulated, the results from site operators who do not meet the pH accuracy goals are evaluated further in a followup program. The purpose of the followup program is to help site operators identify and resolve sources of measurement difficulty and produce better weekly data for the NADP/NTN. Each operator that fails to meet the accuracy goals is placed into one of four followup categories based on their performance in the current study and in the two preceding intersite studies. For the followup evaluation, the site operator's reported values are converted into standardized z-values. Z-values are analogous to z-scores described by Iman and Conover (1983), whereby nonparametric estimators replace the traditional parametric estimators. Z-values indicate the number of standard deviations between a measured value and the median. The sign of the z-value denotes whether it is in the left or right tail of the distribution. For example, a z-value of +1 identifies the value to be approximately one standard deviation to the right of the median, whereas a z-value of –2 is two standard deviations to the left of the median. Z-values outside ±3 standard deviations are considered to be outliers because approximately 99 percent of the data in a population are within three standard deviations of the mean. The formulas for z-scores and z-values are:
z-score =  (4)
(4)
z-value =  (5)
(5)
where
| x | = an individual observation; | |
 |
= the mean of all observations; | |
 |
= the median of all observations; | |
| S | = standard deviation of all observations; | |
| and | ||
| fps | = f-pseudosigma of all observations: | |
(75th percentile – 25th percentile |
By using standardized z-values, each site operator's performance, relative to all other site operators, is evaluated statistically. The standardized z-values take into account the amount by which pH measurement accuracy goals are missed, given the relative difficulty of measuring the pH of the solution. The relative difficulty of measuring the pH of the low-ionic-strength solutions is inversely related to the hydrogen-ion concentration of the solution: the lower the hydrogen-ion concentration and ionic strength, the more difficult the measurement. A cumulative z-value total for the three most recent studies is used to place each site operator failing to meet the accuracy goals into one of these followup study categories:
Level 1. Operators receive a letter discussing common sources of measurement errors and requesting voluntary, additional measurement of the check sample.
Level 2. Operators receive a letter discussing common sources of measurement errors and requesting reanalysis of the remaining portion of the check sample.
Level 3. Operators receive a letter discussing common sources of measurement errors and requesting reanalysis of the original check sample plus measurement of one additional check sample.
Level 4. Operators receive a letter discussing common sources of measurement error and requesting reanalysis of the original check sample plus measurement of two additional check samples of different pH and specific conductance to measure.
The categories are additive: Level 3 site operators remeasure the original sample and measure an additional check sample. Level 4 site operators remeasure the original sample and measure two additional check samples. The additional check samples sent to Level 3 and 4 site operators are past intersite-comparison study samples that have been stored at 4°C in their original unopened bottles. Previous studies (Gordon and others, 1995; Peden and Skowron, 1978) indicate that the stability of hydrogen-ion concentration over time is sufficient to allow the use of previous intersite samples in the followup analysis.
The number of site operators in the Level 1 category for intersite-comparison followup studies decreased throughout the study period. For example, there were 18 site operators participating in Level 1 followup studies in June 2000, and the number of site operators participating in Level 1 followup studies steadily decreased to zero in December 2001. Also during 2000 and 2001, the number of site operators required to participate in Level 1, Level 2, Level 3, and Level 4 intersite-comparison followup studies decreased from 47 in June 2000 to 33 in December 2001. Figure 5 summarizes the followup results for studies 44 and 45 during 2000, and figure 6 summarizes the results for studies 46 and 47 during 2001.
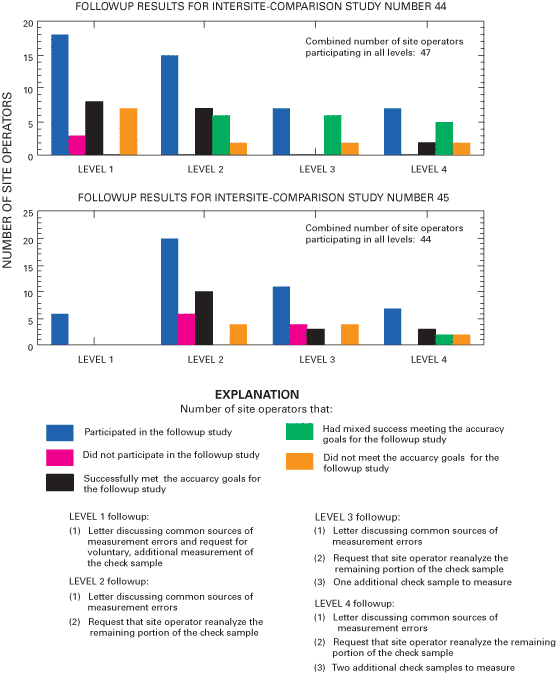
Figure 5. Summary of followup studies completed during 2000 for the intersite-comparison program.
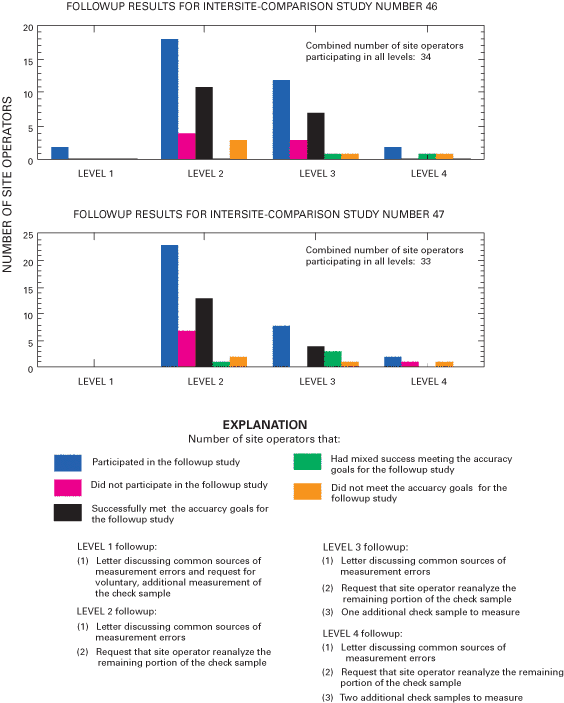
Figure 6. Summary of followup studies completed during 2001 for the intersite-comparison program.
The blind-audit program assesses the effects of routine sample handling, processing, and shipping of wet-deposition samples on analyte variability and bias. Contact with the sample-collection container and routine handling and processing procedures applied to wet-deposition samples have been identified as sources of contamination (Gordon, 1999; Nilles and others, 1995). Constituent loss from solution, due to adsorption to the bucket walls or other reactions, also is possible.
In the blind-audit program, site operators submit a portion of a synthetic wet-deposition sample disguised as a natural wet-deposition sample to the CAL for analysis. The operators pour 75 percent of the synthetic sample into a clean bucket that is obtained fresh from the operators' stock supplied by the CAL. The normal processing and handling steps of a regular weekly sample are applied to the "bucket portion" of the blind-audit sample. The bucket sample is disguised as a natural sample. The remaining 25 percent of the synthetic sample remains in the bottle and is subject to minimal handling. The minimally handled bottle portion of the blind-audit sample is sent to the CAL for analysis in a separate mailer and is analyzed independently of the bucket portion. Chemical analysis results for the bucket portion are compared to the results for the bottle portion to determine if significant addition or loss of constituents has occurred from sample handling, processing, and shipping.
Twenty-five blind-audit samples were sent to the operators of selected NADP/NTN sites each quarter during the study period. After a site has been selected for the blind-audit program (assuming successful participation), the site is not selected again for the blind-audit program until the operators of all other NADP/NTN sites have participated.
The solutions used in the blind-audit program are intended to replicate the range of analyte concentrations typically found in natural NADP/NTN precipitation samples. The median analyte-concentration values for the solutions used in the blind-audit program (other than ultrapure deionized water) were between the 25th and 75th percentiles of natural wet-deposition samples collected at all NADP/NTN sites. Many of the solutions used in the blind-audit program also are used in the field-audit and interlaboratory-comparison programs. Descriptions of each solution are listed in table 3. The target values for these solutions are presented in table 4.
[MΩ, megohm; D.I., deionized; HPS, High Purity Standards, Charleston, South Dakota; USGS, U.S. Geological Survey; dilute solutions, solutions provided by vendor already diluted to specified concentrations; stock solutions, concentrated solutions provided by vendor and diluted to specified concentrations by the USGS]
| Solution | Preparation | Remarks |
|---|---|---|
| Ultrapurea,b D.I. water | USGS. | Deionized water with a measured resistivity greater than 16.7 MΩ. |
| SP–2a SP–97b SP–97ba SP–98ba |
HPS prepares and provides dilute solutions to USGS. USGS bottles the HPS solutions. | Concentrations certified by HPS laboratory analysis against an independent source traceable to the National Institute of Standards and Technology. |
| SP–1a,b SP–2b SP–3a,b SP–5a,b SP98b SP98cb |
HPS provides concentrated, stock solutions to USGS. USGS dilutes the stock solutions and then bottles them. | Concentrations certified by HPS laboratory analysis against an independent source traceable to the National Institute of Standards and Technology. |
a Solution used during 2000.
b Solution used during 2001.
[Target values are the theoretical concentrations based on dilution of stock solutions with certified concentrations; ultrapure, deionized water with a resistivity greater than 16.7 megohms (MΩ) and assumed to have all constituent concentrations less than the method detection limit; pH, in units; specific conductance, in microsiemens per centimeter at 25 degrees Celsius; <MRL indicates value less than minimum reporting limit; Ca2+, calcium; Mg2+, magnesium; Na+, sodium; K+, potassium; NH4+, ammonium; Cl–, chloride; NO3–, nitrate; SO42–, sulfate; significant figures vary due to differences in laboratory precision; boldface indicates value was obtained as the median of all the field-audit, blind-audit, and interlaboratory-comparison samples]
| Solution | Ca2+ | Mg2+ | Na+ | K+ | NH4+ | Cl– | NO3– | SO42– | hpH | iSpecific conductance |
|---|---|---|---|---|---|---|---|---|---|---|
| Ultrapurea,b,c | <MRL | <MRL | <MRL | <MRL | <MRL | <MRL | <MRL | <MRL | 5.55 | 1.3 |
| SP–1a,c | 0.460 | 0.092 | 0.420 | 0.076 | 0.680 | 0.590 | 2.10 | 3.850 | 4.42 | 29.7 |
| SP–2a,b,c | 0.460 | 0.070 | 0.360 | 0.060 | 0.560 | 0.450 | 3.00 | 2.334 | 4.51 | 24.8 |
| SP–3b | 0.159 | 0.049 | 0.111 | 0.023 | 0.140 | 0.170 | 1.08 | 0.960 | 4.78 | 11.2 |
| SP–5a,c | 0.575 | 0.168 | 0.454 | 0.083 | 0.710 | 0.720 | 2.55 | 4.510 | 4.33 | 35.5 |
| SP–97bd,e | 0.129 | 0.019 | 0.025 | 0.017 | 0.290 | 0.054 | 1.81 | 1.160 | 4.22 | 15.6 |
| SP–97f | 0.130 | 0.019 | 0.024 | 0.017 | 0.290 | 0.054 | 1.18 | 1.140 | 5.20 | 11.9 |
| SP–98bd,e | 0.013 | 0.030 | 0.215 | 0.056 | 0.120 | 0.230 | 0.570 | 2.128 | 4.16 | 18.2 |
| SP–98g | 0.013 | 0.024 | 0.208 | 0.056 | 0.120 | 0.230 | 0.570 | 2.410 | 4.43 | 22.6 |
| SP–98cf | 0.016 | 0.038 | 0.208 | 0.061 | 0.120 | 0.234 | 0.570 | 2.428 | 4.14 | 20.4 |
a Used in the 2000–2001 blind-audit program.
b Used in the 2000–2001 field-audit program.
c Used in the 2000–2001 interlaboratory-comparison program.
d Used in the 2000 interlaboratory-comparison program.
e Used in the 2000 blind-audit program.
f Used in the 2001 interlaboratory-comparison program.
g Used in the 2001 blind-audit program.
h pH not certified by the National Institute of Standards and Technology.
i At 25 degrees Celsius and 1 atmosphere pressure (Hem, 1985; Dean, 1979).
Three different sample volumes were distributed for each of the sample matrices. Throughout 2000 and 2001, sample sizes of 250, 500, or 1,000 mL of the USGS solution were sent to operators of selected sites to assess volume-related effects on biases. Larger volumes contact more surface area of the bucket. Larger volume samples also will dilute contaminants more than small volume samples. All NADP/NTN samples are filtered by the CAL, and large volume samples will flush the filters more thoroughly than small volume samples. These effects can be evaluated using the three different sample volumes for the blind-audit samples. Additional information regarding the blind-audit program is available in previous reports (Gordon, 1999; Gordon and others, 1997; See and others, 1990). Figure 7 outlines the components of the blind-audit program, from sample preparation to distribution of interpretive reports.
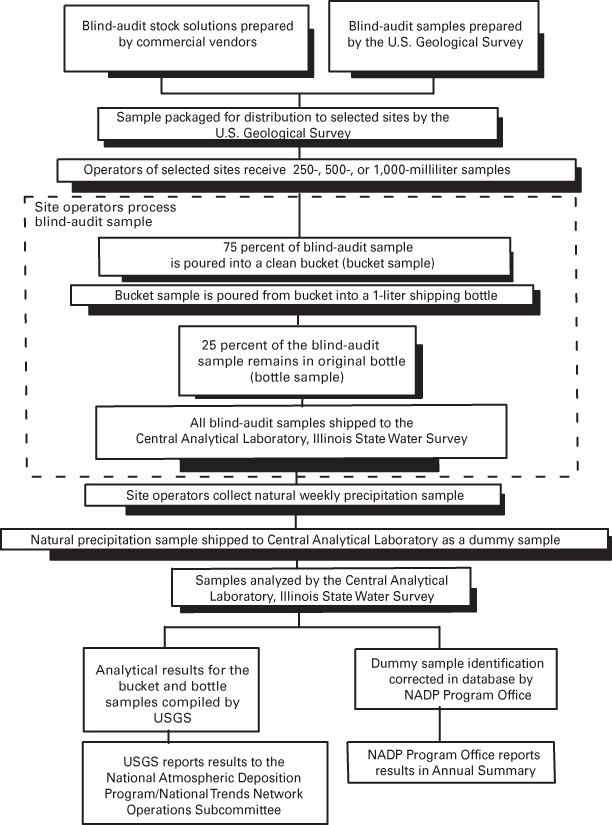
Figure 7. Blind-audit program of the U.S. Geological Survey.
Site operators are provided detailed blind-audit sample-processing instructions. The handling and processing steps of a regular weekly precipitation sample are duplicated as closely as possible. The instructions prescribe that approximately 75 percent of the blind-audit sample be poured into a standard, clean NADP/NTN 13-L polyethylene collection bucket and processed as if it were the wet-deposition sample from the previous week. The blind-audit samples sent to the site operators are marked with a line specifying the quantity to pour into the clean bucket. This poured-out portion of the blind-audit sample is referred to as the bucket sample. The operator determines the weight of the bucket containing 75 percent of the blind-audit sample. After a minimum residence time of 24 hours, the sample is transferred from the bucket into a clean 1-L, high-density polyethylene (HDPE) shipping bottle provided by the CAL. The operator pours a small amount (approximately 20 mL) from the 1-L bottle into clean vials and measures the pH and specific conductance following standard procedures.
The shipping bottle is disguised as a routine wet-deposition sample and submitted by the operator to the CAL for analysis using a fictitious NADP/NTN field-observer report form. The site operator also collects a natural wet-deposition sample during the assigned week for submitting the blind-audit sample. The actual precipitation sample is submitted to the CAL using a "dummy" field-observer report form. The remaining 25 percent of the blind-audit sample, still in the original sample bottle, is returned to the CAL for analysis. This portion of the blind-audit sample is referred to as the bottle sample. In order to keep their identities concealed, the actual precipitation sample and the two portions of the blind-audit sample (bucket and bottle samples) are all shipped separately to the CAL. Gordon and others (1997) describe additional details on the submission of blind-audit samples.
Because of the order in which samples and field-observer report forms are processed, it is difficult for the CAL staff to identify the blind-audit samples as external QA samples. Information concerning sample chemical composition is provided neither to the CAL staff doing the analyses nor to the site operators doing the processing. When the sample is submitted to the CAL, only the sample-processing group (the pH, specific-conductance, and filtering analysts) of the laboratory staff recognizes that it is not an actual NADP/NTN precipitation sample.
The blind-audit program is designed so that the CAL staff receiving and analyzing the actual precipitation sample is not able to easily identify the site from which the sample has been sent. After all the analyses for the bucket and bottle samples from the original blind-audit sample and for the actual precipitation sample are completed, the identity of each of these samples is disclosed to the CAL Data Manager. The NADP/NTN database is then changed by matching the proper analytical data with each sample.
Differences in analyte concentrations between the bucket and bottle samples can result from sample handling and shipping protocols and analytical variability. The differences are analyzed to quantify variability and identify bias. In 2000, complete bucket and bottle analyses were available for 83 of the 101 blind-audit samples sent to participating site operators. In 2001, complete bucket and bottle analyses were available for 83 of the 99 blind-audit samples sent to participating operators.
Paired bucket-minus-bottle differences were calculated to evaluate variability in the blind-audit data. Before determining paired bucket-minus-bottle differences, the bucket and bottle values reported as less than the minimum reporting limit (MRL) were set equal to one-half the MRL. There is evidence that this substitution method is not as defensible as estimation of the distribution of values below the MRL (Helsel, 1990); nonetheless, it is a convenient substitution for purposes of capturing reasonable estimates of bias and variability.
The median paired bucket-minus-bottle concentration differences were consistently close to zero for the major ions during the study period, except for hydrogen ion during 2000. The median bucket-minus-bottle differences for the pooled results from all blind-audit samples for hydrogen ion ranged from –1.32 µeq/L (microequivalents per liter) in 2000 to 0.000 µeq/L in 2001. The interquartile ranges for the paired differences for the major ions during 2000 through 2001 were generally smaller than in 1997–99 (Gordon and others, 2003) and ranged from 0.005 mg/L for magnesium to 0.056 mg/L for sulfate. For sodium, ammonium, chloride, nitrate, and sulfate, the interquartile range decreased by 50 to 70 percent compared to the 1997–99 time period.
Comparison of the median bucket-minus-bottle paired differences to the median concentrations obtained for all of the NADP/NTN weekly precipitation samples collected during the study period provides an assessment of the environmental significance of the error introduced by sample handling and processing (table 5). The median paired differences for the blind-audit results are less than 10 percent of the median of the measured NADP/NTN constituent concentrations except for magnesium, sodium, and chloride. During 2001, the median paired difference for the blind-audit magnesium data was 20 percent of the median magnesium concentration for all NADP/NTN data. Therefore, the data indicate that error introduced by sample handling and processing appears to be environmentally significant to NADP/NTN data users for magnesium, sodium, and chloride, but not for other constituents.
[All units in milligrams per liter except hydrogen ion, in microequivalents per liter, and specific conductance, in microsiemens per centimeter at 25 degrees Celsius; N, number of samples; Q1, the lower quartile in the data distribution; Q3, the upper quartile in the data distribution; interquartile range, the difference between the upper and lower quartiles in the distribution (Q3 minus Q1); --, no data; CAL, Central Analytical Laboratory; MRL, minimum reporting limit; Median NADP/NTN concentration, median value of all National Atmospheric Deposition Program/National Trends Network (NADP/NTN) measured concentrations for respective calendar years (Rothert, 2002, 2003)]
| Analyte | N | Minimum | Median | Quartiles | Maximum | Interquartile range | CAL MRL | Median NADP/NTN concentration | |
|---|---|---|---|---|---|---|---|---|---|
| Q1 | Q3 | ||||||||
| 2000 | |||||||||
| Calcium | 85 | –0.078 | 0.003 | –0.009 | 0.009 | 0.146 | 0.018 | 0.009 | 0.117 |
| Magnesium | 83 | –0.026 | 0.002 | 0.000 | 0.005 | 0.022 | 0.005 | 0.003 | 0.020 |
| Sodium | 84 | –0.148 | 0.005 | 0.000 | 0.012 | 0.042 | 0.012 | 0.003 | 0.047 |
| Potassium | 83 | –0.131 | 0.001 | –0.001 | 0.004 | 0.071 | 0.005 | 0.003 | 0.019 |
| Ammonium | 84 | –0.470 | 0.000 | –0.010 | 0.015 | 0.120 | 0.025 | 0.020 | 0.230 |
| Chloride | 83 | –0.197 | 0.010 | 0.004 | 0.015 | 0.079 | 0.009 | 0.005 | 0.102 |
| Nitrate | 85 | –0.107 | 0.022 | 0.009 | 0.040 | 0.115 | 0.031 | 0.010 | 1.17 |
| Sulfate | 83 | –0.051 | 0.041 | 0.012 | 0.067 | 0.191 | 0.055 | 0.010 | 1.06 |
| Hydrogen ion | 100 | –8.31 | –1.32 | –3.23 | –0.380 | 21.8 | 2.85 | -- | 14.4 |
| Specific conductance | 100 | –3.70 | 0.000 | –0.950 | 0.500 | 5.60 | 1.45 | 0.05 | 13.0 |
| 2001 | |||||||||
| Calcium | 86 | –0.091 | 0.002 | –0.009 | 0.013 | 0.380 | 0.022 | 0.009 | 0.110 |
| Magnesium | 84 | –0.027 | 0.004 | 0.000 | 0.006 | 0.020 | 0.006 | 0.003 | 0.020 |
| Sodium | 85 | –0.033 | 0.004 | –0.001 | 0.010 | 0.070 | 0.011 | 0.003 | 0.048 |
| Potassium | 83 | –0.013 | 0.001 | –0.002 | 0.003 | 0.023 | 0.005 | 0.003 | 0.017 |
| Ammonium | 86 | –0.070 | 0.010 | 0.000 | 0.020 | 0.100 | 0.020 | 0.020 | 0.230 |
| Chloride | 86 | –0.023 | 0.009 | 0.003 | 0.019 | 0.043 | 0.024 | 0.005 | 0.104 |
| Nitrate | 83 | –0.056 | 0.022 | 0.010 | 0.043 | 0.115 | 0.033 | 0.010 | 1.10 |
| Sulfate | 84 | –0.094 | 0.031 | 0.011 | 0.067 | 0.190 | 0.056 | 0.010 | 1.06 |
| Hydrogen ion | 99 | –12.1 | 0.000 | –3.36 | 1.47 | 3.77 | 4.83 | -- | 13.2 |
| Specific conductance | 99 | –3.80 | 0.000 | –1.00 | 0.500 | 1.80 | 1.50 | 0.05 | 12.9 |
Boxplots in figure 8 graphically depict the paired bucket-minus-bottle concentration differences for all the major ions as well as pH and specific conductance. The boxplots show that 50 percent of the concentration differences for each of the major ions are within about +0.05 mg/L. Most of the outlier values are clustered within +0.1 mg/L from the boxplots for all of the major-ion data in figure 8, indicating similar analytical precision for NADP/NTN data during 2000 through 2001. The quartiles of the hydrogen-ion differences indicate that 50 percent of the samples experienced a change in hydrogen-ion concentration of –3.23 to –0.380 µeq/L during 2000 and –3.36 to 1.47 µeq/L during 2001 (table 5), which is smaller than the changes measured for hydrogen-ion concentration during 1997 through 1999 (Gordon and others, 2003). Similarly, the quartiles for specific-conductance differences indicate that 50 percent of the samples experienced a change in specific conductance of about –1.0 to 0.5 µS/cm during the study period (table 5).
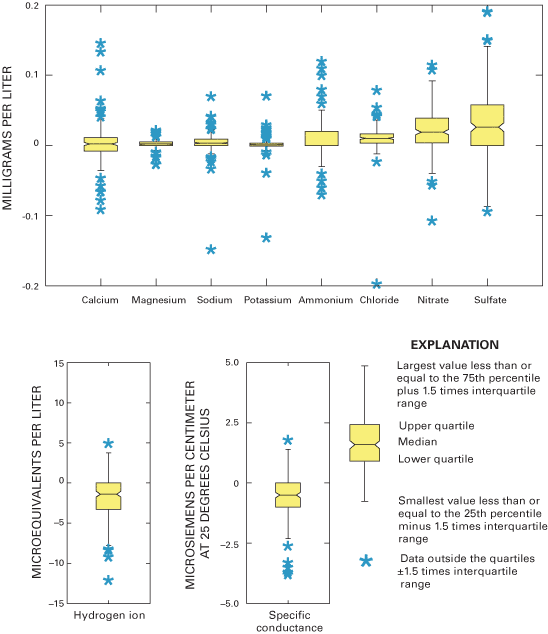
The median paired differences for the major ions are near or less than the CAL's MRLs (table 5). By inference, the effects of sample handling and processing on the NADP/NTN samples are not likely to have a measurable effect on the usability of the NADP/NTN data. Similarly, the paired differences for hydrogen-ion concentration and specific conductance are small compared to spatial and temporal differences observed in the NADP/NTN data (National Atmospheric Deposition Program, 2000, 2001), which implies that sample handling, processing, and shipping have a minimal effect on the quality of NADP/NTN pH and specific-conductance data.
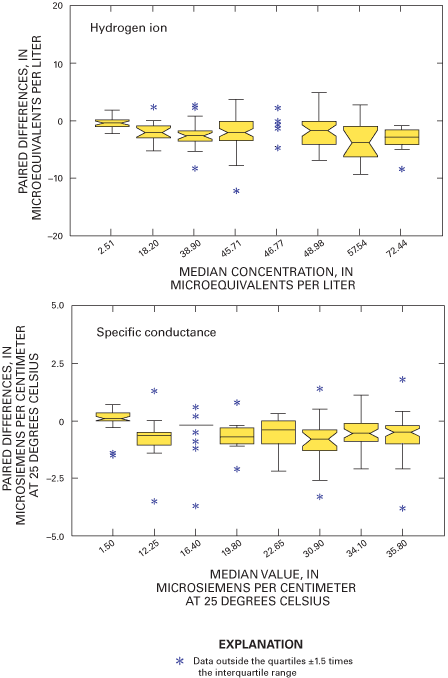
Boxplots in figure 9 depict paired blind-audit differences by sample concentration. The paired blind-audit differences for hydrogen ion and specific conductance, arranged by sample concentration, are shown in figure 10. Figures 9 and 10 illustrate that the data cluster around zero and display non-constant variance. The boxplots show that there is generally higher variance in the magnesium, sulfate, and nitrate concentration differences with increasing constituent concentration compared to other ions. The implication from this analysis is that the larger the concentration in a blind-audit sample, the greater the magnitude of the paired blind-audit sample differences for these analytes. Similar results were obtained for the blind-audit program during 1995–99 (Gordon, 1999; Gordon and others, 2003). By inference, it is expected that the same relation between analyte concentration and variance holds true for weekly NADP/NTN precipitation samples.
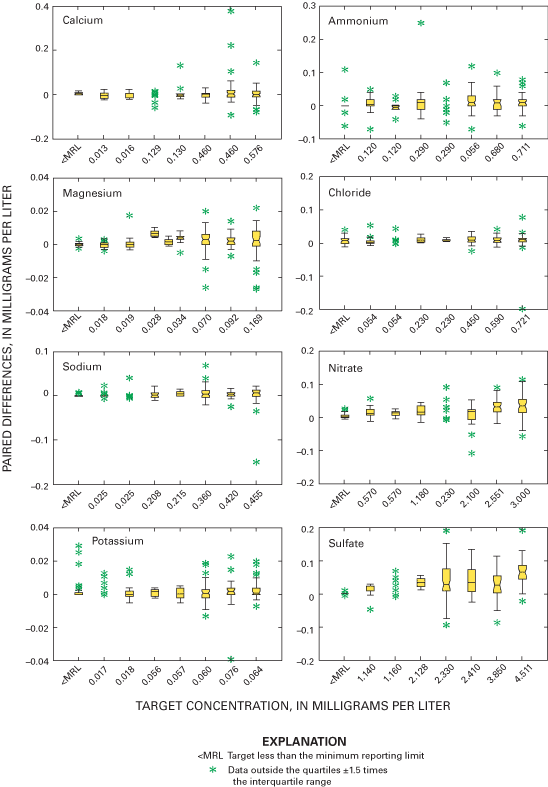
Relative and absolute percent differences were calculated for all of the paired blind-audit samples. The upper and lower quartiles as well as the median relative and absolute percent differences during 2000 through 2001 are listed in table 6. Bucket-bottle data pairs were excluded for a given analyte if the target concentration was less than or equal to the MRL. The percent differences are inflated by the influence of large bucket-bottle differences when the known concentration was less than or equal to the MRL (Nilles and others, 1995).
| Analyte | Relative bucket-minus-bottle differences expressed as a percentage of corresponding target bottle concentration (selected data pairs only) | Absolute bucket-minus-bottle differences expressed as a percentage of corresponding target bottle concentration (selected data pairs only) | |||||
|---|---|---|---|---|---|---|---|
| Calendar year 2000 | |||||||
| Percentiles | Percentiles | ||||||
| 25th | 50th | 75th | 25th | 50th | 75th | ||
| Calcium | –3.0 | 0.57 | 2.3 | 1.3 | 2.8 | 8.5 | |
| Magnesium | 0 | 2.2 | 6.2 | 1.3 | 3.4 | 8.7 | |
| Sodium | 0 | 1.8 | 3.6 | 1.1 | 2.4 | 3.7 | |
| Potassium | –1.2 | 1.2 | 5.9 | 1.2 | 3.6 | 7.4 | |
| Ammonium | –3.2 | 0 | 2.3 | 1.4 | 2.8 | 7.7 | |
| Chloride | 1.1 | 2.2 | 4.0 | 1.2 | 2.2 | 4.0 | |
| Nitrate | 0.59 | 1.2 | 2.0 | 0.73 | 1.3 | 2.1 | |
| Sulfate | 0.56 | 1.2 | 1.9 | 0.69 | 1.2 | 1.9 | |
| Hydrogen ion | –8.8 | –4.5 | –2.1 | 2.3 | 5.5 | 9.0 | |
| Specific conductance | –4.1 | –2.4 | –0.7 | 1.4 | 2.6 | 4.2 | |
| Calendar year 2001 | |||||||
| Percentiles | Percentiles | ||||||
| 25th | 50th | 75th | 25th | 50th | 75th | ||
| Calcium | –3.5 | 0.22 | 4.6 | 2.2 | 3.8 | 11 | |
| Magnesium | 0 | 5.9 | 11 | 4.3 | 8.6 | 13 | |
| Sodium | –0.48 | 1.7 | 4.1 | 1.4 | 2.6 | 5.3 | |
| Potassium | –3.3 | 2.6 | 5.8 | 3.3 | 5.0 | 8.8 | |
| Ammonium | 0 | 2.9 | 5.4 | 1.8 | 3.4 | 5.9 | |
| Chloride | 0.89 | 2.2 | 4.8 | 1.3 | 2.8 | 4.9 | |
| Nitrate | 0.53 | 1.2 | 1.9 | 0.71 | 1.4 | 1.9 | |
| Sulfate | 0.47 | 1.4 | 2.7 | 0.99 | 1.5 | 3.0 | |
| Hydrogen ion | –11 | –6.4 | 0 | 2.4 | 6.5 | 11 | |
| Specific conductance | –4.5 | –1.9 | –0.55 | 0.88 | 2.6 | 4.5 | |
A Wilcoxon signed-rank test was used to test for bias within the two groups of blind-audit samples for each calendar year. The null hypothesis for the test was: "The median of the blind-audit paired differences is zero." The Wilcoxon signed-rank test results identified statistically significant (α=0.05) differences for sulfate in 2000 but not in 2001. The median difference for sulfate during 2000 was 0.041 mg/L (table 5), which is less than 4 percent of the median sulfate concentration of 1.063 mg/L for all NADP/NTN data (Rothert, 2002). Therefore, the sulfate bias is not environmentally significant (that is, it is not large enough to be important to a chemist or hydrologist evaluating the NTN data). However, the statistically significant difference is an indication of bias in the 2000 blind-audit program data for sulfate, which has not been observed in the blind-audit data since 1994 (Gordon and others, 1997).
During 2000, the median (50th percentile) relative percent difference, defined herein as the median percent bias, was within the range of –4.5 to 2.2 percent for all analytes, which was smaller than the range during 1997 through 1999 (Gordon and others, 2003). The range of percent bias increased in 2001 to –6.4 to +5.9 percent, representing an approximate +2-percent increase in median bias over the 1997–99 range. The largest median bias was obtained for hydrogen ion, ranging from –6.4 to –4.5 percent for 2001 and 2000, respectively. The median bias values for calcium, sodium, potassium, ammonium, chloride, nitrate, and sulfate are between 0 and 2.9 percent for the study period, indicating minor positive bias for most ions (table 6).
Three sample volumes were used in the blind-audit program to investigate a possible relation between sample volume collected weekly at NADP/NTN sites and the amount of contamination introduced through handling, processing, and shipping procedures. Differences between paired bucket and bottle samples were analyzed in their original concentration units and in units of mass. Boxplots in figures 11 and 12 depict the distributions of the differences for each analyte plotted by sample volume. The boxplots are evaluated for trends in bias with increasing sample volume by inspection for overlap of the interquartile ranges and relative position of the median values. A positive trend in the relation of median paired differences and increasing sample volume can identify potential contamination of the precipitation samples that is leached or otherwise introduced into the sample when a larger portion of the bucket walls are in contact with the sample. Conversely, a negative trend can identify leaching of contamination into the sample, which is diluted with increasing sample volume or loss of constituents to the container walls or other chemical reactions.
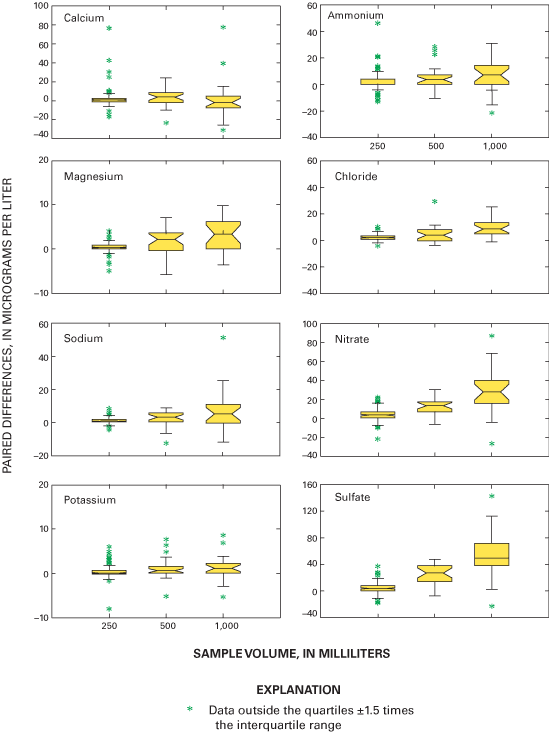
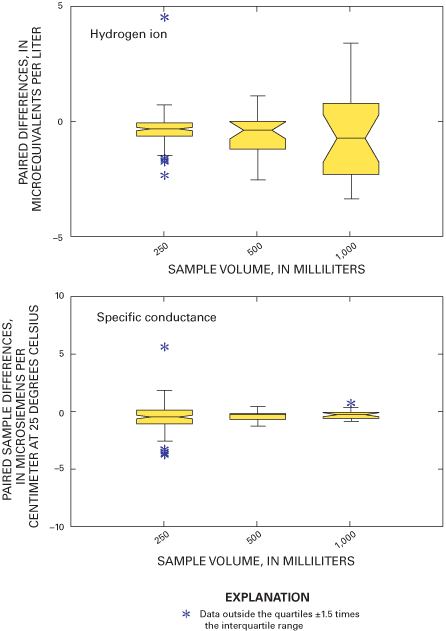
As a followup to inspection of the boxplots, a Kruskal-Wallis test was performed to determine if there are statistically significant relations between paired blind-audit differences and sample volume. The null hypothesis for the test is: "There is no relation between paired blind-audit concentration or mass differences and sample volume." An equal number of samples containing 250, 500, or 1,000 mL of solution was included in each quarterly mailing of samples throughout the study period. The Kruskal-Wallis analysis of variance results indicates a significant (α=0.05) relation between paired blind-audit sample differences, in units of concentration, and sample volume for calcium and sulfate during 2000, and for magnesium, nitrate, and sulfate during 2001 (table 7). When paired differences were converted to units of mass, the outcome of the Kruskal-Wallis test was different: statistically significant (α=0.05) differences during 2000 between the bucket and bottle pairs were found for calcium, sodium, potassium, chloride, nitrate, and sulfate, and differences during 2001 between the bucket and bottle pairs were found for magnesium, potassium, chloride, nitrate, sulfate, and specific conductance. The statistically significant differences determined between sample volumes are indicative of potential adverse effects on the samples due to sample handling, processing, and shipping.
[mL, milliliter; <, less than; USGS, U.S. Geological Survey; Null hypothesis: There is no relation between paired blind-audit concentration or mass differences and sample volume, rejected if p-value is less than 0.05]
| Analyte | Bucket-minus-bottle concentrations attained significance (p-value) levels on a concentration basis | Statistically significant (α=0.05) differences determined between 250-, 500-, and 1,000-mL USGS samples on a concentration basis | Bucket-minus-bottle concentrations attained significance (p-value) levels on a mass per bucket basis | Statistically significant (α=0.05) differences determined between 250-, 500-, and 1,000-mL USGS samples on a mass per bucket basis |
|---|---|---|---|---|
| Calendar year 2000 | ||||
| Calcium | 0.0200 | Yes | 0.0070 | Yes |
| Magnesium | 0.9480 | No | 0.4460 | No |
| Sodium | 0.5900 | No | 0.0030 | Yes |
| Potassium | 0.0810 | No | 0.0180 | Yes |
| Ammonium | 0.3500 | No | 0.1400 | No |
| Chloride | 0.8310 | No | 0.0010 | Yes |
| Nitrate | 0.3040 | No | 0.0000 | Yes |
| Sulfate | 0.0010 | Yes | <0.0001 | Yes |
| Hydrogen ion | 0.5540 | No | 0.1310 | No |
| Specific conductance | 0.3050 | No | 0.2810 | No |
| Calendar year 2001 | ||||
| Calcium | 0.9362 | No | 0.9104 | No |
| Magnesium | 0.0285 | Yes | 0.0011 | Yes |
| Sodium | 0.2507 | No | 0.0625 | No |
| Potassium | 0.4594 | No | 0.0287 | Yes |
| Ammonium | 0.9222 | No | 0.1531 | No |
| Chloride | 0.6672 | No | 0.0079 | Yes |
| Nitrate | 0.0160 | Yes | <0.0001 | Yes |
| Sulfate | 0.0002 | Yes | <0.0001 | Yes |
| Hydrogen ion | 0.1610 | No | 0.7003 | No |
| Specific conductance | 0.7191 | No | 0.0383 | Yes |
The statistically significant differences identified by the analysis of variance results (table 7) are consistent with the characteristics of the boxplots of paired differences in figure 11. The boxplots in figure 11 show that the paired differences are generally centered on the zero difference line for calcium. However, the paired differences for sodium, magnesium, potassium, ammonium, chloride, nitrate, and sulfate tend to become more positive with increasing sample volume, which is similar to trends in the blind-audit sample data observed before the 1994 sampling protocol changes (Nilles and others, 1993). The interquartile ranges, represented by the upper and lower boundaries of the boxes, overlap for all constituents except sulfate. The boxplots also are larger for larger volumes, indicating increasing variability in the paired differences with increasing sample volume. The increase in variability might be due to more thorough washing of the buckets with larger volume samples. When the samples are filtered at the CAL, the larger volume samples flush the filters more than small volume samples, which could contribute to increased variability with increasing sample volume.
The results indicate possible introduction of low-level sulfate contamination from sample handling, processing, and shipping. However, as stated earlier, the effects of sample handling, processing, and shipping do not appear to be environmentally significant and do not affect the analysis and interpretation of the NADP/NTN data. Therefore, no corrections to NADP/NTN data are implied by analysis of the blind-audit sample differences with respect to sample volume.
The field-audit program is intended to help quantify chemical changes to precipitation samples resulting from normal field exposure of the sample-collection apparatus. Estimates of variability and bias from the field-audit program data are assumed to represent the combined effects of field exposure of the sample plus sample handling, processing, and shipping. Every Tuesday morning at all sites across the network, the sample from the previous week is removed and a new sample-collection bucket is installed in the Aerochem Metrics wet-deposition collector. The bucket is covered with a foam pad attached to a rigid aluminum lid. The site operators' standard operating procedures (SOPs) specify monthly cleaning of the lids and lid replacement every 12 months. Nonetheless, when precipitation is not occurring, small amounts of contamination can enter the bucket between the lid and the bucket. For example, small amounts of windblown dust can enter the bucket, particularly when the foam lid pad has started to wear and the seal between the bucket and lid is compromised. Small amounts of dust or debris can fall into the bucket when the lid is in motion. The net effect of these influences can change the chemistry of the precipitation sample.
Like the blind-audit program, the field-audit program uses a paired sample design to detect statistically significant differences in analyte concentrations for solutions that come in contact with collector buckets and solutions that are not exposed to collector buckets. But unlike the blind-audit program, the field audit measures the added effects of field exposure of the buckets. The blind-audit program uses clean buckets from the site operators' stock, but the field-audit program uses buckets that have been installed in a collector for 1 week without precipitation. Field-audit samples are distributed to 25 NADP/NTN sites quarterly. Tables 3 and 4 list the solutions used for the field-audit program. Figure 13 outlines the components of the field-audit program.
Figure 13. Field-audit program of the U.S. Geological Survey.
The site operators are furnished special instructions to guide them in the collection of field-audit data. A number of prerequisite conditions must be met before proceeding with field-audit sample preparation. In the field-audit program, the site operator is instructed to process and submit a QC sample after a standard 7-day, Tuesday-to-Tuesday sampling period where no precipitation occurred. The site operator checks the rain-gage chart to make sure the AeroChem Metrics collector lid did not open and uncover the wet-side bucket more than once during the sampling period (Dossett and Bowersox, 1999).
If all of the requirements are met for processing a field-audit sample, the operator pours approximately 75 percent of the field-audit solution, supplied by the USGS, into the bucket. The operator swirls the solution in the bucket and then seals the bucket with its lid. The solution is left in the sealed bucket for at least 24 hours, and then the solution is transferred to a clean 1-L sample bottle for shipment to the CAL. This sample is processed by the CAL as if it were an actual precipitation sample from the site. The 25-percent portion of the sample remaining in the original sample container is shipped to the CAL for separate analysis.
Unlike the blind-audit program, field-audit samples are not disguised as environmental samples, but the laboratory does not know the chemical composition of the samples. Because there is no prespecified sample submission date, the site operator contacts the NADP/NTN site liaison in the NADP Program Office immediately after the sample is submitted. The site operator fills out postcards notifying the USGS and the Program Office that the sample was submitted. The site operator also notes that the sample is a QA sample on the field form that is sent to the CAL with each NADP/NTN sample. This notification process helps ensure that the data are correctly coded in the database.
A 3-by-3 sample design (Berthouex and Brown, 1995) was chosen for the field-audit program to investigate a possible relation between sample volume collected weekly at NADP/NTN sites and the amount of contamination introduced through field exposure and shipping and handling procedures. The sample design uses an equal number of samples with three different sample volumes: 250, 500, and 1,000 mL, and three different matrices, including ultrapure deionized water, solution SP–2, and solution SP–3 (table 4), which were distributed to 25 sites per quarter. Differences between bucket and bottle sample pairs were analyzed in their original concentration units and in units of mass. The null hypothesis for nonparametric analysis of variance testing is: "There is no difference relation between the paired bucket-minus-bottle concentration differences and sample volume."
Samples submitted as part of the field-audit program are referred to as field-audit samples. Fifty-nine of the 100 field-audit samples, mailed in 2000, were submitted for analysis by the end of 2001. Seventy of the 100 field-audit samples, mailed in 2001, were submitted for analysis by the end of 2002. Overall, there were 129 complete sample pairs for the study period.
If the site is located in an area with a wet climate and extremely high humidity, the probability of a week with no lid openings is very low. Therefore, some of the field-audit samples that are shipped to wet or humid regions are not processed because some of the samplers in these regions record precipitation every week during the field-audit sample-collection period. The site operator has one full year from when their original quarter ends to meet the conditions specified by the program and submit their field-audit sample.
Before determining paired bucket-minus-bottle differences for the field-audit program, bucket and bottle values reported as less than the MRL were set equal to one-half the MRL. This is a convenient substitution for purposes of capturing reasonable estimates of bias and variability. Setting the "less than MRL" data to zero or the MRL did not appreciably affect the results of the analysis compare to setting to one-half the MRL. Only minor differences result from how the "less than MRL" values are handled. Therefore, all of the "less than MRL" values were set equal to one-half the MRL for the analysis of field-audit program data.
A site operator inspects the wet-side bucket to ensure that it is at least as dry as it was when it was installed the previous week: if there were a few drops of rinse water in the bucket when it was installed, it is conceivable that the water is still present. A bucket is considered "wet" if there was CAL rinse water in the bucket when the bucket was installed and if the rinse water remains at the end of the week during which there were no lid openings. A bucket is considered "dry" if no rinse or rainwater is present. Regardless of sample chemistry, bucket and bottle field-audit samples containing extrinsic material are assigned a "C" code by the CAL.
Fifteen of the 129 field-audit samples were assigned "C" codes during the study period. Because field-audit samples can be put either into a dry bucket or a bucket with rinse water present, the data were initially divided into separate files depending on whether the sample data were coded as "wet" or "dry." Including the 15 C-coded samples, 129 field-audit samples were analyzed during the study period. Of the 129 samples analyzed, 8 were processed with rinse water present as "wet" buckets, and 121 were processed as "dry" buckets.
The Wilcoxon signed-rank test was used to compare the ion concentrations and specific conductance of the two groups of field-audit samples (C-coded samples and samples without C codes). For all constituents, no statistically significant differences were found at the α=0.05 level during the study period for any of the analytes. Therefore, data from the 15 field-audit samples assigned C codes during the study period were included in the overall statistical analysis of field-audit samples.
The Wilcoxon signed-rank test also was used to evaluate if there were statistically significant differences in the field-audit results based on the presence or absence of rinse water in the sample-collection bucket. No statistically significant differences were indicated between the paired analyses for any of the analytes for either the "wet"- or "dry"-coded samples. A statistical summary of paired bucket-minus-bottle results for the "wet" and "dry" field-audit samples is shown in table 8. In most cases, the medians of the differences between bucket and bottle samples are very similar for the "wet"-coded samples where rinse water was present and the "dry"-coded samples where rinse water was absent. The differences are small, and the quartile ranges and medians also are quite similar for the "wet" and "dry" sample groups.
[All units in milligrams per liter except hydrogen ion, in microequivalents per liter, and specific conductance, in microsiemens per centimeter at 25 degrees Celsius; Q1, the lower quartile in the data distribution; Q3, the upper quartile in the data distribution]
| Analyte | "Wet" samples | "Dry" samples | |||||
|---|---|---|---|---|---|---|---|
| Median | Quartiles | Median | Quartiles | ||||
| Q1 | Q3 | Q1 | Q3 | ||||
| Calcium | 0.005 | 0.001 | 0.012 | 0.007 | 0.002 | 0.013 | |
| Magnesium | 0.001 | 0.000 | 0.001 | 0.001 | 0.000 | 0.002 | |
| Sodium | 0.004 | 0.002 | 0.005 | 0.002 | 0.001 | 0.005 | |
| Potassium | 0.002 | 0.000 | 0.005 | 0.001 | –0.001 | 0.002 | |
| Ammonium | 0.000 | –0.005 | 0.010 | 0.000 | –0.010 | 0.010 | |
| Chloride | 0.011 | 0.005 | 0.019 | 0.011 | 0.003 | 0.018 | |
| Nitrate | 0.003 | 0.000 | 0.024 | 0.015 | 0.000 | 0.029 | |
| Sulfate | 0.010 | 0.000 | 0.068 | 0.000 | –0.002 | 0.016 | |
| Hydrogen ion | –0.207 | –0.955 | 0.073 | –0.672 | –1.61 | 0.000 | |
| Specific conductance | 0.150 | –0.300 | 0.650 | –0.100 | –0.500 | 0.200 | |
The bucket-minus-bottle paired differences obtained for the "dry"-coded field-audit data (table 8) are less than 10 percent of the median concentrations determined for all NADP/NTN concentration measurements made during the study period (table 5) except for chloride. Therefore, the paired differences indicate that the errors in the concentration measurements, which are introduced by exposure of the sample to field conditions, sample handling, and laboratory processing, are not environmentally significant to NADP/NTN data users.
The interquartile ranges of the field-audit hydrogen-ion concentration differences indicate that 50 percent of the samples experienced a change in hydrogen-ion concentration of between –0.955 and 0.073 µeq/L for "wet"-coded samples and between –1.61 and 0.000 µeq/L for "dry"-coded samples (table 8). The interquartile ranges for hydrogen-ion concentration differences for "wet" and "dry" samples were slightly smaller for the study period than for 1997–99 (Gordon and others, 2003). The interquartile ranges shown in table 8 represent small percentages of the hydrogen-ion concentration present in the reference samples used in the field-audit program. By inference, the field-audit program data for the study period indicate that exposure of NADP wet-deposition samples to field conditions generally tends to neutralize the acidity of the sample, but only by less than 1 µeq/L, as indicated by the median bucket-minus-bottle differences in table 8.
Boxplots in figure 14 graphically depict the paired bucket-minus-bottle concentration differences for all the major ions, as well as hydrogen ion and specific conductance for the field-audit program. The upper and lower lines defining the "box" portions of the boxplots depict the interquartile range of the differences for each analyte. The "whisker" portions of the boxplots are defined by the largest value within +1.5 times the interquartile range extending from either the top or bottom of the "box" portion. Asterisks plotted for values outside the whiskers are called "outside" values. In a normal distribution, there should be one outside value for every 100 data points. The occurrence of more outside values than expected is an indication that the data are not normally distributed. Figure 14 shows that the median differences for all major-ion concentrations have a positive sign and are near zero, indicating that field exposure of the bucket appears to slightly increase the concentration of most of the analytes, but the increase in major-ion concentration is typically less than 5 µg/L. These differences are less than 10 percent of the NADP/NTN median values for 2000 and 2001 data. Therefore, the differences are not likely to be environmentally significant to NADP data users for analysis of spatial or temporal trends.
Figure 15 depicts the distributions of paired field-audit sample differences by concentration. Figure 15 shows that the median paired difference increases with increasing target concentration for magnesium, sodium, nitrate, and sulfate, but there is considerable overlap of the interquartile ranges of the paired differences for each constituent over the range of target concentrations. Variability in the paired concentration differences is consistent across the range of target concentrations for each constituent except nitrate and sulfate. The paired field-audit differences for hydrogen ion and specific conductance, arranged by sample concentration or value, are shown in figure 16. The median paired differences for hydrogen ion and specific conductance decrease slightly with increasing concentration and specific conductance. However, figure 16 shows that there is overlap of the interquartile ranges of the differences for each hydrogen-ion concentration or specific-conductance target value. The specific-conductance differences appear to have consistent variance among the target values.
Results of a Kruskal-Wallis analysis of variance test indicate a statistically significant (α=0.05) relation between the constituent target concentrations and specific conductance and the magnitude of paired field-audit differences for ammonium, chloride, and sulfate concentration and specific conductance during the entire (2000–2001) study period and for magnesium and nitrate in 2001 alone. The Kruskal-Wallis analysis of variance results combined with the boxplots of the paired differences in figures 15 and 16 indicate that the field exposure and sample handling, processing, and shipping caused less than a +10-µg/L change to nitrate and sulfate concentrations and a less than –1-µS/cm change to specific conductance.
The number of ultrapure deionized-water samples processed and analyzed as part of the field-audit program was 22 in 2000 and 23 in 2001 (table 9). The most common analyte detected above the MRL during 2000 in the ultrapure deionized-water samples was calcium, which was detected in 82 percent of the field-exposed bucket samples and in 5 percent of the minimally handled bottle samples. During 2001, calcium was detected in 65 percent of the field-exposed bucket samples and in 17 percent of the minimally handled bottle samples (table 9). Chloride was the second-most detected constituent in the field-exposed bucket samples. Chloride was detected in 59 percent of the field-exposed bucket samples in 2000 and in 78 percent of the samples in 2001 compared to 0 and 13 percent, respectively, for the minimally handled bottle samples. More than 40 percent of the field-exposed bucket samples contained detectable nitrate during 2000 and 2001. There were more detections of all major-ion constituents in the field-exposed bucket samples than in the minimally handled bottle samples.
[MRL, minimum reporting limit obtained from the Central Analytical Laboratory (Rothert, 2002); mg/L, milligrams per liter]
| Analyte | Field-exposed bucket sample | Minimally handled bottle sample | MRL (mg/L) | |||
|---|---|---|---|---|---|---|
| Number of determinations | Percent of total | Number of determinations | Percent of total | |||
| 2000 | ||||||
| Calcium | 18 | 82 | 1 | 5 | 0.009 | |
| Magnesium | 4 | 18 | 0 | 0 | 0.003 | |
| Sodium | 8 | 36 | 0 | 0 | 0.003 | |
| Potassium | 6 | 27 | 0 | 0 | 0.003 | |
| Ammonium | 0 | 0 | 1 | 5 | 0.02 | |
| Chloride | 13 | 59 | 0 | 0 | 0.005 | |
| Nitrate | 9 | 41 | 0 | 0 | 0.010 | |
| Sulfate | 2 | 9 | 0 | 0 | 0.010 | |
| 2001 | ||||||
| Calcium | 15 | 65 | 4 | 17 | 0.009 | |
| Magnesium | 4 | 17 | 1 | 4 | 0.003 | |
| Sodium | 4 | 17 | 2 | 9 | 0.003 | |
| Potassium | 6 | 26 | 2 | 9 | 0.003 | |
| Ammonium | 2 | 9 | 1 | 4 | 0.02 | |
| Chloride | 18 | 78 | 3 | 13 | 0.005 | |
| Nitrate | 10 | 43 | 1 | 4 | 0.010 | |
| Sulfate | 6 | 26 | 1 | 4 | 0.010 | |
Gordon and others (2003) discuss a high incidence of sodium detection in the ultrapure samples during 1997–99, primarily due to filter contamination at the CAL. The CAL used problematic filters to process samples until November 1997. Sodium detection in ultrapure deionized-water bucket samples was limited to about 36 percent of the samples in 2000 and 17 percent of the samples in 2001, which represents far fewer sodium detections in the ultrapure deionized-water samples during 2000–2001 than during 1997–99. Of the minimally handled bottle samples of ultrapure deionized water, 2 detections above the MRLs were obtained in 2000, whereas 15 detections above the MRLs were obtained in 2001 (table 9).
Relative and absolute percent differences were calculated for all of the paired field-audit samples per the following equations:
Relative percent difference (bias)
= [(C1–C2)/C3] • 100 (6)
and
Absolute percent difference
= |(C1–C2)/C3| • 100 (7)
where
| C1 | = sample concentration, in milligrams per liter, from the portion of the field-audit sample that contacted the field-exposed bucket and underwent all of the handling and processing steps of a normal weekly precipitation sample; | |
| C2 | = sample concentration, in milligrams per liter, from the control portion of the field-audit sample subject to minimal handling and processing; | |
| and | ||
| C3 | = target concentration of the field-audit sample, in milligrams per liter. |
The upper and lower quartiles and the median (50th percentile) relative and absolute percent differences for the 2000–2001 field-audit data are listed in table 10. The median and quartile values for the relative percent differences (also known as "median percent bias") and absolute percent differences were determined for each constituent.
| Analyte | Relative bucket-minus-bottle differences, expressed as a percentage of corresponding target bottle concentration or value | Absolute bucket-minus-bottle differences, expressed as a percentage of corresponding target bottle concentration or value | |||||
|---|---|---|---|---|---|---|---|
| Percentiles | Percentiles | ||||||
| 25th | 50th | 75th | 25th | 50th | 75th | ||
| Calcium | 0.65 | 2.6 | 8.2 | 1.3 | 3.1 | 8.2 | |
| Magnesium | 0.00 | 2.9 | 6.1 | 1.4 | 4.1 | 6.1 | |
| Sodium | 0.00 | 1.3 | 2.7 | 0.6 | 1.4 | 2.7 | |
| Potassium | –1.7 | 1.7 | 12. | 1.7 | 4.4 | 19. | |
| Ammonium | –3.6 | 0.00 | 0.00 | 0.00 | 0.00 | 7.1 | |
| Chloride | 1.8 | 4.0 | 6.5 | 1.8 | 4.0 | 6.5 | |
| Nitrate | 0.35 | 0.93 | 1.9 | 0.48 | 1.1 | 2. | |
| Sulfate | –0.21 | 0.52 | 1.5 | 0.40 | 1.0 | 1.7 | |
| Hydrogen ion | –9.2 | –4.0 | 0.00 | 2.3 | 6.1 | 11. | |
| Specific conductance | –3.6 | –1.2 | 2.0 | 1.6 | 3.5 | 8.3 | |
During the study period, the median percent bias for all analytes was within a range of –4 to +6.1 (hydrogen ion) (table 10), which compares well with the range of –5 (hydrogen ion) to +6 (chloride) median percent bias for the 1997–99 field-audit data (Gordon and others, 2003). A minor positive bias was measured for the bucket samples for all analytes except for hydrogen ion and specific conductance during the study period. At first, these results appear counterintuitive because addition of ions should increase the conductivity of the solution. However, conductivity measurements are not as sensitive as the chemical concentration measurements, especially for low-ionic-strength solutions.
The MAE were lower for the field-audit data obtained during the study period than during 1997–99 (Gordon and others, 2003) for calcium, sodium, potassium, ammonium, chloride, sulfate, and hydrogen ion. The 2000–2001 MAE values were higher than the 1997–99 values for magnesium and nitrate. The analyte with the largest MAE for the field-audit program during the study period was hydrogen ion (about 6 percent) (table 10). Hydrogen ion also had the largest MAE (about 4.5–6.5 percent) in the blind-audit program.
To determine if there was a statistically significant relation between paired field-audit differences and sample volume, a Kruskal-Wallis analysis of variance test was performed. The Kruskal-Wallis analysis of variance results for the study period indicate a significant (α=0.05) relation between paired field-audit sample concentration or value differences and sample volume for magnesium, chloride, nitrate, sulfate, and specific conductance. These results are similar to those obtained for the 1997–99 field-audit data (Gordon and others, 2003). These results also are similar to those obtained for the blind-audit program during 2001. Boxplots in figures 17 and 18 depict the differences for each analyte compared to sample volume. When paired differences for major ions were converted to units of mass by multiplying the concentration by the sample volume, the outcome of the Kruskal-Wallis analysis of variance indicated a significant (α=0.05) difference for only chloride and sulfate during the study period.
In general, the boxplots of the paired differences taken in combination with the results of the Kruskal-Wallis analysis of variance show that minor amounts of contaminant material are entrained into the solutions from the field-exposed buckets. The data also show some loss of constituents by virtue of the negative values for the bucket-minus-bottle concentration differences. It is unclear how much of the apparent loss is due to adsorption to the buckets, other chemical reactions, or simply analytical variability. Constituents that appear to be introduced to the precipitation samples by field exposure of the sample buckets are calcium, magnesium, chloride, nitrate, and sulfate. The positive bias that results from the minor amount of contamination appears to affect the chemical results by as much as +8 percent, which is the 75th-percentile relative percent difference shown for calcium in table 10. Hydrogen-ion loss due to field exposure and sample processing also appears to impart a bias of about –4 percent, as indicated by the median relative percent bias shown in table 10.
Like all environmental data, a portion of the variability in the field-audit data is introduced by the analytical laboratory. A study of laboratory variability for different sample volumes without any exposure to the sample-collection equipment or field conditions has not been done. Therefore, it is unknown whether the differences obtained for the different sample volumes are partially due to laboratory variability or not. For this report, it is assumed that the data are representative of the combined variability of sample field exposure and laboratory analysis.
The two objectives of the interlaboratory-comparison program are (1) to estimate the analytical variability and bias of participating laboratories, and (2) to help facilitate integration of data from various monitoring networks—not accounting for the different field protocols used by different monitoring networks. Seven laboratories participated in the interlaboratory-comparison program during the study period. Each of the seven participating laboratories received four samples from the USGS every 2 weeks for chemical analysis. The samples are synthetic precipitation solutions, ultrapure deionized water, or natural precipitation. The laboratories submitted chemical-analysis data to the USGS for analysis and reporting. The data are compared against target values and evaluated for statistical control using control charts. The control charts and other data summaries are posted on the Internet for each laboratory's use. A flowchart of the interlaboratory-comparison program is shown in figure 19.
Figure 19. Interlaboratory-comparison program of the U.S. Geological Survey.
The following laboratories participated in the interlaboratory-comparison program during 2000 through 2001: (1) Illinois State Water Survey, Central Analytical Laboratory (CAL) in Champaign, Ill.; (2) Meteorological Services of Canada (MSC) in Downsview, Ontario, Canada; (3) Environmental Science and Engineering, Inc. (ESE, renamed MACTEC in 2002) in Gainesville, Fla.; (4) Ontario Ministry of the Environment, Dorset Research Facility (MOE) in Dorset, Ontario, Canada; (5) Shepard Analytical Services (SA) in Simi Valley, Calif.; (6) Norwegian Institute for Air Research (NILU) in Kjeller, Norway; and (7) Acid Deposition and Oxidant Research Center (ADORC) in Niigata-shi, Japan. All of the major global atmospheric-deposition monitoring networks are united into this single program designed to measure laboratory data quality, which aids in data comparison between monitoring networks worldwide, provided that the effects of field protocols are accounted for.
Many of the samples used in the interlaboratory-comparison program are made from stock solutions prepared by High Purity Standards, Inc., Charleston, S.C. (HPS), which are diluted, bottled, labeled, and shipped by the USGS to the participating laboratories biweekly. Each laboratory receives four samples per shipment. Three sources of samples were used in the interlaboratory-comparison program during 2000 through 2001: (1) natural wet-deposition samples collected at NADP/NTN sites and blended by the CAL, which are sent to the USGS for bottling and shipping to the interlaboratory-comparison laboratories; (2) synthetic precipitation standard reference samples prepared by HPS and diluted and bottled by the USGS; and (3) ultrapure deionized-water samples prepared by the USGS. Table 3 contains information on the preparation of the solutions made either by HPS, USGS, or the CAL, as well as the names of solutions prepared from NIST reference materials (NIST-traceable samples). The median of all of the concentration values obtained from the seven laboratories are considered to be the MPVs for solutions used in the interlaboratory-comparison program. The MPVs are listed in table 11.
[Target, or most probable, values are the theoretical concentrations based on dilution of stock solutions with certified concentrations; pH, in units; specific conductance, in microsiemens per centimeter at 25 degrees Celsius; Ca2+, calcium; Mg2+, magnesium; Na+, sodium; K+, potassium; NH4+, ammonium; Cl–, chloride; NO3–, nitrate; SO42–, sulfate]
| Solution | Ca2+ | Mg2+ | Na+ | K+ | NH4+ | Cl– | NO3– | SO42– | pH | Specific conductance |
|---|---|---|---|---|---|---|---|---|---|---|
| SP–1a | 0.443 | 0.097 | 0.414 | 0.075 | 0.680 | 0.586 | 2.07 | 3.81 | 4.54 | 38.0 |
| SP–2a | 0.450 | 0.074 | 0.356 | 0.060 | 0.550 | 0.442 | 2.97 | 2.32 | 4.64 | 30.2 |
| SP–5a | 0.552 | 0.177 | 0.442 | 0.080 | 0.707 | 0.710 | 2.53 | 4.50 | 4.47 | 45.9 |
| SP–97b | 0.122 | 0.018 | 0.025 | 0.023 | 0.280 | 0.052 | 1.17 | 1.13 | 4.95 | 17.0 |
| SP–97bc | 0.120 | 0.025 | 0.024 | 0.015 | 0.286 | 0.051 | 1.81 | 1.19 | 4.82 | 27.5 |
| SP–98bc | 0.010 | 0.039 | 0.261 | 0.052 | 0.117 | 0.230 | 0.58 | 2.17 | 4.75 | 34.7 |
| SP–98cb | 0.017 | 0.035 | 0.209 | 0.057 | 0.110 | 0.230 | 0.56 | 2.40 | 4.69 | 39.8 |
a Used in the 2000–2001 interlaboratory-comparison program.
b Used in the 2001 interlaboratory-comparison program.
c Used in the 2000 interlaboratory-comparison program.
In 2000, each participating laboratory was sent 104 samples. Of the 104 samples, 52 were aliquots of natural wet deposition bottled by the CAL. Of the remaining samples, 44 were synthetic precipitation solutions made by HPS and diluted by the USGS, which were referred to as: "SP–1 solution" (9 samples), "SP–2 solution" (9 samples), "SP–5 solution" (9 samples), SP–97b solution" (9 samples), and "SP–98b solution" (8 samples). Eight samples were ultrapure deionized-water samples bottled by the USGS.
In 2001, each laboratory was once again sent 104 samples to analyze. The CAL analyzed 103 of the samples, and NILU analyzed 100 of the samples. All other laboratories analyzed all 104 samples. Of the 104 samples, 52 were aliquots of natural wet deposition bottled by the CAL. Of the remaining samples, 44 were synthetic samples made by HPS and diluted by the USGS and referred to as: "SP–1 solution" (9 samples), "SP–2 solution" (9 samples), "SP–5 solution" (9 samples), "SP–97 solution" (9 samples), and "SP–98c solution" (8 samples). Eight samples were ultrapure deionized-water samples bottled by the USGS.
Natural wet-deposition samples collected at NADP/NTN sites with sufficient excess volume (samples in excess of 750 mL) were selected randomly by the CAL for use in the interlaboratory-comparison program and split into 10 aliquots. Aliquots from the split sample were bottled in 125-mL polyethylene bottles and shipped in chilled, insulated containers to the USGS in Denver, Colo. The USGS keeps these natural samples refrigerated and ships the samples on ice to participating laboratories within a few weeks of receiving them. The natural samples were not preserved, and a maximum sample hold time was not specified for the nutrient constituents in these samples. Nitrogen and sulfate may be used by bacteria as nutrients or electron acceptors and affect ammonium, nitrate, and sulfate concentrations in the samples. Variability in hold times among the different laboratories could have an effect on the variability in the nutrient data among laboratories.
Laboratory variability was evaluated for each laboratory and each analyte by comparing the distributions of the differences between reported results and the MPVs. The median values obtained from the seven laboratories for each constituent are considered to be the MPVs. Analyte concentrations reported as less than the MRL were set equal to one-half the MRL before computing differences.
Evaluation of the interlaboratory variability was carried out in three steps. First, the differences between the reported results and the MPVs were calculated as follows:
Concentration difference = Clab – MPV (8)
where
| Clab | = concentration reported by a laboratory for an analyte in a test solution; | |
| and | ||
| MPV | = most probable value, which is the median of all concentration analyses from all laboratories for a test solution. |
Next, the differences were pooled for all seven laboratories to obtain the overall f-pseudosigma of the differences:
fpso = overall f-pseudosigma of all concentration differences,
which is the (75th percentile of all concentration differences minus the 25th percentile of all concentration differences), divided by 1.349. Then, the f-pseudosigma for the differences was calculated for each laboratory's data:
fpslab = f-pseudosigma of concentration differences for a single laboratory,
which is the (75th percentile of concentration differences minus the 25th percentile of concentration differences), divided by 1.349. Finally, the ratio of f-pseudosigma of differences for each laboratory to the overall f-pseudosigma (fps ratio) was computed and expressed as a percentage.
 (9)
(9)
An fps ratio larger than 100 percent indicates that the results provided by a laboratory have higher variability than the overall variability, whereas an fps ratio smaller than 100 percent indicates less variability than overall.
Table 12 shows the fps ratios obtained for each laboratory and for each constituent for data obtained over the study period. The results in table 12 show that the CAL reported data with less variability than the overall variability for all constituents except sodium and ammonium. The fps ratio for the CAL's ammonium data was 195 percent, indicating that variability in the CAL's ammonium data was nearly double the overall variability. The CAL's ammonium data were more variable than any other participating laboratory. The fps ratios were all less than 100 percent for each constituent for Shepard Analytical Services (SA), which was the only laboratory to exhibit consistent, low variability for all constituents.
[mg/L, milligrams per liter; diff., difference; Overall f-psig, f-pseudosigma calculated for all results from all participating laboratories; Median difference, median of differences between each laboratory's individual results and the MPVs; MPV, most probable value defined as the median of all results from all participating laboratories during 2000–2001; f-psig ratio, ratio for each individual laboratory's f-pseudosigma : overall f-pseudosigma, expressed as a percentage; %, percent; Sign test p-value, probability of rejecting the null hypothesis: "The true median of the differences between laboratory results and the most probable value is zero," when true; shaded values identify bias per the Sign test for a two-tailed test at 95-percent confidence (α=0.05) (Kanji, 1993); Spec. cond., specific conductance; ADORC, Acid Deposition and Oxidant Research Center; CAL, Central Analytical Laboratory, Illinois State Water Survey; ESE, Environmental Science and Engineering, Inc.; MSC, Meteorological Services of Canada; MOE, Ontario Ministry of Environment and Energy; NILU, Norwegian Institute for Air Research; SA, Shepard Analytical Services; --, not calculated; <, less than]
| Analyte | Overall f-psig (mg/L) | Laboratory | ||||||||||||||
|---|---|---|---|---|---|---|---|---|---|---|---|---|---|---|---|---|
| ADORC | CAL | ESE | MSC | |||||||||||||
| Median diff. (mg/L) | f-psig ratio (%) | Sign test p-value | Median difference (mg/L) | f-psig ratio (%) | Sign test p-value | Median diff. (mg/L) | f-psig ratio (%) | Sign test p-value | Median diff. (mg/L) | f-psig ratio (%) | Sign test p-value | |||||
| Calcium | 0.014 | –0.001 | 111 | 0.6254 | 0.002 | 58 | 0.5386 | 0.001 | 63 | 0.9022 | 0.003 | 132 | 0.0103 | |||
| Magnesium | 0.004 | –0.002 | 280 | 0.3057 | –0.001 | 80 | 0.4426 | 0.000 | 40 | 0.8957 | 0.001 | 60 | <0.0001 | |||
| Sodium | 0.010 | –0.005 | 162 | 0.2284 | 0.003 | 123 | 0.2215 | –0.006 | 108 | 0.0004 | 0.001 | 54 | 0.0004 | |||
| Potassium | 0.004 | –0.005 | 167 | 0.0049 | 0.001 | 50 | 0.6147 | –0.001 | 50 | 0.0086 | 0.004 | 67 | <0.0001 | |||
| Ammonium | 0.015 | 0.008 | 95 | <0.0001 | –0.027 | 195 | <0.0001 | 0.007 | 80 | 0.0111 | –0.001 | 40 | 0.3891 | |||
| Chloride | 0.009 | –0.003 | 300 | 0.0414 | 0.001 | 67 | 0.0430 | –0.001 | 100 | 0.4570 | 0.001 | 67 | <0.0001 | |||
| Nitrate | 0.032 | 0.005 | 137 | 0.0076 | 0.008 | 79 | <0.0001 | –0.020 | 67 | 0.0059 | –0.012 | 109 | 0.0001 | |||
| Sulfate | 0.053 | 0.000 | 111 | 0.0205 | 0.041 | 76 | <0.0001 | 0.042 | 138 | 0.0002 | –0.021 | 67 | 0.0022 | |||
| Hydrogen ion | 3.150 | –2.66 | 49 | <0.0001 | 0.000 | 46 | 0.0002 | –1.15 | 32 | 0.0003 | –1.22 | 111 | 0.0011 | |||
| Spec. cond. | 2.176 | 0.350 | 22 | <0.0001 | 1.90 | 32 | <0.0001 | –2.38 | 107 | <0.0001 | -- | -- | -- | |||
| MOE | NILU | SA | ||||||||||||||
| Calcium | 0.014 | –0.002 | 232 | 0.3961 | 0.004 | 68 | 0.0025 | –0.004 | 84 | 0.0328 | ||||||
| Magnesium | 0.004 | 0.003 | 140 | <0.0001 | 0.003 | 180 | 0.0115 | –0.001 | 60 | <0.0001 | ||||||
| Sodium | 0.010 | 0.001 | 292 | 0.0769 | 0.000 | 108 | 0.5504 | 0.000 | 38 | 0.1421 | ||||||
| Potassium | 0.004 | –0.001 | 100 | <0.0001 | 0.004 | 167 | 0.0464 | 0.000 | 33 | 0.0001 | ||||||
| Ammonium | 0.015 | 0.008 | 100 | 0.0022 | –0.019 | 165 | 0.0009 | 0.001 | 50 | 0.5386 | ||||||
| Chloride | 0.009 | 0.007 | 275 | 0.0248 | –0.003 | 117 | 0.2820 | 0.000 | 58 | 0.1882 | ||||||
| Nitrate | 0.032 | 0.021 | 200 | <0.0001 | 0.014 | 105 | 0.0205 | 0.000 | 35 | 0.0248 | ||||||
| Sulfate | 0.053 | –0.030 | 153 | 0.0059 | 0.000 | 79 | 0.0559 | –0.024 | 47 | 0.0005 | ||||||
| Hydrogen ion | 3.150 | 5.981 | 339 | <0.0001 | 0.886 | 62 | 0.0025 | 2.204 | 88 | <0.0001 | ||||||
| Spec. cond. | 2.176 | –0.850 | 55 | <0.0001 | 1.72 | 35 | <0.0001 | –1.30 | 41 | <0.0001 | ||||||
Intralaboratory bias (bias within a single laboratory) is defined as a systematic difference between the measured and expected values arising from sample handling and analysis procedures within a specific laboratory. Potential intralaboratory bias for the participating laboratories was evaluated by the following methods: (1) comparison of the medians of the differences between laboratory results and the MPVs, (2) hypothesis testing using the Sign test, and (3) comparison of laboratory results for ultrapure deionized-water samples.
The arithmetic signs of the median differences presented in table 12 indicate whether the reported results for each constituent are positively or negatively biased. The absolute values of the median differences reported for the CAL are all less than or equal to the MRLs (table 5) except for ammonium and sulfate. The median difference reported for sulfate for the CAL was more than four times the MRL. The median differences for the CAL are similar to those computed for the other participating laboratories.
The Sign test for a median (Kanji, 1993) was used to evaluate bias for each laboratory. The null hypothesis, Ho, for the test is: the median of the differences between laboratory-reported values and the MPVs is zero. The test results, shown in table 12, were evaluated at the α=0.05 significance level for a two-tailed test. Rejection of the null hypothesis, as indicated by the shaded values in the table, implies that laboratory results are biased. There are some instances where the Sign test indicated a statistically significant bias and the computed median difference is zero. This is because the Sign test evaluates the probability of the population median being equal to zero, not the sample median. The results in table 12 indicate that the ammonium data reported by the CAL during the study period are negatively biased and that the chloride, nitrate, sulfate, and specific-conductance data are positively biased.
In order to detect possible low-level sample contamination resulting from laboratory analyses, eight ultrapure deionized-water samples were included among the samples submitted to the participating laboratories each year during the study period. In order to facilitate the comparison among laboratories using different MRLs, all data for a given ion less than the largest MRL used by one of the seven participating laboratories were set equal to the largest MRL (the "standardized" MRL) because laboratories with lower reporting limits would be expected to have a much higher incidence of detections for the deionized-water samples than laboratories with higher MRLs. However, this protocol yielded the same results as direct comparison of the results for each laboratory to its own MRLs. Table 13 shows the number of times each laboratory reported a concentration greater than the MRL in deionized water, a solution not expected to contain detectable analyte concentrations. The small number of detections (one) in the deionized-water samples indicates that contamination is not a problem for the CAL. Therefore, laboratory contamination is not a problem for NADP/NTN data during the study period.
[Eight determinations per year per laboratory. ADORC, Acid Deposition and Oxidant Research Center; CAL, Central Analytical Laboratory, Illinois State Water Survey; ESE, Environmental Science and Engineering, Inc.; MOE, Ontario Ministry of Environment and Energy, Dorset Research Facility in Ontario, Canada; MSC, Meteorological Services of Canada; NILU, Norwegian Institute for Air Research; SA, Shepard Analytical Services]
| Analyte | ADORC | CAL | ESE | MOE | MSC | NILU | SA |
|---|---|---|---|---|---|---|---|
| 2000 | |||||||
| Calcium | 1 | 0 | 0 | 0 | 0 | 1 | 0 |
| Magnesium | 1 | 0 | 0 | 0 | 0 | 1 | 0 |
| Sodium | 0 | 0 | 0 | 0 | 0 | 0 | 0 |
| Potassium | 0 | 0 | 0 | 0 | 0 | 0 | 0 |
| Ammonium | 0 | 0 | 0 | 5 | 0 | 1 | 0 |
| Chloride | 0 | 0 | 3 | 1 | 0 | 0 | 0 |
| Nitrate | 0 | 0 | 0 | 7 | 0 | 0 | 0 |
| Sulfate | 0 | 0 | 3 | 0 | 0 | 0 | 0 |
| 2001 | |||||||
| Calcium | 1 | 0 | 0 | 0 | 0 | 1 | 0 |
| Magnesium | 0 | 1 | 0 | 0 | 0 | 0 | 0 |
| Sodium | 0 | 0 | 0 | 0 | 0 | 1 | 0 |
| Potassium | 0 | 0 | 0 | 0 | 0 | 0 | 0 |
| Ammonium | 1 | 0 | 0 | 2 | 1 | 2 | 0 |
| Chloride | 0 | 0 | 0 | 1 | 0 | 0 | 0 |
| Nitrate | 0 | 0 | 0 | 3 | 0 | 0 | 0 |
| Sulfate | 0 | 0 | 0 | 0 | 0 | 0 | 0 |
Chemical analysis error is only one component of the overall error in NADP/NTN data, which also is affected by other error sources such as sample-collection differences and contamination from field exposure and sample handling, to name a few. Comparison of the chemical analysis error to the overall error in NADP/NTN measurements requires computation of errors in absolute terms. Therefore, the median absolute differences (MAD) were calculated for replicate chemical analyses of natural precipitation samples. The f-pseudosigma of the absolute differences also was computed as a measure of variability in the absolute differences about the median (table 14).
[All units in milligrams per liter except hydrogen ion, in microequivalents per liter, and specific conductance, in microsiemens per centimeter at 25 degrees Celsius; MAD, median absolute difference; f-psig, f-pseudosigma; ADORC, Acid Deposition and Oxidant Research Center; CAL, Central Analytical Laboratory, Illinois State Water Survey; ESE, Environmental Science and Engineering, Inc.; MSC, Meteorological Services of Canada; MOE, Ontario Ministry of Environment and Energy; NILU, Norwegian Institute for Air Research; SA, Shepard Analytical Services; --, not calculated, Spec. cond., specific conductance]
| Analyte | ADORC | CAL | ESE | MOE | MSC | NILU | SA | |||||||||||||
|---|---|---|---|---|---|---|---|---|---|---|---|---|---|---|---|---|---|---|---|---|
| MAD | f-psig | MAD | f-psig | MAD | f-psig | MAD | f-psig | MAD | f-psig | MAD | f-psig | MAD | f-psig | |||||||
| 2000 | ||||||||||||||||||||
| Calcium | 0.001 | 0.001 | 0.001 | 0.001 | 0.001 | 0.001 | 0.020 | 0.015 | 0.002 | 0.003 | 0 | 0.007 | 0.001 | 0.001 | ||||||
| Magnesium | 0 | 0.001 | 0.001 | 0.001 | 0 | 0.000 | 0 | 0.004 | 0 | 0.001 | 0 | 0.000 | 0 | 0 | ||||||
| Sodium | 0 | 0.001 | 0.001 | 0.001 | 0.001 | 0.000 | 0.005 | 0.011 | 0.001 | 0.001 | 0 | 0.007 | 0.001 | 0.002 | ||||||
| Potassium | 0.001 | 0.001 | 0.001 | 0.001 | 0 | 0.001 | 0.005 | 0.004 | 0 | 0.001 | 0 | 0.000 | 0 | 0.001 | ||||||
| Ammonium | 0 | 0 | 0 | 0.007 | 0.003 | 0.004 | 0.005 | 0.007 | 0.001 | 0.001 | 0 | 0.007 | 0 | 0.000 | ||||||
| Chloride | 0 | 0 | 0 | 0.000 | 0.002 | 0.006 | 0.010 | 0.007 | 0.002 | 0.002 | 0 | 0.007 | 0 | 0.000 | ||||||
| Nitrate | 0.010 | 0.007 | 0 | 0.000 | 0.009 | 0.010 | 0.010 | 0.019 | 0.003 | 0.004 | 0.020 | 0.022 | 0 | 0.007 | ||||||
| Sulfate | 0.010 | 0.015 | 0 | 0.007 | 0.010 | 0.013 | 0 | 0.037 | 0.003 | 0.004 | 0.010 | 0.022 | 0.005 | 0.007 | ||||||
| Hydrogen ion | 0.361 | 0.337 | 0.307 | 0.476 | 0.414 | 0.571 | 0.889 | 1.26 | 0.225 | 0.541 | 0.670 | 0.781 | 0.080 | 0.314 | ||||||
| Spec. cond. | 0.10 | 0.14 | 0.10 | 0.07 | 0.13 | 0.31 | 0.60 | 1.8 | -- | -- | 0.10 | 0.22 | 0.10 | 0.07 | ||||||
| 2001 | ||||||||||||||||||||
| Calcium | 0.001 | 0.001 | 0.002 | 0.003 | 0.003 | 0.003 | 0 | 0.010 | 0.002 | 0.002 | 0.010 | 0.007 | 0.001 | 0.001 | ||||||
| Magnesium | 0 | 0.001 | 0 | 0.001 | 0.001 | 0.001 | 0 | 0 | 0 | 0.001 | 0 | 0.000 | 0 | 0 | ||||||
| Sodium | 0 | 0.001 | 0.002 | 0.001 | 0.001 | 0.002 | 0.002 | 0.004 | 0.001 | 0.002 | 0 | 0.000 | 0.001 | 0.001 | ||||||
| Potassium | 0 | 0.001 | 0.001 | 0.001 | 0.001 | 0.001 | 0 | 0.004 | 0.001 | 0.001 | 0 | 0.000 | 0 | 0.001 | ||||||
| Ammonium | 0 | 0.007 | 0 | 0 | 0.003 | 0.003 | 0.010 | 0.007 | 0.001 | 0.002 | 0 | 0.007 | 0 | 0.007 | ||||||
| Chloride | 0 | 0.000 | 0.002 | 0.003 | 0.003 | 0.004 | 0 | 0.015 | 0.002 | 0.001 | 0 | 0.007 | 0 | 0.007 | ||||||
| Nitrate | 0 | 0.007 | 0.003 | 0.005 | 0.005 | 0.003 | 0.015 | 0.019 | 0.003 | 0.004 | 0.005 | 0.022 | 0 | 0.007 | ||||||
| Sulfate | 0 | 0.007 | 0.005 | 0.006 | 0.010 | 0.004 | 0 | 0.037 | 0.002 | 0.004 | 0.020 | 0.019 | 0.010 | 0.007 | ||||||
| Hydrogen ion | 0.410 | 0.638 | 0.021 | 0.240 | 0.101 | 0.518 | 0.173 | 1.13 | 0.417 | 0.428 | 0.516 | 0.738 | 0.208 | 0.386 | ||||||
| Spec. cond. | 0.20 | 0.22 | 0.10 | 0.22 | 0.20 | 0.26 | 0.40 | 0.44 | -- | -- | 0.07 | 0.10 | 0.10 | 0.07 | ||||||
MAD values computed for the analysis of natural precipitation replicate samples for the study period were similar to 1997–99 results for the interlaboratory-comparison program (Gordon and others, 2003). Cation precision estimates were similar among laboratories, with nearly all MAD values less than or equal to 0.005 mg/L. Anion precision estimates exhibited greater variability among laboratories than cation precision estimates. All of the participating laboratories had MAD values that were less than or equal to 0.020 mg/L for the anions.
The pH (expressed as hydrogen ion) MAD values exhibited low variability during the study period; ranging from 0.080 to 0.889 µeq/L in 2000, and from 0.021 to 0.518 µeq/L in 2001. MAD values for hydrogen-ion concentration in the natural precipitation samples are less than 10 percent of the median hydrogen-ion concentration for NADP/NTN data during the study period and thus are not environmentally significant to NADP data users.
Six laboratories routinely reported specific-conductance results during the study period. The MSC laboratory does not routinely report specific-conductance measurements. Overall, there was little variability among laboratories in their reported specific-conductance measurements for the natural samples; the MAD values ranged from 0.10 to 0.60 µS/cm in 2000 and from 0.07 to 0.40 µS/cm in 2001. The absolute differences measured for specific conductance are less than 10 percent of the median values for all NADP/NTN specific-conductance measurements made during the study period. Therefore, the error in the specific-conductance measurements is not environmentally significant to NADP/NTN data users.
The MAD values in table 14 are less than 10 percent of the median values for all NADP/NTN concentration measurements made during the study period (table 5) for all laboratories with the exception of MOE during 2000. The MOE reported MAD values for calcium, sodium, and potassium that were greater than 10 percent of the median NADP/NTN concentration values. This comparison implies that the magnitude of the CAL's laboratory analysis error is not environmentally significant to NADP/NTN data users, but comparisons between the NADP/NTN concentrations to the concentrations measured in the Canadian precipitation monitoring network might be affected by bias for laboratory analysis of calcium, sodium, and potassium concentrations during the study period.
A visual comparison of interlaboratory differences between each laboratory's analyte concentrations and the MPVs (medians calculated for all data from all laboratories) are presented in the control charts shown in figures 20 through 29. The control limits are placed at +3 f-pseudosigma from the zero difference line. The f-pseudosigma was defined previously in equations 1 and 9 and is assumed to be a nonparametric analogue of the standard deviation (Iman and Conover, 1983). Control limits (3-sigma) define the bounds of virtually all values (99 percent) produced by a system in statistical control. Modern control charts commonly have additional limits called warning limits (2-sigma) within which most (95 percent) of the values should lie (Taylor, 1987). The warning limits are positioned at +2 f-pseudosigma from the zero difference line. The independent axis for the control charts is time of sample analysis, in this report January 1, 2000, to December 31, 2001.
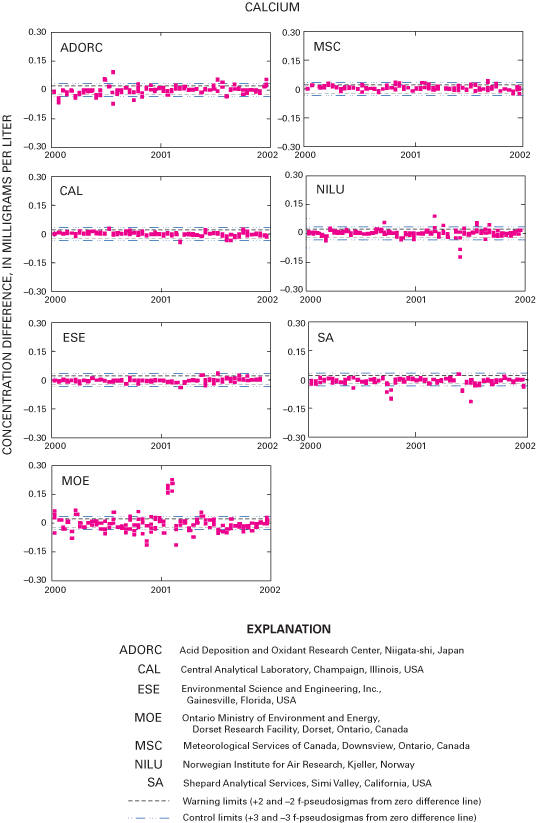
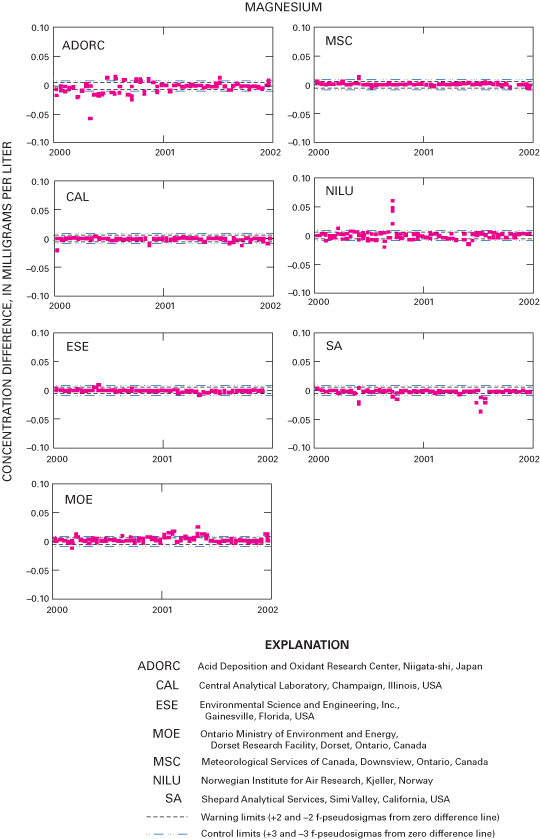
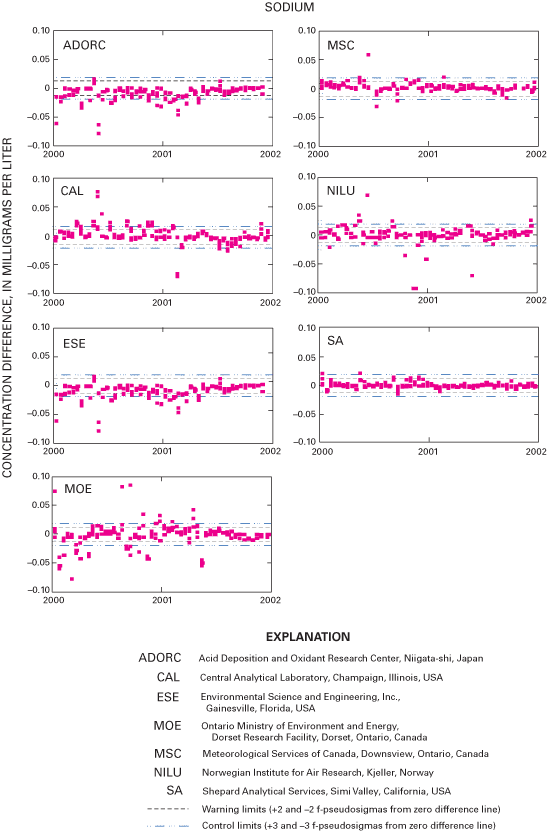
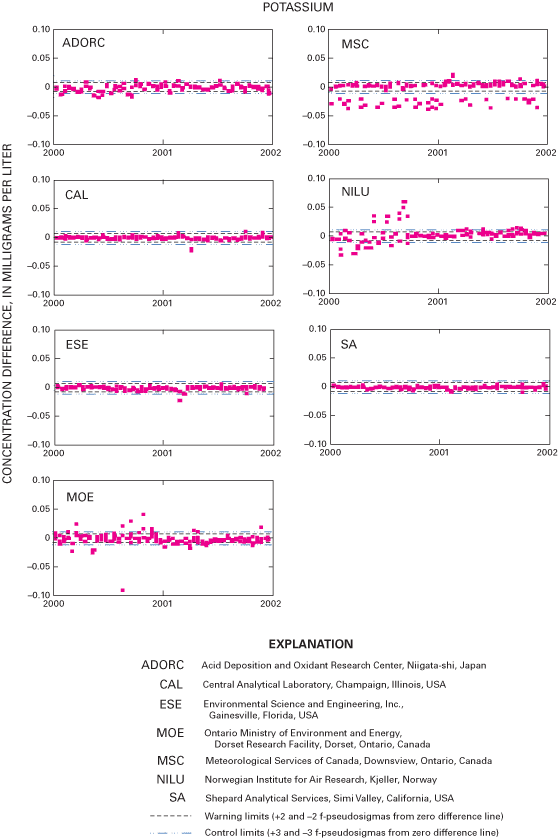
Graphs in figure 30 depict the number of data points outside the control limits for the CAL during the study period. Graphs for other laboratories can be found on the World Wide Web at Universal Resource Locator (URL) http://bqs.usgs.gov/precip/project_overview/frameil.htm. For sodium, there were 9 and 10 data points outside the control limits during 2000 and 2001, respectively. There were 36 values outside the control limits for ammonium in 2001 compared to 12 values during 2000. During 1997–99, sodium and ammonium exhibit an upward trend in the number of data points outside the control limits (Gordon and others, 2003). The data for the CAL in figures 22, 24, and 25 show brief time periods when the CAL's analytical precision for sodium, ammonium, and chloride was not within the control limits.
In October 1988, the collocated-sampler program was established to provide a method of estimating the overall variability of the precipitation-monitoring system used by the NADP/NTN. Included in this estimate of NADP/NTN precision is the variability from the point of sample collection through laboratory analysis and quality control (Gordon, 1999). Nilles and others (1991) provide a detailed description of the collocated-sampler program. Since 1988, collocated sites have operated on a water-year basis every year except 1994 (Gordon, 1999).
The two sites selected for the collocated-sampler program in water year 2000—October 1, 1999, through September 30, 2000—were CO08 (Four Mile Park, Garfield County, Colorado) and NH02 (Hubbard Brook, Grafton County, New Hampshire). In water year 2001—October 1, 2000, through September 30, 2001—the NH02 site remained in place in order to collect data for two consecutive years at the same location. Running a collocated site at NH02 for two consecutive years allowed evaluation of whether equipment shipping or changes in precipitation affect the total error estimated by comparing data from the collocated sites. The single new site selected for participation in the collocated-sampler program in water year 2001 was CA99 (Yosemite National Park, Hodgdon Meadow, Tuolumne County, California).
NADP/NTN guidelines for site selection and installation (Dossett and Bowersox, 1999) are used in the establishment of each collocated site. Site selection is made with the goal of distributing sites among diverse regional locations, ecoregions, and precipitation regimes. In an effort to minimize data loss due to changes in personnel, sites with stable operational histories are given priority consideration. At each site, the Aerochem Metrics Model 310 collector, Belfort Model 5-780 rain gage, and the power supply (solar panel, battery, alternating current, and so forth) are duplicated. The duplicate instruments are installed such that they are no more or less influenced by surrounding objects than the original site equipment. Snow platforms, rain-gage shielding, and other accessories also are duplicated. Both sets of equipment are calibrated and tested by the USGS before starting sample collection at the collocated sites to ensure that differences between the two sites are not artifacts of instrument calibration.
Over the course of the water year, the site operators process samples from each pair of collectors using standard NADP/NTN procedures (Dossett and Bowersox, 1999). Site operators were given the option of foregoing onsite pH and specific-conductance measurements of samples from the newly installed collocated samplers. Regardless of whether the pH and specific-conductance measurements were made, a 20-mL aliquot was removed from samples with volumes greater than 70 mL to ensure equivalent handling of both samples from the collocated-sampler site. The CAL analyzed samples from the collocated sites following NADP/NTN SOPs.
Data from the original and collocated equipment were analyzed in two ways. For the purpose of site characterization, the data from the original and collocated sites were pooled to determine the median sample chemistry or median precipitation depth. For the purpose of comparing an original and collocated site, the data from the original and collocated sites were analyzed for differences. Data from the original and collocated site are formally referred to by the four-character site code of the original site followed by the four-character site code of the collocated site. For example, the Hubbard Brook site is formally referred to as NH02/02NH. For this analysis, the data used were from wet-deposition samples with volumes greater than 35 mL. These samples are identified by a laboratory type code "W" to indicate that the samples were of sufficient volume for analysis and did not require dilution. Samples requiring dilution are inherently prone to a greater error component.
Because the NADP/NTN sites, located across the country, have diverse climates, anthropogenic influences, and wet-deposition regimes, differences in their sample chemistry are expected. While median sample chemistry often was quite similar among the three pairs of collocated sites operated during the study period, there were some expected differences owing to the geographic locations of the collocated sites. Median concentrations for selected analytes in weekly samples collected at the collocated sites are depicted in figure 31. Figure 32 depicts the median hydrogen-ion concentration, median specific conductance, median sample volume, and median precipitation depth for these collocated sites.
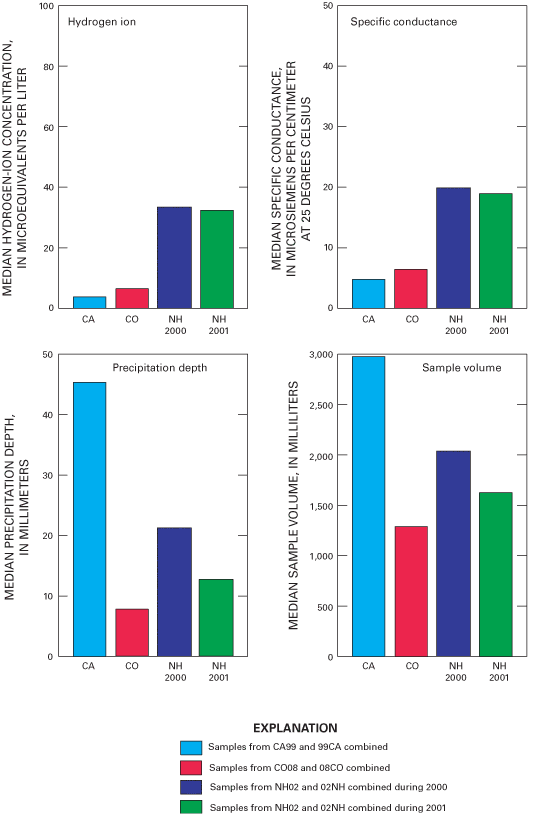
Because annual summaries of NADP/NTN data describe precipitation chemistry in terms of concentration and deposition (National Atmospheric Deposition Program, 2001, 2002), statistical summaries for both the concentration and deposition of constituents are provided in this report. The weekly precipitation depth associated with each Belfort recording rain gage was used to calculate deposition values at the collocated sites. To calculate deposition, concentration in milligrams per liter is multiplied by 10–1 times the precipitation depth in centimeters to yield deposition in kilograms per hectare (kg/ha). The variability in deposition, due to differences in rain-gage collection efficiency at collocated sites, provides an estimate of the variability in deposition amounts at other NADP/NTN sites.
In the analysis of collocated data, statistical analyses that (1) were useful for describing overall sampling precision and (2) were not overly sensitive to a few extreme values, were selected. Precision estimates for each site were calculated from the absolute differences between the pairs of collocated samplers and are expressed as MAE values for a given site and analyte. The equations used to estimate relative and absolute errors from collocated data are:
Absolute difference = |C2 – C1| (11)
Absolute error (percent) = |[(C2–C1)/(C1+C2)/2]| • 100 (12)
MAE = M|[(C2–C1)/(C1+C2)/2]| • 100 (13)
where
| M | = median of all paired differences; | |
| C1 | = sample concentration, in milligrams per liter, from the collocated precipitation sampler, or deposition, in kilograms per hectare, from the collocated precipitation sampler and rain gage; | |
| and | ||
| C2 | = sample concentration, in milligrams per liter, from the original precipitation sampler, or deposition, in kilograms per hectare, from the original precipitation sampler and rain gage. |
Precision is defined for the collocated-sampler program by the MAE. Graphical depictions of all MAEs for collocated sites are shown for concentration, for deposition, and for the physical measurements of specific conductance, sample volume, and precipitation depth in figures 33 and 34. For clarity, only the four-character codes of the original sites are displayed in figures 33 and 34. The MAE was estimated to be approximately 10 percent or less for concentrations of calcium, magnesium, sodium, chloride, nitrate, and sulfate and for specific conductance and sample volume at all of the collocated sites during the study period. The MAE values for ammonium and hydrogen-ion concentrations were estimated to be less than 10 percent for CA99 and NH02 (during both 2000 and 2001). The MAE values for CO08 were nearly 20 percent for ammonium concentration and about 17 percent for hydrogen-ion concentration. Estimated MAE for sample volume was nearly identical for all collocated sites at about 3 percent, which implies that error due to sampling equipment effects was small during the study period. The relatively high MAE estimated for ammonium and hydrogen-ion concentrations at CO08 might be explained by sample handling and laboratory variability.
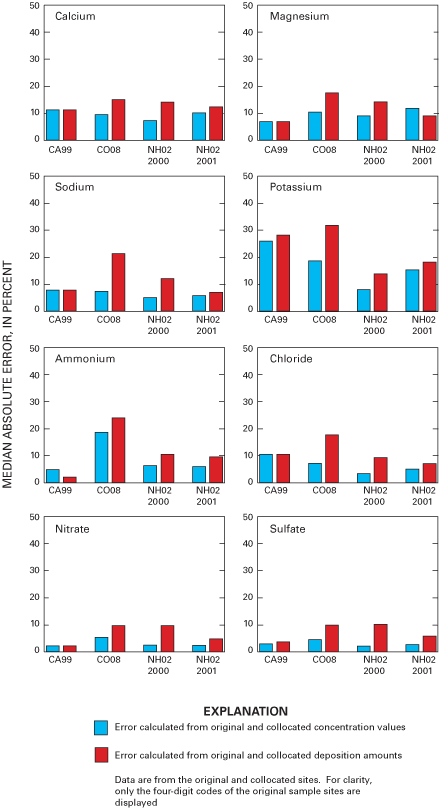
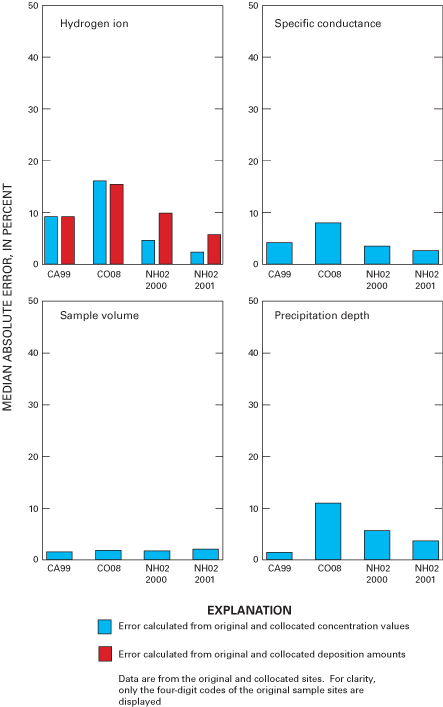
Constituent deposition is calculated from the precipitation depth, which makes the estimated MAE for deposition rates sensitive to error in precipitation depth measurements. Upon converting concentrations to deposition amounts, the MAE values for most constituents increase for CO08 and NH02 (figs. 33 and 34). This is illustrated by comparison of the variation of estimated MAE for precipitation depth with the variation in the MAE estimated for the deposition data among the collocated sites. Similarly, the MAE values estimated for deposition amounts are approximately equal to the MAE values estimated for concentrations for CA99.
Estimated MAE for precipitation depth was about 5 percent or less at CA99 and NH02 but was slightly over 10 percent at CO08. The CO08 site is located in a region that receives snow accompanied by wind, which is difficult to measure with precision using the Belfort rain gage. Under these conditions, it is not surprising that the MAE values calculated using deposition amounts at the CO08 site were higher than the MAEs at the other two sites.
As in past years, the MAE at the collocated sites for sample volume (measured from the AeroChem Metrics wet-deposition collectors) was less than the MAE measured for precipitation depth (measured from the Belfort rain gages). The MAEs for sample volume were uniformly small (ranging from 2 to 5 percent). In contrast, the MAEs for precipitation depth ranged from less than 2 percent to over 10 percent during the study period, indicating there was some disparity in the performance of the Belfort rain gages at the various collocated sites. This same relation between estimated MAE for sample volume and estimated MAE for precipitation depth has been observed every year since 1995 (Gordon, 1999; Gordon and others, 2003).
As in past years, the MAEs were generally larger for cations than for anions. At many of the sites, cation concentrations were typically close to the MRLs, and larger variability is expected for concentrations approaching a MRL because laboratory error usually increases as analyte concentration decreases. Estimates of network precision covering several years of collocated sampling are given in Nilles and others (1993).
Consistent with the results from previous years of this study, the precision for hydrogen-ion concentration and deposition varied in absolute and in relative terms among the sites, generally depending upon the acidity of the precipitation at a given collocated site. For example, the estimated MAE for hydrogen ion was lowest for NH02, which had the highest hydrogen-ion concentrations among the collocated sites during the study period. This result illustrates that larger errors are expected for higher pH samples due to the relative difficulty of measuring pH in solutions with low ionic strength and low hydrogen-ion concentrations.
Two types of QC data are generated by the USGS External QA Program: (1) basic QC data and (2) topical QC data (Jeff Martin, U.S. Geological Survey, written commun., 2003). Basic QC data are used to document the quality of the NADP/NTN data and identify data-quality problems. Topical QC data are used to make "yes/no" decisions about data quality and to locate the causes of data-quality problems. Basic QC data are obtained from the collocated-sampler program. Topical QC data are obtained from the blind-audit, field-audit, and interlaboratory-comparison programs. The goal of the collocated-sampler program is to measure the sum total of as many components of the error in NADP/NTN measurements as possible, while the blind-audit, field-audit, and interlaboratory-comparison programs measure selected components of the overall error.
The MAE data for each program are shown in table 15 to compare the relative amounts of the total error in NADP/NTN measurements attributable to different sources. Data in table 15 show that laboratory analysis error accounts for less than 10 percent of the overall error, as estimated by the collocated-sampler program, whereas field exposure and sample handling, as estimated by the blind audit and field audit, typically account for about 25 to 60 percent of the estimated overall error. The remaining error (40 to 75 percent) is due to the sample-collection equipment and natural variability. The error attributed to each component of the sample-collection and analysis processes varied among analytes.
[All values in percent]
| Analyte | Median absolute error | |||
|---|---|---|---|---|
| Estimated overall error1 | Combined field exposure, sample handling, and laboratory analysis error2 | Combined sample handling and laboratory analysis error3 | Laboratory analysis error4 | |
| 2000 | ||||
| Calcium | 8.1 | 6.5 | 2.8 | 0.3 |
| Magnesium | 9.2 | 4.1 | 3.4 | 0.3 |
| Sodium | 6.2 | 1.9 | 2.4 | 0.4 |
| Potassium | 11. | 4.4 | 3.6 | 0.3 |
| Ammonium | 12. | 3.6 | 2.8 | 0.0 |
| Chloride | 5.0 | 4.0 | 2.2 | 0.0 |
| Nitrate | 3.9 | 1.2 | 1.3 | 0.0 |
| Sulfate | 3.0 | 1.3 | 1.2 | 0.0 |
| Hydrogen ion | 10. | 6.8 | 5.5 | 0.6 |
| Specific conductance | 5.6 | 5.6 | 2.6 | 0.2 |
| 2001 | ||||
| Calcium | 11. | 2.5 | 3.8 | 0.5 |
| Magnesium | 11. | 2.9 | 8.6 | 0.0 |
| Sodium | 7.6 | 0.9 | 2.6 | 0.3 |
| Potassium | 23. | 3.3 | 5.0 | 0.9 |
| Ammonium | 3.5 | 0.0 | 3.4 | 0.0 |
| Chloride | 7.7 | 4.0 | 2.8 | 0.3 |
| Nitrate | 2.3 | 1.0 | 1.4 | 0.1 |
| Sulfate | 3.7 | 0.8 | 1.5 | 0.1 |
| Hydrogen ion | 5.2 | 4.6 | 6.5 | 0.6 |
| Specific conductance | 3.4 | 2.5 | 2.6 | 0.3 |
1 Estimated overall error calculated from replicate samples for the collocated-sampler program with average values for CO08 and NH02 in 2000 and for CA99 and NH02 in 2001 (figs. 33–34).
2 Combined field exposure, sample handling, and laboratory analysis error calculated from bucket and bottle samples for the field-audit program, expressed as a percentage of the target bottle concentration (results for 2000–2001 combined shown in table 10).
3 Combined sample handling and laboratory analysis error calculated from bucket and bottle samples for the blind-audit program, expressed as a percentage of the target bottle concentration (table 6).
4 Laboratory analysis error calculated from analysis of blended, natural precipitation (CALNAT) sample replicates for the interlaboratory-comparison program (table 14).
The USGS used five programs to provide external QA monitoring for the NADP/NTN during 2000–2001. An intersite-comparison program was used to estimate the accuracy and precision of field pH and specific-conductance determinations. A blind-audit program was used to assess the effects of routine sample handling, processing, and shipping of wet-deposition samples on the variability and bias of NADP/NTN wet-deposition data. A field-audit program assessed the effects of field exposure of sample-collection surfaces on precipitation chemistry. An interlaboratory-comparison program assessed the bias and variability of the chemical analysis data from the CAL. A collocated-sampler program was used to determine the overall variability applicable to NADP/NTN wet-deposition data.
Four intersite-comparison studies were conducted during the study period. Accuracy goals for pH measurements are based on a multiple-regression function that incorporates the solution's hydrogen-ion concentration and the results from past intersite studies, and specific-conductance accuracy goals are set to +4 µS/cm. The percentage of site operators responding on time that met the pH accuracy goals ranged from 84.2 to 90.5 percent. In these same four intersite-comparison studies, 88.9 to 99.0 percent of the site operators met the accuracy goals for specific conductance. Although performance for specific conductance remains high, the data indicate a potential decrease in the quality of field pH measurements compared to previous years.
Variability and bias in NADP/NTN data due to sample handling, processing, and shipping were estimated from the blind-audit program paired samples. During 2000, the median (50th percentile) percent bias for all analytes was within the range of –4.5 to 2.2 percent, which was smaller than the range during 1997 through 1999. The range of percent bias increased in 2001 to –6.4 to +5.9 percent, representing an approximate +2-percent increase over the 1997–99 range. The median bias values for calcium, sodium, potassium, ammonium, chloride, nitrate, and sulfate are between 0 and 2.9 percent, indicating minor positive bias attributed to sample handling and shipping.
The MAE values for ammonium and sodium decreased during the study period, indicating continued improvement in precision with respect to ammonium and sodium. Statistically significant (α=0.05) relations between paired blind-audit sample differences and sample volume were found for selected constituents. The results point to possible introduction of low-level contamination from sample handling and shipping. The median paired differences for the blind-audit results are less than 10 percent of the median of the measured NADP/NTN constituent concentrations except for magnesium, sodium, and chloride. Therefore, error introduced by sample handling and processing appears to be environmentally significant to NADP/NTN data users for magnesium, sodium, and chloride, but not for other constituents.
During the 2000–2001 field-audit program, the median relative percent bias for all analytes was within a range of –4 to +4 percent, indicating minor positive or negative bias. Statistical analysis of the paired differences show that a minor amount of contaminant material becomes entrained into the solutions from the field-exposed buckets, and the positive bias that results from the contamination appears to affect the chemical results by as much as 6 percent on a concentration basis.
Boxplots of the paired field-audit sample differences, in units of concentration, were compared for three different sample volumes. The boxplots, supported by a Kruskal-Wallis analysis of variance, indicated a significant (α=0.05) relation between the paired differences and sample volume for chloride, ammonium, and nitrate. The results indicate potential low-level contamination of NADP/NTN samples with ammonium, chloride, and nitrate from field exposure and sample handling and shipping. These results are further supported by the fact that low-level nitrate contamination was detected in about 40 percent of the field-exposed ultrapure deionized-water samples during the study period. Chloride was detected in 59 and 78 percent of the ultrapure deionized-water samples during 2000 and 2001, respectively. In addition, calcium was detected in 82 and 65 percent of the ultrapure deionized-water samples during 2000 and 2001, respectively. Therefore, calcium is a field contaminant to NADP/NTN samples. The occurrence of detectable sodium in the field-audit ultrapure deionized-water samples decreased from the frequency observed during 1997–99, indicating less sodium contamination affected the NADP/NTN samples during the study period than during 1997–99. Past problems with sodium contamination of samples from the CAL's filters appear to have been eliminated.
Interlaboratory variability and bias was evaluated during the study period in the interlaboratory-comparison program. Cation precision estimates were similar among laboratories, with MADs less than or equal to 0.005 mg/L. All of the participating laboratories had MAD that were less than or equal to 0.050 mg/L for the anions. Anion precision estimates exhibited greater variability among laboratories than cation precision estimates.
The MAD obtained for replicate samples are less than 10 percent of the median values for all NADP/NTN concentration and specific-conductance measurements made during the study period for all laboratories except for the MOE during 2000. The CAL's laboratory analysis error is not likely to be environmentally significant to NADP/NTN data users, but comparisons between the NADP/NTN concentrations to the concentrations measured in the Canadian precipitation monitoring network might be affected by laboratory bias for calcium, sodium, and potassium concentrations during the study period.
Eight ultrapure deionized-water samples were included among the samples submitted to the participating laboratories each year during the study period to detect possible low-level sample contamination resulting from laboratory analyses. Few concentration values were reported that exceeded the MRLs for cations during the study period, and no detections for nitrate or sulfate were reported in 2001. The data for the ultrapure deionized-water samples indicate that laboratory contamination is not a problem for NADP/NTN data during the study period.
Control charts of each laboratory's analyte concentrations minus the median values calculated for all of the laboratories' data imply that the CAL had brief periods where sodium, ammonium, and chloride concentration data were outside of the statistical control limits. Otherwise, the control charts show that most of the constituent concentration data were in statistical control.
Ammonium data reported by the CAL during the study period are negatively biased, and the chloride, nitrate, sulfate, and specific-conductance data are positively biased. The absolute values of the median differences reported for the CAL are all less than or equal to the MRLs except for ammonium and sulfate. The median difference reported for sulfate for the CAL was more than four times the MRL. The median differences for the CAL are similar to those computed for the other participating laboratories.
Overall variability of NADP/NTN measurements was evaluated from data collected in the collocated-sampler program. Weekly wet-deposition samples and precipitation measurements from collocated NADP/NTN sites were compared. Estimates of precision were calculated in terms of MAE for concentration and deposition of ionic constituents of wet deposition. Sample volume MAE values were less than 5 percent. The MAE values at site NH02 did not appear to change appreciably during consecutive water years 2000 and 2001.
The error attributed to each component of the sample-collection and analysis processes varied among analytes. Laboratory analysis error accounts for less than 10 percent of the overall error, as estimated by the collocated-sampler program, whereas sample handling and field exposure, as estimated by the blind-audit and field-audit programs, typically account for about 25 to 60 percent of the estimated overall error. The remaining error (40 to 75 percent) is due to the sample-collection equipment and natural variability.
Berthouex, P.M., and Brown, L.C., 1995, Statistics for environmental engineers: Boca Raton, Fla., CRC Press, Inc., 336 p.
Bigelow, D.S., Sisterson, D.L., and Schroder, L.J., 1989, An interpretation of differences between field and laboratory pH values reported by the National Atmospheric Deposition Program/National Trends Network Monitoring Program: Environmental Science and Technology, v. 23, p. 881–887.
Chambers, J.M., Cleveland, W.S., Kleiner, B., and Tukey, P.A., 1983, Graphical methods for data analysis: Boston, Duxbury Press, p. 20–24.
Dean, J.A., ed., 1979, Lange's handbook of chemistry (12th ed.): New York, McGraw-Hill, 644 p.
Dossett, S.R., and Bowersox, V.C., 1999, National Trends Network site operation manual: Champaign, Ill., National Atmospheric Deposition Program Office at the Illinois State Water Survey, NADP Manual 1999–2001, 94 p., accessed data at http://nadp.sws.uiuc.edu/lib/manuals/opman.pdf
Gordon, J.D., 1999, External quality-assurance results for the National Atmospheric Deposition Program/National Trends Network, 1995–96: U.S. Geological Survey Water-Resources Investigations Report 99–4072, 69 p.
Gordon, J.D., Latysh, N.E., and Lindholm, S.J., 2003, External quality-assurance results for the National Atmospheric Deposition Program/National Trends Network, 1997–99: U.S. Geological Survey Water-Resources Investigations Report 03–4027, 149 p.
Gordon, J.D., Morden-Moore, A.L., Schroder, L.J., and Bowersox, V.C., 1995, The stability of hydrogen ion and specific conductance in filtered wet-deposition samples stored at ambient temperatures: Water, Air and Soil Pollution, v. 83, p. 299–313.
Gordon, J.D., Nilles, M.A., Polacsek, D.K., and Ratcliff, M.E., 1997, External quality-assurance results for the National Atmospheric Deposition Program/National Trends Network during 1994: U.S. Geological Survey Water-Resources Investigations Report 97–4201, 42 p.
Gordon, J.D., Willoughby, T.C., and Schroder, L.J., 1991, Summary of the National Atmospheric Deposition Program/National Trends Network intersite-comparison program, November 1978–November 1989: U.S. Geological Survey Water-Resources Investigations Report 91–4061, 26 p.
Helsel, D.R., and Hirsch, R.M., 1992, Statistical methods in water resources: New York, Elsevier Science Publishing Company, Inc., 522 p.
Helsel, D.R., 1990, Less than obvious—Statistical treatment of data below the detection limit: Environmental Science and Technology, v. 24, no. 12, p. 1767–1774.
Hem, J.D., 1985, Study and interpretation of the chemical characteristics of natural water (3d ed.): U.S. Geological Survey Water-Supply Paper 2252, p. 62–63.
Hollander, Myles, and Wolfe, D.A., 1999, Nonparametric statistical methods (2d ed.): New York, John Wiley and Sons, 787 p.
Huntsberger, D.V., and Billingsley, P., 1981, Elements of statistical inference (5th ed.): Boston, Allyn and Bacon, Inc., 503 p.
Iman, R.L., and Conover, W.J., 1983, A modern approach to statistics: New York, John Wiley, 496 p.
Kanji, H.K., 1993, 100 Statistical tests: Newbury Park, Calif., Sage Publications, Inc., 216 p.
National Atmospheric Deposition Program, 2001, National Atmospheric Deposition Program 2000 wet deposition: Illinois State Water Survey, Champaign, Ill., NADP Data Report 2001–01, 15 p.
National Atmospheric Deposition Program, 2002, National Atmospheric Deposition Program 2001 wet deposition: Illinois State Water Survey, Champaign, Ill., NADP Data Report 2002–01, 15 p.
Nilles, M.A., 2001, Changes in the chemistry of precipitation in the United States, 1981–1998: Water, Air and Soil Pollution, v. 130, no. 1, p. 409–414.
Nilles, M.A., Gordon, J.D., and Schroder, L.J., 1993, Precision of wet atmospheric deposition data from National Atmospheric Deposition Program/National Trends Network sites determined with collocated samplers: Atmospheric Environment, v. 28, no. 6, p. 1121–1128.
Nilles, M.A., Gordon, J.D., Schroder, L.J., and Paulin, C.E., 1995, External quality-assurance results for the National Atmospheric Deposition Program/National Trends Network during 1991: U.S. Geological Survey Water-Resources Investigations Report 93–4208, 36 p.
Nilles, M.A., See, R.B., Willoughby, T.C., and Gordon, J.D., 1991, Variability in wet atmospheric deposition data determined with collocated samplers: U.S. Geological Survey Water-Resources Investigations Report 91–4143, 30 p.
Peden, M.E., 1986, Development of standard methods for collection and analysis of precipitation, in Methods for collection and analysis of precipitation: Champaign, Illinois State Water Survey Contract Report 381, p. 19–21.
Peden, M.E., and Skowron, L.M., 1978, Ionic stability of precipitation samples: Atmospheric Environment, v. 12, Pergamon Press Ltd., p. 2343–2349.
Robertson, J.K., and Wilson, J.W., 1985, Design of the National Trends Network for monitoring the chemistry of atmospheric precipitation: U.S. Geological Survey Circular 964, 46 p.
Rothert, Jane, 2002, Quality assurance report, National Atmospheric Deposition Program, 2000: Illinois State Water Survey, Central Analytical Laboratory, Champaign, Ill., p. 8, accessed data at http://nadp.sws.uiuc.edu/lib/qa/qa2000.pdf
Rothert, Jane, 2003, Quality assurance report, National Atmospheric Deposition Program, 2001, Illinois State Water Survey, Champaign, Ill., Central Analytical Laboratory, NADP Report 2003–01.
SAS Institute Inc., 1989, SAS STAT users guide, version 6, 4th ed., v. 1: Cary, N.C., SAS Institute Inc.
See, R.B., Willoughby, T.C., and Schroder, L.J., 1989, External quality-assurance results for the National Atmospheric Deposition Program/National Trends Network during 1987: U.S. Geological Survey Water-Resources Investigations Report 89–4015, 16 p.
See, R.B., Willoughby, T.C., Brooks, M.H., and Gordon, J.D., 1990, Programs and analytical methods for the U.S. Geological Survey Acid Rain Quality-Assurance project: U.S. Geological Survey Water-Resources Investigations Report 90–4029, 57 p.
Taylor, J.K., 1987, Quality assurance of chemical measurements, 2d. ed.: Chelsea, Mich., Lewis Publishers, Inc., 328 p.
Document Accessibility: Adobe Systems Incorporated has information about PDFs and the visually impaired. This information provides tools to help make PDF files accessible. These tools convert Adobe PDF documents into HTML or ASCII text, which then can be read by a number of common screen-reading programs that synthesize text as audible speech. In addition, an accessible version of Acrobat Reader 6.0, which contains support for screen readers, is available. These tools and the accessible reader may be obtained free from Adobe at Adobe Access.
| AccessibilityFOIAPrivacyPolicies and Notices | |
 |
|