
Scientific Investigations Report 2004-5217
Fractionation of Organic Matter
Characterization of Organic Matter
Figure 1. Flow chart of total organic matter fractionation for north-side s...
Figure 2. Flow chart of solvent-extractable organic matter fractionation fo...
Figure 3. Fractionation of total organic matter of north-side sample.
Figure 4. Fractionation of particulate organic matter of north-side sample.
Figure 5. Fractionation of colloidal organic matter of north-side sample.
Figure 6. Bar chart showing volatile and non-volatile dissolved organic mat...
Figure 7. Fractionation of non-volatile dissolved organic matter in north-s...
Figure 8. Organic solvent fractionation of south-side sample.
Figure 9. Infrared spectra of particulate fractions from north-side sample.
Figure 10. 13C-NMR spectra of particulate fractions from north-side sample....
Figure 11. Comparison of infrared spectrum floc particulates extracted with...
Figure 12. Infrared spectra of colloid fractions from north-side sample.
Figure 13. 13C-NMR spectra of colloid fractions from north-side sample.
Figure 14. Infrared spectra of dissolved fractions from north-side sample. ...
Figure 15. 13C-NMR spectra of dissolved fractions from north-side sample.
Figure 16. Infrared spectra of solvent-extractable fractions from south-sid...
Figure 17. 13C-NMR spectra of solvent-extractable fractions from south-side...
Table 1. Infrared frequency bands for various structures in DOM isolates
Table 2. Structural assignments for 13C-NMR spectra.
Organic matter in wastewater sampled from a swine waste-retention basin in Iowa was fractionated into 14 fractions on the basis of size (particulate, colloid, and dissolved); volatility; polarity (hydrophobic, transphilic, hydrophilic); acid, base, neutral characteristics; and precipitate or flocculates (floc) formation upon acidification. The compound-class composition of each of these fractions was determined by infrared and 13C-NMR spectral analyses. Volatile acids were the largest fraction with acetic acid being the major component of this fraction. The second most abundant fraction was fine particulate organic matter that consisted of bacterial cells that were subfractionated into extractable lipids consisting of straight chain fatty acids, peptidoglycans components of bacterial cell walls, and protein globulin components of cellular plasma. The large lipid content of the particulate fraction indicates that non-polar contaminants, such as certain pharmaceuticals added to swine feed, likely associate with the particulate fraction through partitioning interactions. Hydrocinnamic acid is a major component of the hydrophobic acid fraction, and its presence is an indication of anaerobic degradation of lignin originally present in swine feed. This is the first study to combine particulate organic matter with dissolved organic matter fractionation into a total organic matter fractionation and characterization.
In recent decades, animal production in the United States has shifted toward large confinement operations (United States General Accounting Office, 2003). This increase in large-scale operations has raised concerns of their potential environmental effects (Jongbloed and Lenis, 1998; Hanselman and others, 2003). Many large-scale hog farms dispose of their waste in on-site retention basins. The waste-retention basins from these operations have become a topic of public concern due to their odors (Schiffman, 1998) and surface- and ground-water contamination (Campagnolo and others, 2002). Waste-retention basins are open-air pits dug into the earth to temporarily store and process the waste produced by the swine. These pits were designed to break down complex compounds so the waste could subsequently be applied to agricultural fields as a source of fertilizer to crops. Seepage from the waste-retention basins has become a major topic of study in itself (Raman and others, 2004, Chee-Sanford and others, 2001). These anaerobic lagoons contain chemical contaminants, pathogens, hormones, metals, bacteria, nitrates and parasites (Rubin, 1998; Compagnolo and others, 2002; Raman and others, 2004; Kumar and others, 2004).
Although specific compounds have been studied in and nearby waste-retention basins, very few studies have characterized the overall organic material from these basins in detail. A comprehensive approach for dissolved organic matter fractionation and isolation was recently developed (Leenheer and others, 2000) that combines vacuum evaporation with dialysis to isolate colloidal organic matter, resin sorption to isolate dissolved hydrophobic and basic organic matter, and selective salt precipitations combined with vacuum evaporations to isolate dissolved hydrophilic organic matter. This dissolved organic matter isolation method has been applied to fresh surface water (Leenheer and others, 2000), and wastewater effluents and ground waters (Leenheer and others, 2001). However, it had not been applied to waste with substantial colloidal or solid material, such as that from a swine waste-retention basin.
Because seepage, overflows, and land application of waste from waste-retention basins may transport contaminants to nearby surface and ground waters, information about the organic matter from a typical swine waste-retention basin that has been isolated and fractionated is important in order to determine its major chemical characteristics. This report describes a study that expands the dissolved organic matter fractionation analytical scheme of Leenheer and others (2000) to a total organic matter fractionation analytical scheme. The particulate, colloid and dissolved fractions were separated and compared in order to predict modes of contaminant transport and contaminant partitioning on the basis of their chemical composition. The waste-retention basin sampled in July 2003 for this report was considered a typical storage structure for a swine operation (that is, for its size, waste input, and usage).
The waste-retention basin sampled for this study was constructed in 1993 and is located in north central Iowa. The basin is permitted for 1.8 million gallons, with about 1.3 million gallons being pumped out in the spring and fall of each year. No fresh water is added to this basin as it fills with swine waste. This basin received waste from five buildings that housed about 5,700 swine at the time of sampling. The average weight per animal was about 135 pounds at this time. In an effort to reduce the odors from this basin, the operator has added paper cuttings in previous years and soybean stover in the current year (2003).
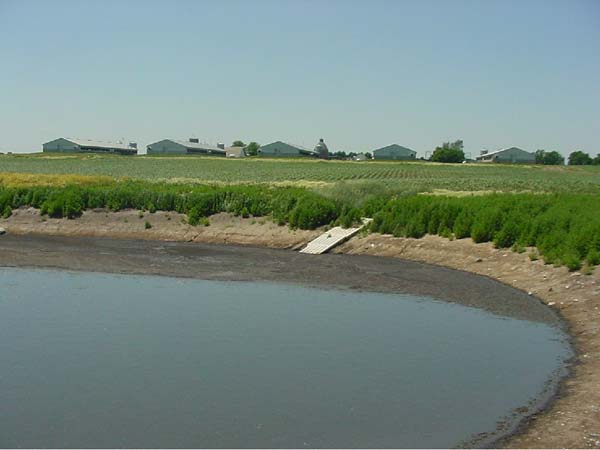
Photograph of swine waste-retention basin (photograph by Jason Smith, U.S. Geological Survey, Iowa District).
Two unfiltered 1-liter samples were collected in amber glass bottles in July, 2003. One sample was collected close to the waste in-flow pipe (north-side sample), and one was collected on the other side of the basin opposite the waste in-flow pipe (south-side sample). The samples were chilled on ice and shipped overnight to the U.S. Geological Survey National Water Quality Laboratory, and immediately analyzed with minimal refrigerated storage to minimize sample degradation.
The north-side sample was fractionated in a comprehensive scheme, presented in figure 1, designed to obtain compound class information for particulate, colloidal, and dissolved organic matter. This is the first comprehensive fractionation scheme designed to include volatile acid and particulate organic matter with the published scheme (Leenheer and others, 2000) for fractionation and analyses of colloidal and non-volatile dissolved organic matter. The south-side sample was used to evaluate a non-comprehensive solvent extraction scheme (fig. 2) for comparison of a typical solvent extraction analyses with the comprehensive analytical approach. This comparison assumes there were no significant differences between the north- and south-side samples as the pH and conductivity values (measured in the laboratory) were identical for these two samples.
Figure 1. Flow chart of total organic matter fractionation for north-side sample.
Figure 2. Flow chart of solvent-extractable organic matter fractionation for south-side sample.
Glass chromatography columns with Teflon end caps were obtained from Spectra/Chrom. Column dimensions for 0.5-L resin-bed volume were 5 centimeter (cm) inside diameter (ID) X 30 cm; 80-milliliter (mL) resin-bed volumes were 1.5 cm ID X 30 cm; and 20-mL resin-bed volumes were 1 cm ID X 28.5 cm. Excess volume in each column was left vacant to allow for resin-bed expansion during different chemical treatments. A reciprocating, ceramic piston pump (FMI Lab Pump Model QD) was used to pump water and reagents through the 1-L and 0.5-L resin-bed columns connected with 3 millimeter (mm) ID, 6 mm outside diameter (OD) FEP Teflon tubing at a flow rate of 250 milliliters per minute (mL/min). A smaller pump (FMI Lab Pump Model RP-SY) was used to pump water and reagents through the 80-mL resin-bed column at a flow rate of 20 mL/min and through the 20-mL resin-bed column at a flow rate of 10 mL/min. These smaller columns were connected to the pump with 1.5-mm-OD, 3-mm-ID Teflon tubing. Selection, preparation, regeneration, capacities, and packing of resin adsorbents has been discussed previously (Leenheer, 1981).
Spectra/Por 3 regenerated cellulose dialysis membrane was used. It had a molecular weight cutoff of 3,500 Daltons. Prior to use, an appropriate length of membrane was cut to accommodate the volume to be dialyzed, and the membrane was washed by soaking it in 4 L of deionized water overnight. For dialysis, the bottom of the dialysis tubing was closed with a plastic snap closure, the solution was poured into the resulting bag using a funnel, and the top of the bag was closed with another closure. Dialysis was then conducted in 4-L Teflon beakers and the solution was stirred with a magnetic stirrer.
For evaporations, a Buchi Rotavapor R had 1-L evaporation and condensation flasks, and its evaporation rate for water was about 0.5 L per hour for a water-bath temperature of 60°C at 750 mm mercury vacuum. The freeze dryer was a Labconco Lyph-Lock 6 Model.
For centrifuge separations, a Sorvall Superspeed RC-2B Refrigerated Centrifuge was used with an angle head. Centrifuge bottles were 250-mL Teflon bottles that were spun at 5,000 rpms for 30 minutes.
Infrared spectra were collected using 2 to 5 milligrams (mg) of organic matter fraction isolates in potassium bromide pellets. The Perkin Elmer System 2000 FT-IR used an infrared source with a pulsed laser carrier and a deuterated triglycine sulfate detector. The instrument was setup to scan from 4,000 to 400 cm-1 averaging 10 scans at 1.0 cm-1 intervals with a resolution of 4.0 cm-1. All spectra were normalized after acquisition to a maximum absorbance of 1.0 for comparative purposes. Peak frequency assignments for compound classes are given in table 1.
CPMAS 13C-NMR spectra were obtained on 5 to 200 mg of organic matter fractions. Freeze-dried samples were packed in ceramic rotors. CPMAS 13C-NMR spectra were obtained on a 200-megahertz (MHz) Chemagnetics CMX spectrometer with a 7.5-mm-diameter probe. The spinning rate was 5,000 Hz. The acquisition parameters included a contact time of 5 milliseconds, pulse delay of 1 second, and a pulse width of 4.5 microseconds for the 90° pulse. Variable contact time studies and comparison of liquid-state with solid state 13C-NMR spectra by Wershaw and others (2000) indicate these are the optimum parameters for quantitatively determining different organic carbon structural group contributions to the NMR spectra. Organic structural assignments for peaks in the CPMAS 13C-NMR spectra are given in table 2.
Table 1. Infrared frequency bands for various structures in DOM isolates
| Compound class | Frequencies (cm-1), structure (ø = aromatic carbon ring), and elements (C=carbon, H=hydrogen, N=nitrogen, O=oxygen) |
|---|---|
| Carbohydrates | 3,400-3,300 (O-H), 1,100-1,000 (C-O) |
| Fulvic acid | 3,400-3,300 (O-H), 2,700-2,500 (COOH), 1,760 (COOR), 1,720 (COOH), 1,660-1,630 (ø-C=O), 1,280-1,150 (ø-O, COOH) |
| Aliphatic hydrocarbons | 2,960 (CH3), 2,940 (CH2), 1,460 (CH2), 1,380 (CH3) |
| Aromatic hydrocarbons | ~1,600 (ø), ~1,500 (ø), 700-900, ø-H |
| Proteins | 1,660 (amide 1 band, N-C=O), 1,540 (amide 2 band, N=C-O) |
| N-acetyl amino sugars | 1,660 (amide 1 band, N-C=O), 1,550 (amide 2 band, N=C-O) 1,380 (CH3) |
| Lipids | 1,760 (COOR), 1,720 (COOH), 2960 (CH3), 2,940 (CH2), 1,460 (CH2), 1,380(CH3) |
Table 2. Structural assignments for 13C-NMR spectra.
[C, carbon; H, hydrogen; N, sulfur; O, oxygen; S, sulfur; ø, aromatic carbon ring]
| Chemical linkage between elements | Compound type | Chemical shift range (parts per million) |
|---|---|---|
| C-H | Aliphatic hydrocarbon | 0-55 |
| C-N | Amines, amides, proteins | 40-55 |
| O-CH3 | Methoxy groups in tannins and lignins | 55-60 |
| C-O | Aliphatic alcohols, ethers, and esters | 60-90 |
| O-C-O | Anomeric carbon in carbohydrates, lactols | 90-110 |
| ø | Aromatic carbon | 95-165 |
| ø-O | Aromatic esters, ethers, and phenols | 135-165 |
| ø-SO3H | Aromatic sulfonic acids | 140-145 |
| O=C-O, O=C-N | Carboxylic acids, esters, amides | 160-190 |
| O=C-C=C | Flavones, quinones | 170-200 |
| O=C-C | Aliphatic and aromatic ketones | 190-220 |
The total organic matter fractionation of the north-side sample is presented in the bar diagram of figure 3. Concentrations of particulate, colloidal, and dissolved organic matter are very large with the total summed organic matter concentration being 32,400 milligrams per liter (mg/L) (3.24 weight percent). In contrast, particulate organic carbon concentrations in major world rivers range from 0.6 to 14.2 mg/L (Ittekkot and Laane, 1991) and dissolved organic carbon concentrations range from 2 to 8 mg/L (Spitzy and Leenheer, 1991). The particulate organic matter fractionation is presented in the bar diagram of figure 4. The majority of particulate organic matter (86 percent) is composed of <61 µm particulates that formed larger floc when acidified to pH 2 with HCl. When this floc particulate fraction was extracted with methylene chloride, 40.3 percent of the mass was extractable as lipids. The three colloid fractions generated by the fractionation scheme of figure 1 are presented in the bar diagram of figure 5. The floc-derived colloid fraction was initially soluble in water, but it precipitated inside the dialysis bag when salts and HCl were removed from the sample during dialysis. The precipitate colloid fraction was initially soluble in the wastewater sample, but it precipitated when the sample was acidified and concentrated during vacuum evaporation. It remained as a precipitate during dialysis to remove salt and acid. The soluble colloid fraction remained soluble during the dialysis step. Most (90 percent) of the dissolved organic matter consists of sodium salts of volatile organic acids as shown in figure 6. Thus, non-volatile dissolved organic matter concentration is lower than particulate and colloidal organic matter concentrations when figure 6 is compared to figure 3. The non-volatile dissolved organic matter fractionation is presented in figure 7 with the hydrophobic neutrals, hydrophobic acids, and base fractions being the major fractions.
Results from the solvent-extractable fractionation of the south-side sample are presented in the bar diagram of figure 8. Solvent-extractable acids constitute the large majority of this fraction, with solvent extractable bases being nearly absent. As the base fraction was a major fraction in the comprehensive fractionation of the north-side sample, this difference indicates that most bases in this wastewater are not solvent extractable. Solvent-extractable organic matter constitutes only 12.1 percent of total organic matter. It is unlikely that the north-side and south-side samples had significantly different concentrations of total organic matter as both samples had identical specific conductance (24.7 millisiemens per centimeter at 25°C) and pH (7.1) values.
Figure 3. Fractionation of total organic matter of north-side sample.
Figure 4. Fractionation of particulate organic matter of north-side sample.
Figure 5. Fractionation of colloidal organic matter of north-side sample.
Figure 7. Fractionation of non-volatile dissolved organic matter in north-side sample.
Figure 8. Organic solvent fractionation of south-side sample.
Infrared spectra of the particulate fractions are presented in figure 9 and 13C-NMR spectra are presented in figure 10. Compound-class assignments were made by comparing the spectra of figures 9 and 10 with spectral peak assignments presented in tables 1 and 2. Spectral analyses of the coarse particulate fraction indicate a mixture of lipid, protein, and carbohydrate that is characteristic of plant and animal biomolecules. Visual examination of this fraction showed short white hairs from swine, and plant and grain fragments from undigested feed. The medium particulate fraction was greatly depleted in protein (peak at 55 parts per million (ppm) in the 13C-NMR spectra) as compared to the coarse particulate fraction. This loss in protein is likely caused by the removal of swine hair (mostly protein) by the sieving process. The fine particulate fraction was depleted of both protein and carbohydrate constituents compared to the larger-size fractions, with lipid components being dominant. Carbohydrates are nearly absent in the floc particulate fraction, with aliphatic lipids constituting the majority of the carbon. The lipids extracted from the floc particulates are dominated by straight chain fatty acids as evidenced by the sharp methylene peaks at 2,920 cm-1 and 1,460 cm-1 in the infrared spectrum and by the 34 ppm peak in the 13C-NMR spectrum. After extraction by methylene chloride, the infrared spectrum of the floc particulates closely matched the spectrum of peptidoglycans derived from a pure culture of the bacterium, bacillus subtilis, as shown in figure 11. Peptidoglycans are the major component of bacterial cell walls, and finding these peptidoglycan components in the floc particulate fraction indicates a bacterial origin for this fraction. The infrared spectrum of the humic acid fraction in figure 9 are similar to the infrared spectrum of the extracted lipid fraction, indicating these humic acids are also lipid-derived.
Figure 9. Infrared spectra of particulate fractions from north-side sample.
Infrared spectra of the colloid fractions are presented in figure 12 and 13C-NMR spectra are presented in figure 13. The spectra of the floc-derived colloid fraction are indicative of a glycoprotein. The solubility behavior of this fraction (soluble with salt water, insoluble in deionized water) indicates this material is a globulin, a major constituent of cellular plasma (White and others, 1964). The spectra of the precipitate colloid fraction is nearly identical to the spectra of the peptidoglycans (fig. 11) discussed previously. Therefore, precipitate colloids are free peptidoglycans in which cellular lipid constituents have been removed by biodegradation or extraction by the isolation procedure. Peaks of the infrared spectrum of the soluble colloid fraction match the peaks for N-acetyl amino sugars listed in table 1, and the 13C-NMR spectrum of this fraction also matches the 13C-NMR spectra of N-acetyl amino sugars colloids isolated from natural surface waters (Leenheer and others, 2000). N-acetyl amino sugars are derived from degradative removal of the peptide from peptidoglycans.
Figure 12. Infrared spectra of colloid fractions from north-side sample.
Figure 13. 13C-NMR spectra of colloid fractions from north-side sample.
Figure 15. 13C-NMR spectra of dissolved fractions from north-side sample.
Figure 16. Infrared spectra of solvent-extractable fractions from south-side sample.
Figure 17. 13C-NMR spectra of solvent-extractable fractions from south-side sample.
Infrared spectra of the dissolved fractions are presented in figure 14 and 13C-NMR spectra are presented in figure 15. The major acid in the volatile acid fraction is acetic acid in the form of its sodium salt as indicated by comparison of the major spectral peaks with the published infrared spectra (Pouchart, 1985) ( peaks at 1,576, 1,011, and 619 cm-1) and 13C-NMR spectra (Simons, 1983) (peak at 22 ppm). In the 13C-NMR spectrum, the broad envelope peak from 0-60 ppm that includes the methyl peak at 13 ppm is indicative of a mixture of longer chain and branched volatile fatty acids. Branched fatty acids, such as isovaleric acid, are partially responsible for the unpleasant odor of swine manure (Gralapp and others, 2001).
For the non-volatile dissolved organic matter fractions, the hydrophobic neutral and transphilic acid fractions were misplaced, and the 13C-NMR spectra were not obtained. The infrared spectrum of the hydrophobic neutral fraction (fig. 14) indicates the major components are ortho-substituted (peaks at 750 and 673 cm-1) aromatic hydrocarbons and aromatic carboxylic acids. Aliphatic hydrocarbons are minor components as indicated by the relatively minor peak at 2,920 cm-1. The infrared spectrum of the hydrophobic acid fraction indicates the major component is hydrocinnamic acid by the exact matches of several spectral peaks with the published spectrum (Pouchart, 1985). The 13C-NMR spectrum of the hydrophobic acid fraction (fig. 15), confirms the hydrocinnamic acid assignment. The transphilic acid plus neutral fractions have infrared peaks ( fig. 14) assigned to carboxylic acid, amide I and amide II bands which indicates this fraction is derived from degradation of proteins and/or N-acetyl amino sugars. The hydrophilic acid plus neutral fractions have the same infrared peaks as the transphilic acid plus neutral fractions, but the carbohydrate component (1,100–1,000 cm-1) is much greater. The 13C-NMR spectrum of the hydrophilic acid plus neutral fraction has a sharp methyl peak at 22 ppm ( fig. 15) that is indicative of N-acetyl hydroxyl acids derived from degradation of N-acetyl amino sugars (Leenheer and others, 2004). The base fraction contains hydrocinnamic acid as a major component. The hydrophobic acid component partially fractionated into the base fraction because it adsorbed on the hydrophobic styrene-divinylbenzene matrix of the cation exchange resin during the fractionation procedure. The small broad peak near 55 ppm in the 13C-NMR spectrum of the base fraction (fig. 15) is characteristic of basic peptides with the amide carbonyl peak of these peptides being at 177 ppm.
Infrared spectra of the dissolved fractions are presented in figure 16 and 13C-NMR spectra are presented in figure 17. Interpretation of the spectra of the solvent-extractable acid fraction indicates a mixture of aliphatic straight and branched-chain fatty acids, and hydrocinnamic acid as the aromatic acid. Acetic acid, the dominant volatile acid, was not detected because it was lost during evaporation of the solvent. The solvent extractable neutral fraction is mostly long-chain aliphatic fatty acids that did not back-extract into water as sodium salts. The ortho-disubstituted aromatic hydrocarbons found in the hydrophobic neutral fraction also were found in this solvent-extractable neutral fraction. The infrared spectrum of the small solvent extractable base fraction indicated straight chain aliphatic amines.
Organic matter in wastewater from a swine waste-retention basin mainly consists of volatile fatty acids and bacterial cellular constituents (aliphatic straight-chain lipids and peptidoglycans). Volatile fatty acids, especially acetic acid, are produced as metabolites in both aerobic and anaerobic (fermentation) biodegradation processes (White and others, 1964; Gibson, 1984). Fermentation of organic wastes also produces large concentrations of volatile alcohols, aldehydes, and hydrocarbons, but these compound classes were not recovered or analyzed by this study.
Natural hormones (Raman and others, 2004; Hanselman and others, 2003) as well as veterinary pharmaceuticals (Pierini and others, 2004; Kumar and others, 2004; Cromwell, 2002; Campagnolo and others, 2002; Boxall and others, 2003) are associated with swine wastes. Significant concentrations of non-polar hormones and pharmaceuticals, such as tetracycline, likely partition into non-polar aliphatic straight chain lipids found in the particulate fractions. Thus, measuring hormone and pharmaceutical concentrations of filtered liquid swine waste from a waste-storage basin could greatly underestimate total residues actually present in such samples.
Peptidoglycans are unique constituents of microbial cells, especially the N-acetyl muramic acid monomeric constituent. Peptidoglycan constituents found in the wastewaters may simply be the fragments of bacterial cell walls after the cells are attacked by bacteriophage viruses as shown in the following reaction sequence:
The detection of globulins in the silt-derived colloid fraction indicates that plasma proteins in living bacterial cells were released by the analytical procedure. The multiple extraction and freeze-drying steps of figure 1 rupture cellular membranes and release cellular plasma constituents such as globulins into solution. Thus, much of the particulate and colloidal material in the wastewater likely consists of living microbial biomass.
Animal feed residues in these wastewaters should be detectable as polysaccharide and lignin components in the particulate fractions; however, the particulate fractions contain only small amounts of polysaccharide and no detectable amounts of lignin. The fate of lignin components is indicated by the detection of hydrocinnamic acid in the hydrophobic acid fraction.
Lignin is known to bacterially degrade under anaerobic conditions to produce methane and other by-products (Young, 1984). A proposed pathway (Healy and others, 1980) for the degradation of ferulic acid, a lignin monomer, is presented in the following reaction.
Other lignin monomers, such as caffeic acid and homoprotocatechuic acids, also lost ring substituents during anaerobic biodegradation (Young, 1984). These losses of ring substituents and propane side chain result in the loss of lignin identity with regards to spectra characterizations, but hydrocinnamic acid is an intermediate metabolite that indicates lignin as a precursor.
The solvent extraction scheme that was applied to the south-side sample only recovered 3,927 mg of organic matter as compared to 32,413 mg of organic matter recovered for the comprehensive fractionation scheme for the north-side sample. If the organic matter concentrations of the two samples are equivalent, the solvent extraction scheme of figure 2 recovered only 12 percent the organic matter as the comprehensive fractionation scheme of figure 1. Particulate, colloidal, and non-extractable polar dissolved organic matter was not recovered by the solvent extraction scheme.
Fractionation and spectral analyses of particulate, colloid, and dissolved organic fractions isolated from wastewater from a swine waste-retention basin indicate the bulk of the organic matter consists of microbial cellular constituents and their degradation products. This total organic matter fractionation analysis was the first comprehensive analysis that included particulate organic matter. The compound-class composition of each of these fractions was determined by infrared and 13C-NMR spectral analyses. Volatile acids were the largest fraction with acetic acid being the major component of this fraction. The second most abundant fraction was fine particulate organic matter that consisted of bacterial cells that were subfractionated into extractable lipids consisting of straight chain fatty acids, peptidoglycans components of bacterial cell walls, and protein globulin components of cellular plasma. This inclusion of particulate organic matter in the analytical approach provided valuable insights about the origin and processes that produce particulate, colloid, and dissolved organic matter in this wastewater. The large lipid content of the particulate fractions indicates that non-polar contaminants, such as certain pharmaceuticals added to swine feed, likely associate with the particulate organic matter through partitioning interactions. The finding of hydrocinnamic acid indicates an anaerobic process of lignin degradation in this wastewater.
Use of trade names is for identification purposes only and does not constitute endorsement by the U.S. Geological Survey (USGS). The authors would like to thank Kent Becher and Jason Smith, USGS, Iowa District, for collecting the swine waste samples used for this study. Dana Kolpin, USGS, Iowa District, provided background references, and review of the report. Robert Wershaw assisted in the acquisition of the 13C-NMR spectral and also reviewed the report. The authors also acknowledge the U.S. Geological Survey Toxic Substances Hydrology Program for its support of this research.
Boxall, A.B.A., Kolpin, D.W., Halling-Sorensen, Brent, and Tolls, Johannes, 2003, Are veterinary medicines causing environmental risks?: Environmental Science and Technology, v. 37, p. 286A-294A.
Chee-Sanford, J.C., Aminov, R.I., Krapac, I.J., Garrigues-Jeanjean, Natalie, and Mackie, R.I., 2001, Occurrence and diversity of tetracycline resistance genes in lagoons and groundwater underlying two swine production facilities: Applied and Environmental Microbiology, v. 67, p. 1494-1502.
Cromwell, G.L, 2002, Why and how antibiotics are used in swine production?: Animal Biotechnology, v. 13, p. 7-27.
Compagnolo, E.R., Johnson, K.R., Karpati, Adam, Rubin, C.S., Kolpin, D.W., Meyer, M.T., Esteban, J.E., Currier, R.W., Smith, Kathleen, Thu, K.M., and McGeehin, Michael., 2002, Antimicrobial residues in animal waste and water resources proximal to large-scale swine and poultry feeding operations: The Science of the Total Environment, No. 299, p. 89-95
Gralapp, A.K., Powers, W.J., and Bundy, D.S., 2001, Comparison of olfactometry, gas chromatography, and electronic noise technology for measurement of indoor air from swine facilities: Transactions of American Society of Agricultural Engineers, v. 16, p. 621-627.
Gibson, D.T., ed., 1984, Microbial Degradation of Organic Compounds: New York, Marcel Dekker, Inc., 535 p.
Hanselman, T.A., Graetz, D.A., and Wilkie, A.C., 2003, Manure-borne estrogens as potential environmental contaminants: A review: Environmental Science and Technology, v. 24, p. 5471-5478
Jongbloed, A.W., and Lenis, N.P., 1998, Environmental concerns about animal manure: Journal of Animal Science, v. 76, p. 2641-2648.
Healy, J.B., Jr., Young, L.Y., and Reinhard, Martin, 1980, Methanogenic decomposition of ferulic acid, a model lignin derivative: Applied and Environmental Microbiology, v. 39, p. 436-444.
Ittekkot, Venu, and Laane, R.W.P.M., 1991, Fate of riverine particulate organic matter, in Degens, E.T., Kempe, Stephan, and Richey, J.E., eds., Biogeochemistry of major world rivers: New York, Wiley, p. 233-243.
Kumar, Kuldip, Thompson, Anita, Singh, A.K., Chander, Yogesh, and Gupta, S.C., 2004, Enzyme-linked immunosorbent assay for ultratrace determination of antibiotics in aqueous samples: Journal of Environmental Quality, v. 33, p. 250-256.
Leenheer, J.A., 1981, Comprehensive approach to preparative isolation and fractionation of dissolved organic carbon from natural waters and wastewaters: Environmental Science and Technology, v. 15, p. 578-587.
Leenheer, J.A., Croue, J.-P., Benjamin, Mark, Korshin, G.V., Hwang, C.J., Bruchet, Auguste, and Aiken, G.A., 2000, Comprehensive isolation of natural organic matter for spectral characterization and reactivity testing. in Barrett, S.E., Krasner, S.W., Amy, G.L. eds., Natural organic matter and disinfection by-products, American Chemical Society Symposium Series 761: Washington, D.C., American Chemical Society, p. 68-83.
Leenheer, J.A., Hsu, John, and Barber, L.B., 2001, Transport and fate of organic wastes in groundwater at the Stringfellow hazardous waste disposal site, sourthern California: Journal of Contaminant Hydrology, v. 51, p. 163-178.
Leenheer, J.A., Noyes, T.I., Rostad, C.E., and Davisson, M.L., 2004, Characterization and origin of polar dissolved organic matter from the Great Salt Lake: Biogeochemistry, v. 69, p. 125-141.
Pierini, Elisabetta, Famiglini, Georgio, Mangani, Filippo, and Cappiello, Achille, 2004, Fate of enrofloxacin in swine sewage: Journal of Agricultural and Food Chemistry, v. 52, p. 3473-3477.
Pouchart, C.J., 1985, The Aldrich Library of FT-IR Spectra, Edition 1: Milwaukee, Wisconsin, Aldrich Chemical Company, Inc.
Raman, D.R., Williams, E.L., Layton, A.C., Burns, R.T., Easter, J.P., Daugherty, A.S., Mullen, M.D., and Sayler, G.S., 2004, Estrogen content of dairy and swine wastes: Environmental Science and Technology, v. 38, p. 3567-3573.
Rubin, C.S., 1998, Report to the State of Iowa Department of Public Health on the investigation of the chemical and microbial constituents of ground and surface water proximal to large-scale swine operations: National Center for Environmental Health, Centers for Disease Control and Prevention, October-December 1998, 19 p.
Schiffman, S.S., 1998, Livestock odors: Implications for human health and well-being: Journal of Animal Science, v. 76, p. 2641-2648.
Simons, W.W., 1983, The Sadtler guide to carbon-13 NMR spectra: Philadelphia, Sadler Research Laboratories.
Spitzy, Alejandro, and Leenheer, J.A., 1991, Dissolved organic carbon in rivers, in Degens, E.T., Kempe, Stephan, and Richey, J.E., eds., Biogeochemistry of major world rivers: New York, Wiley, p. 213-232.
United States General Accounting Office, 2003, Livestock Agriculture—Increased EPA oversight will improve environmental program for concentrated animal feed operations: GAO-03-285 (www.gao.gov/cgi-bin/getrpt?GAO-03-285).
Wershaw, R.L., Aiken, G.R, Leenheer, J.A., and Tregellas, J.R., 2000, Structural-group quantitation by CP/MAS 13C NMR measurements of dissolved organic matter from natural surface waters, in Davies, Geoffrey, and Ghabbour, E.A., eds., Humic Substances—Versatile components of plants, soils and water: Cambridge, Royal Society of Chemistry, p. 63-81.
White, Abraham, Handler, Philip, and Smith, E.L., 1964, Principles of biochemistry, 3rd ed., New York, McGraw-Hill.
Young, L.Y., 1984, Anaerobic degradation of aromatic compounds, in Gibson, D.T., ed., Microbial degradation of organic compounds: New York, Marcel Dekker, Inc., p. 487-523.
Document Accessibility: Adobe Systems Incorporated has information about PDFs and the visually impaired. This information provides tools to help make PDF files accessible. These tools convert Adobe PDF documents into HTML or ASCII text, which then can be read by a number of common screen-reading programs that synthesize text as audible speech. In addition, an accessible version of Acrobat Reader 6.0, which contains support for screen readers, is available. These tools and the accessible reader may be obtained free from Adobe at Adobe Access.
| AccessibilityFOIAPrivacyPolicies and Notices | |
 |
|