
In cooperation with the Wisconsin Department of Natural Resources
1U.S. Geological Survey, Middleton, Wisconsin
2Wisconsin Department of Natural Resources, Madison, Wisconsin
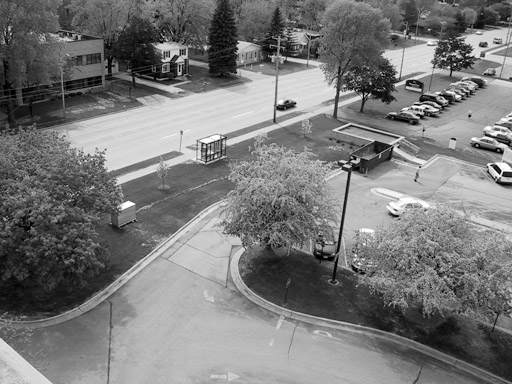
Drainage basin view that includes the parking lot and gaging station
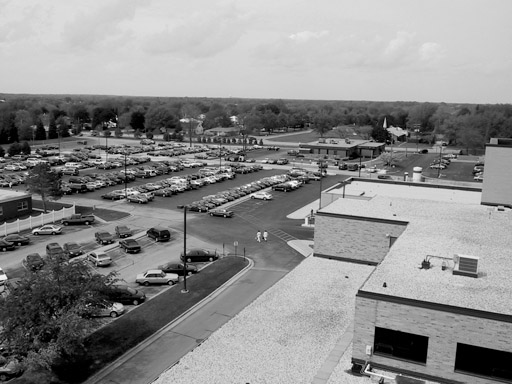
Drainage basin view of the parking lot and rooftop
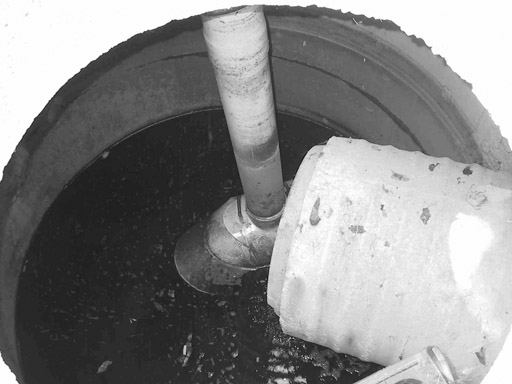
Top view of the flow splitter
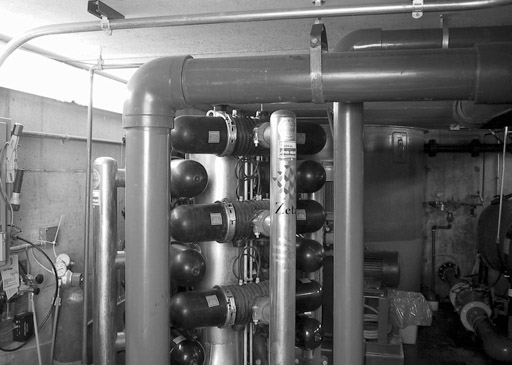
View of the first pressurized stormwater filtration system unit (disk-filter tower)
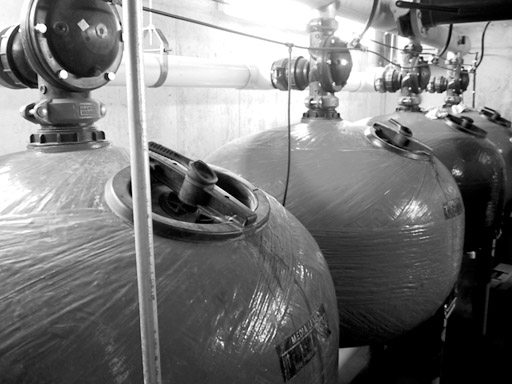
View of the second pressurized stormwater filtration system unit (sand filters)
Design of the Pressurized Stormwater Filtration System
Evaluation of the Pressurized Stormwater Filtration System
Figure 1. Plan view of St. Mary's Hospital, Green Bay, Wis. (Arkal Filtrati...
Figure 2. Cumulative rainfall distributions for the study period compared t...
Figure 3. Map showing the depth of retained sediment in the flow splitter, ...
Figure 4. Particle-size distributions in inlet samples from six events and ...
Table 1. Characteristics of the drainage area that contributes runoff to t...
Table 2. Constituent list, limits of detection, and analytical methods for ...
Table 3. Concentrations of blanks and replicate samples for quality control...
Table 4. Downtime of the pressurized stormwater filtration system during t...
Table 5. Comparison of monthly rainfall between the U.S. Geological Survey ...
Table 6. Rainfall and runoff statistics for sampled events at the pressuriz...
Table 7. Percentage of runoff and inlet volumes for the pressurized stormwa...
Table 8. Event mean concentrations of 15 events during testing of the press...
Table 9. Comparison of average event mean concentrations from several studi...
Table 10. Results of ground-water-seepage samples collected in the storm-s...
Table 11. Sum of loads for 15 events during testing of the pressurized stor...
Table 12. Results of sand/silt split sediment analysis at the inlet and the...
Table 13. Particle-size distribution determined from samples taken during s...
Table 14. Particle-size distribution for the sediment samples collected in ...
| Multiply | By | To obtain |
|---|---|---|
| Length | ||
| inch (in.) | 2.54 | centimeter (cm) |
| foot (ft) | 0.3048 | meter (m) |
| millimeter (mm) | .3937 | inch (in.) |
| Area | ||
| acre | 4,047 | square meter (m2) |
| square foot (ft2) | 929.0 | square centimeter (cm2) |
| Volume | ||
| gallon (gal) | 3.785 | liter (L) |
| gallon (gal) | 0.003785 | cubic meter (m3) |
| cubic foot (ft3) | 0.02832 | cubic meter (m3) |
| liter (L) | 0.03531 | cubic foot (ft3) |
| Flow rate | ||
| foot per second (ft/s) | 0.3048 | meter per second (m/s) |
| cubic foot per second (ft3/s) | 0.02832 | cubic meter per second (m3/s) |
| gallon per minute (gal/min) | 0.06309 | liter per second (L/s) |
| Mass | ||
| gram (g) | 2.20 x 10⁻³ | pound, avoirdupois (lb) |
| pound, avoirdupois (lb) | 0.4536 | kilogram (kg) |
Concentrations of chemical constituents in water are given either in milligrams per liter (mg/L) or micrograms per liter (µg/L). Another unit of measurement used in this report is micrometers (µm).
A pressurized stormwater filtration system was installed in 1998 as a stormwater-treatment practice to treat runoff from a hospital rooftop and parking lot in Green Bay, Wisconsin. This type of filtration system has been installed in Florida citrus groves and sewage treatment plants around the United States; however, this installation is the first of its kind to be used to treat urban runoff and the first to be tested in Wisconsin. The U.S. Geological Survey (USGS) monitored the system between November 2000 and September 2002 to evaluate it as part of the U.S. Environmental Protection Agency's Environmental Technology Verification Program. Fifteen runoff events were monitored for flow and water quality at the inlet and outlet of the system, and comparison of the event mean concentrations and constituent loads was used to evaluate its effectiveness. Loads were decreased in all particulate-associated constituents monitored, including suspended solids (83 percent), suspended sediment (81 percent), total Kjeldahl nitrogen (26 percent), total phosphorus (54 percent), and total recoverable zinc (62 percent). Total dissolved solids, dissolved phosphorus, and nitrate plus nitrite loads remained similar or increased through the system. The increase in some constituents was most likely due to a ground-water contribution between runoff events. Sand/silt split analysis resulted in the median silt content of 78 percent at the inlet, 87 percent at the outlet, and 3 percent at the flow splitter.
In 1978, the U.S. Environmental Protection Agency (USEPA) established the Nationwide Urban Runoff Program (NURP) to assess the water-quality characteristics of urban runoff. When the city of Milwaukee, Wisconsin, was chosen by the EPA as a NURP site, a partnership between the Wisconsin Department of Natural Resource (WDNR) and the U.S. Geological Survey (USGS) was developed to evaluate urban runoff in Milwaukee. Since the NURP study, the USGS and the WDNR have continued their partnership and have completed more than 15 studies in 6 different cities to assist the State of Wisconsin in characterization of urban stormwater runoff. The study described herein will provide additional information to meet the partnership goals of understanding urban runoff.
The NURP project and other projects have provided information needed to set cost-effective and achievable goals for the USEPA's National Pollutant Discharge Elimination System Permit Program (NPDES) as amended in the Clean Water Act. The NPDES Phase I program requires municipalities with populations greater than 100,000 to apply for a NPDES permit, which requires stormwater-management controls to reduce pollutant discharge (U.S. Environmental Protection Agency, 2000). The NPDES Phase II program was developed to reduce pollutant discharges in urban areas of populations with less than 100,000 and at smaller construction sites. For the NPDES Phase II program, individual states establish specific pollutant-reduction criteria to minimize adverse effects from urban stormwater on water quality of receiving streams. To meet these requirements, NPDES permit holders may choose any available stormwater-treatment practice; however, data on selection, efficiency, and maintenance of these management practices is currently insufficient.
In 1999, the USEPA established the Environmental Technology Verification Program (ETV), setting a national focus on verifying manufacturer's claims for commercially available stormwater-treatment practice efficiencies; this study described herein is the first of such studies to be completed. The USEPA cooperated with the National Sanitation Foundation International (NSF International) as its verification partner, and NSF is in charge of the following tasks: (1) create a national protocol to test wet-weather flow technologies, (2) contract independent groups to evaluate the effectiveness of the stormwater-treatment practices of interest, (3) review and implement the verification testing plans, and (4) make study results available to the general public (U.S. Environmental Protection Agency, 2002). Municipalities and other interested parties will then have access to all ETV program results to help them make informed decisions on the choice of stormwater-treatment practices for their stormwater-management programs. Results from this study were forwarded to ETV personnel for their final verification reporting (U.S. Environmental Protection Agency, 2004).
In 1998, a pressurized stormwater filtration system (the Arkal Filtration System, manufactured by Zeta TechnologyTM) was installed by private contractors at St. Mary's Hospital in Green Bay, Wis., to treat roof and parking lot runoff. This particular PSF system consists of two types of filtering units. After a 50-µm disk system prefilters particulates, an array of sand filters then removes particles of smaller size. This type of filtration system has been installed in Florida citrus groves and sewage treatment plants around the United States; however, this installation is the first of its kind to be used to treat urban runoff and the first to be tested in Wisconsin.
This pressurized stormwater filter is one of ten such stormwater-treatment practices that the WDNR and USGS have examined to evaluate water-quality effects. Three of these studies are in cooperation with the ETV program.
The primary objective of this report is to describe the effectiveness of the PSF system in removing a suite of inorganic and physical water-quality constituents from stormwater runoff. This report also describes methods and techniques used to determine the effectiveness of the PSF and presents results from data collection and analysis of 15 runoff events (greater or equal to 0.2" of rainfall) monitored at the inlet and outlet to the system between November 2000 and September 2002. Detailed data concerning water quality, flow, constituent loadings, and efficiencies of removal are presented.
A revision to the Clean Water Act in 1987 recognized stormwater discharges as a point source. Since then the U.S. Geological Survey (USGS) and Wisconsin Department of Natural Resources (WDNR) have conducted projects to understand the water-quality characteristics of stormwater in the State of Wisconsin. Another primary objective of this report is to add to the understanding of stormwater quality and quantity in the urban environment. The USGS role in monitoring stormwater treatment practices is to collect and evaluate how these systems could reduce pollutant discharges to nearby waterways.
The authors thank the following people, without whose help this project could not have been completed:
The PSF was manufactured by ZetaTM Technology and installation was completed at St. Mary's Hospital in December 1998. The shelter for the system is set 4 ft below ground; the roof is 2 ft above ground, covering 300 ft2. The system was designed to minimize the amount of aboveground space needed. Runoff from the site drains to a municipal storm sewer, and subsequently into Beaver Dam Creek (a tributary of Duck Creek) and eventually discharges into Green Bay (Lake Michigan).
Stormwater runoff at the hospital passes through an 18-in. inlet pipe to a 6-ft-diameter flow splitter (fig. 1). The flow splitter has two possible exits: a 15-in. PVC pipe that drains to a 9,200 ft3 holding tank, and an 18-in. pipe that serves as a high-flow bypass. The 15-in. pipe is 1.8 ft lower in elevation than the inlet pipe, whereas the bypass is at the same elevation as the inlet pipe. The 15-in pipe is elevated 30 in. above the bottom of the flow splitter, which enables larger particles to be retained in the flow splitter. The holding tank volume of 9,200 ft3 is designed to hold runoff from a 2-year, 30-minute duration event, which is equivalent to 0.54 in. of runoff depth over the drainage area. A design with this capacity will capture approximately 76 percent of the total average annual rainfall depth (Bachhuber and others, 2001). The holding tank is equipped with an electric pump that feeds the filtration system. The pump is triggered when the water level in the holding tank exceeds a preset high-flow water-surface elevation, and it is turned off when the water level drops below a low-flow elevation. A detailed description of the PSF system is included in Bachhuber and others (2001).
Figure 1. Plan view of St. Mary's Hospital, Green Bay, Wis. (Arkal Filtrations System).
The system pumps stormwater through two pressurized filter units at an approximate rate of 450 gal/min, or 1 ft3/s. The first unit consists of four filter towers with three disk-filter units per tower (Bachhuber and others, 2001). Each disk-filter unit has 40—50 rings designed to remove particles greater than 50 µm. An individual tower automatically goes through a backwashing cycle when the pressure differential across the filter rings exceeds a preset level; the other three towers continue to process stormwater to the second filtration unit. The backwash water flows to a backwash tank that drains to the sanitary sewer.
The stormwater is passed to a second filtration unit that has a series of five 48-in. diameter sealed filter tanks filled with sand. These filter tanks are designed to remove particles greater than 5 µm. Each of the filter tanks undergoes a similar backwashing cycle as the first unit while the other four filter tanks process stormwater. The manufacturer states that 80 percent of suspended solids greater than 5 µm will be removed (Bachhuber and others, 2001).
The filtration system treats runoff from 5.5 of the 21 acres of St. Mary's Hospital (table 1). The largest percentage of the treated drainage area is a parking lot for patients and staff, with a capacity of approximately 200 cars. This parking lot is swept in the spring and an additional 1—2 times each year. Sand and salt are applied periodically during the cold weather for snow and ice control. Fertilizer and pesticides are applied to the lawn area during spring and fall (Bachhuber and others, 2001).
| Land use | Acres | Percent of total runoff contributed |
|---|---|---|
| Rooftops | 1.45 | 26 |
| Parking lots | 3.50 | 64 |
| Lawn | 0.55 | 10 |
Fifteen nonconsecutive runoff events greater than or equal to 0.2 inches of rainfall were sampled over a 2-year monitoring period. The inlet, the outlet, and the bypass pipes were equipped for monitoring flow and water quality into and out of the system (fig. 1). Electromagnetic velocity meters were used to measure velocity in the inlet and bypass pipes, and pressure transducers were used to measure water level. A separate backup pressure transducer was installed at the inlet site in case of malfunctions with the area-velocity meters. Flow at each site was calculated by multiplying the velocity by the cross-sectional area based on the water level. A Doppler-type area-velocity meter between two pressurized valves on the 6-in. outlet pipe was used for measuring pipe-full conditions. Flow was calculated by multiplying the measured velocity by the entire cross-sectional area of the 6-in. pipe. Continuous water levels were also recorded by pressure transducers inside the holding tank and flow-splitter.
Automatic samplers were programmed to collect flow-weighted samples when the water level exceeded a threshold level. In this respect, the sampling frequency increased or decreased to reflect the magnitude of flow. Flow-weighted sampling allowed for the collection of one composite runoff-event sample consisting of numerous subsamples throughout the hydrograph. This approach resulted in a single average or "event mean" concentration for each runoff event. The data logger in the monitoring station was programmed to initiate a subsample for a predefined volume of flow; consequently, more subsamples were collected for large-volume events than for small-volume events. The volume between subsamples was determined such that a minimum of five 1-L subsamples were collected for each event, and the sampler capacity was 40 1-L subsamples.
The initial constituent list was based on constituents that the device may reduce, according to the manufacturer. Concentrations of additional constituents (table 2) were measured to help urban land managers base stormwater-management decisions on scientific data.
[mg/L, milligrams per liter; µg/L micrograms per liter; NA, nonapplicable]
| Constituent or characteristic | Unit | Limit of detection | Limit of quantification | Method |
|---|---|---|---|---|
| Total dissolved solids | mg/L | 5 | NA | SM2540C1 |
| Total suspended solids3 | mg/L | 5 | NA | EPA 160.22, 3 |
| Total Kjeldahl nitrogen | mg/L | 0.14 | 0.4 | EPA 351.22 |
| Nitrate plus nitrite as N | mg/L as N | .01 | .031 | EPA 353.22 |
| Dissolved phosphorus | mg/L as P | .002 | .005 | EPA 365.12 |
| Total phosphorus | mg/L as P | .005 | .016 | EPA 365.12 |
| Total recoverable calcium4 | mg/L | .02 | .06 | EPA 200.71, 4 |
| Total recoverable magnesium4 | mg/L | .03 | .1 | EPA 200.71, 4 |
| Total recoverable zinc4 | µg/L | 19 | 62 | EPA 200.91, 4 |
| Suspended sediment concentration | mg/L | .5 | NA | Knott, 1993 |
| Sand-silt split | NA | NA | NA | Guy, 1977 |
| Five-point Sedigraph (fall diameter) | NA | NA | NA | USGS, 1993 |
| Sand fractionation | NA | NA | NA | Guy, 1977 |
1 American Public Health Association and others, 1989 SM (Standard Methods).
2 U.S. Environmental Protection Agency (EPA) (1979).
3 Manufacturer states that 80 percent of the particles larger than 5 µm can be controlled.
4 Samples for the first four events were analyzed by Method sw846, 6010B; in the spring of 2001.
Two blank samples were collected at the inlet and outlet and analyzed for the same constituents as those from runoff-event samples (table 3). The first sample was collected at the beginning of the project before event sampling began, and the second blank was collected in the middle of the project to validate clean sampling procedures. Values from the blank samples were all below detection limits, indicating that sampling methods did not introduce contamination (table 3). Replicate samples were collected during events 9 and 13 to quantify variability in the sampling process. Replicates of samples from event 9 resulted in relative percent difference (RPD) of less than 15 percent for 8 of 9 constituents at the inlet (the exception was total Kjeldahl nitrogen (TKN), at 24 percent) and 7 of 9 constituents at the outlet (the exceptions were total suspended solids (TSS), 36 percent; and TKN, at 29 percent). Replicates from event 13 samples resulted in RPDs of less than 15 percent for all but two constituents at the inlet (calcium, at 20 percent; and magnesium, at 20 percent) and all but one constituent at the outlet (TKN, at 17 percent).
Table 3. Concentrations of blanks and replicate samples for quality control.
[mg/L, milligrams per liter; µg/L, micrograms per liter; <, less than]
| Quality - control sample | Date | Dissolved solids, total (mg/L) | Suspended solids, total (mg/L) | Kjeldahl nitrogen, total (mg/L) | Nitrate plus nitrite as nitrogen (mg/L) | Phosphorus, dissolved (mg/L) | Phosphorus, total (mg/L) | Zinc, total (mg/L) | Calcium, total (mg/L) | Magnesium, total (mg/L) | |||||||||
|---|---|---|---|---|---|---|---|---|---|---|---|---|---|---|---|---|---|---|---|
| Inlet | Outlet | Inlet | Outlet | Inlet | Outlet | Inlet | Outlet | Inlet | Outlet | Inlet | Outlet | Inlet | Outlet | Inlet | Outlet | Inlet | Outlet | ||
| Blank 1 | 11/09/00 | <7 | <7 | <5 | <5 | <0.14 | <0.14 | <0.010 | <0.010 | <0.005 | <0.005 | <0.005 | <0.005 | <19 | <19 | 0.05 | 0.34 | <0.03 | 0.17 |
| Blank 2 | 06/25/01 | <20a | <20a | <5 | <5 | .24 | <.14 | <.010 | <.010 | <.005 | <.005 | <.005 | <.005 | <19 | <19 | .22 | .05 | .12 | <.03 |
| Replicate 1a (event 9) | 04/27/02 | 174 | 448 | 25 | 9 | .33 | .35 | .393 | .839 | .022 | .021 | .069 | .051 | 35 | 26 | 13.20 | 33.30 | 5.4 | 14.90 |
| Replicate 1b (event 9) | 04/27/02 | 170 | 470 | 25 | 13 | .42 | .47 | .386 | .858 | .021 | .021 | .068 | .049 | 37 | 25 | 13.00 | 32.70 | 5.2 | 14.70 |
| Replicate 2a (event 13) | 06/21/02 | 122 | 574 | 88 | 8 | .84 | .57 | .623 | 1.340 | .016 | .008 | .114 | .034 | 73 | 21 | 21.10 | 51.90 | 9.8 | 25.60 |
| Replicate 2b (event 13) | 06/21/02 | 110 | 582 | 85 | 7 | .79 | .48 | .637 | 1.360 | .015 | .007 | .114 | .034 | 69 | 21 | 17.90 | 51.50 | 8.0 | 25.40 |
a The limit of detection for total dissolved solids was increased by the Wisconsin State Laboratory of Hygiene in June of 2001.
Several unforeseen complications in maintaining the filtration system arose during this project. These complexities prevented sampling of consecutive runoff events and resulted in extension of the project by a year. Some of these problems are described below. Periods of downtime during the study are listed in table 4.
| Beginning Date | End date | Number of days | Problem |
|---|---|---|---|
| 03/27/01 | 04/04/01 | 8 | Media replacement on second unit |
| 04/28/01 | 05/31/01 | 33 | Backwash tank clogged |
| 06/18/01 | 06/20/01 | 2 | Biomass clog on disk filters |
| 08/09/01 | 08/22/01 | 13 | Biomass clog on disk filter |
| 09/08/01 | 09/10/01 | 2 | Biomass clog on filter disk |
| 11/02/01 | 12/05/01 | 34 | Maintenance |
| 05/06/02 | 05/09/02 | 3 | Plastic bag clogging filter |
| 08/27/02 | 09/03/02 | 7 | Maintenance |
A bypass pipe in the flow splitter was designed to allow high flow (that which exceeded the treatment capacity of the system) to discharge directly to the storm sewer system (fig. 1). The low elevation of the bypass pipe, however, allowed filtered water that had been discharged to the receiving storm sewer to drain back into the flow splitter. This backflow could possibly skew results from the outlet during a runoff event. Therefore, in January 2001, a backflow preventer (a door flap in front of the pipe) was installed to prohibit treated water from draining back into the flow splitter.
The system was sampled during a test period of the monitoring equipment in March 2000. Large black particles were observed in the sampled filtered water. It was determined that the particles were passing through the sand media of the secondary filtering unit. The sand was replaced in accordance with the 2-year life expectancy of the media.
The filter was not operational from April 2001 through May 2001 because the sanitary pipe that services the backwash tank was clogged. To repair this problem, hospital maintenance constructed an access door through the roof of the filter house. The backwash tank was then dewatered, the sanitary pipe flushed out, and the valve leading to the sanitary pipe was enlarged to prevent future clogging.
In June 2001, the disk filters in the first filtering unit became fouled by a buildup of biomass film. The backwash system could not completely flush the disc filters free of the film, which then fostered biomass for regrowth after the system was turned off. This continual regrowth on the filters increased the frequency with which the system went into the backwash mode. In October 2001, the system was sanitized with a chlorinated disinfecting rinse. After the rinse, biomass did not build up again during the monitoring period.
Continuous ground-water flow entering the storm sewer system filled the tank every 2–3 days, triggering the pump and filter operation during nonevent periods. To prevent sample collection during nonevents, the filter was put into a nonevent mode through data logger phone communication from the USGS office in Middleton. A few runoff events were missed because communications difficulties prevented event samplers from being turned on. These difficulties included power to the site being tripped by a power surge or lightning and cellular phone communication problems.
A tipping-bucket rain gage was used for continuous measurement of rainfall. A data logger recorded the number of bucket tips (0.01 in. per tip) every 60 seconds. This gage was not designed to record frozen precipitation so values during periods of snowfall and freezing rain were not used. Calibration data showed there was no need to adjust rainfall data. A comparison of the data collected during this study to data from the National Oceanic and Atmospheric Administration rain gage at Green Bay (about 3 mi southwest of St. Mary's Hospital) on a monthly basis also indicated that the rain gage was working properly throughout the period (table 5). A comparison of rainfall during the study period to the 10-year average rainfall in Green Bay shows that rainfall was below average during the study period (table 5).
[Rainfall is presented in inches; ASIA, Austin Straubel International Airport; NOAA National Oceanic and Atmospheric Administration; --, no data]
| Month | USGS rain gage 2001 water year | USGS rain gage 2002 water year | NOAA ASIA 2001 | NOAA ASIA 2002 | Percent difference 2001 | Percent difference 2002 | NOAA Normal 1991—2000 |
|---|---|---|---|---|---|---|---|
| October | -- | 1.5 | 0.5 | 1.7 | -- | -14 | 2.2 |
| November | 0.8 | 1.7 | 1.3 | 1.7 | -34 | 2 | 2.3 |
| December | 0.0 | 1.2 | 1.2 | 1.2 | -100 | -4 | 1.4 |
| Winter months not included | |||||||
| April | 3.6 | 3.5 | 3.7 | 3.0 | -1 | 16 | 2.6 |
| May | 3.8 | 2.8 | 4.7 | 2.8 | -21 | -1 | 2.8 |
| June | 4.4 | 3.8 | 5.2 | 4.7 | -15 | -20 | 3.4 |
| July | 0.9 | 2.3 | 0.9 | 2.2 | 7 | 7 | 3.4 |
| August | 4.2 | 2.8 | 3.4 | 4.0 | 21 | -31 | 3.8 |
| September | 1.8 | 2.4 | 2.4 | 2.7 | -22 | -10 | 3.1 |
| Totals | 22.25 | 24.2 | 25.9 | 28.2 | -14 | -14 | 29.2 |
Stage measurements were adjusted by applying corrections that reflect differences between water-surface elevations that were measured manually and those measured by the area-velocity meter. Flow measurements at the inlet were calibrated by computing a water mass-balance between the calculated flow at the inlet and the holding tank during periods when the filter pump was not operating. The change in volume in the holding tank during these periods was compared against the summation of volume calculated from velocity and stage measurements at the inlet. Of the 29 events used to complete the calibration, the maximum difference between the calculated volumes was -12 percent. The average difference for the inlet calibration was 0.1 percent.
For the purpose of collecting volume-weighted samples, the flow calculated from velocity measurements was used. However, the inlet flow measurement was considered to be more accurate than the outlet flow measurement, so the inlet flow volumes were used to calculate final mass loadings.
The calibration of the outlet flow measurement was similar to that described for the inlet site. A total of 54 dry-weather periods were used, during which the water level in the holding tank exceeded the pump threshold because of constant ground-water contributions. The volume of water pumped from the holding tank was computed from water-level measurements in the tank; this was done by taking the difference between water levels before and after the pump cycling and multiplying by the area of the tank. This volume was compared to the volume computed from measurements by the outlet velocity probe. The relation between these two volumes changed over time. Five different periods were identified that resulted in distinctly different linear regressions between the two volumes. Correlation coefficients (R2) values for these regressions ranged from 0.44 to 0.96. When final volumes were computed for the 15 sampled events, the average percentage difference between the inlet and outlet volumes was -17 percent (the outlet had less flow), with a maximum difference of -62 percent. There are several possible causes for the changing relation between volume pumped from the holding tank and volume computed, but it is uncertain exactly why these relations changed. Some possible explanations include the following:
For these reasons, the outlet flow measurements and volume calculations were considered to be unreliable, and the inlet volumes were used for mass loading calculations.
Particle-size analysis of runoff-event samples was conducted in three different ways. The first level particle-size definition was the "sand/silt split," which was used to determine the percentage of sediment, by mass, with a diameter greater than 62 µm (defined as sand) and less than 62 µm (defined as silt). These two fractions were analyzed further to provide additional particle-size definition. To define the sand fraction of the sample further, a visual-accumulation (VA) tube analysis was done (Guy, 1977). This analysis determines the percentage of sediment by mass with diameters less than 1,000, 500, 250, 125, and 62 µm. To determine the silt fraction of the sample with more definition, a pipet analysis was done (Guy, 1977). This analysis determined the percentage of sediment by mass with diameters less than 31, 16, 8, 4, and 2 µm.
Fifteen events during June 2, 2001, through September 9, 2002, were monitored for water quality and water quantity. The rainfall depth of these sampled events ranged from 0.20 to 1.27 in., and 15- and 30-minute maximum intensities were 1.12 and 0.70 in/hr, respectively (table 6). Based on a drainage area of 5.5 acres, total rainfall volumes ranged from 3,990 ft3 to 25,310 ft3, and the volume of stormwater that passed through the filtration system ranged from 2,370 ft3 to 16,630 ft3 (table 7). On average, 70 percent of the rainfall resulted in direct runoff from the site. The remaining rainfall volume could have been lost by interception storage on the roof and parking lot or by infiltration into the parking lot cracks and lawn areas.
[P15, maximum 15-minute rainfall intensity; P30, maximum 30-minute rainfall intensity; hr, hour; min, minute; in. inch; in/hr, inches per hour; ft3, cubic feet]
| Event | Rainfall start (date and 24-hour time) | Rainfall end (date and 24-hour time) | Rain duration (hr:min) | Total rain (in.) | P15 (in/hr) | P30 (in/hr) | Total rainfall volume (ft3) |
|---|---|---|---|---|---|---|---|
| 1 | 06/02/2001 0342 | 06/02/2001 1108 | 07:26 | 0.81 | 0.20 | 0.16 | 16,140 |
| 2 | 06/10/2001 1216 | 06/10/2001 1510 | 02:54 | .41 | .40 | .26 | 8,170 |
| 3 | 06/11/2001 2213 | 06/12/2001 0002 | 01:49 | .20 | .20 | .16 | 3,990 |
| 4 | 06/15/2001 1013 | 06/15/2001 1203 | 01:50 | .38 | .40 | .34 | 7,570 |
| 5 | 08/25/2001 0242 | 08/25/2001 0934 | 06:52 | .34 | .32 | .20 | 6,780 |
| 6 | 12/12/2001 2154 | 12/13/2001 0049 | 02:55 | .39 | .28 | .24 | 7,770 |
| 7 | 04/18/2002 0414 | 04/18/2002 0746 | 03:32 | .40 | .28 | .24 | 7,970 |
| 8 | 04/24/2002 1453 | 04/24/2002 1832 | 03:39 | .63 | .76 | .46 | 12,560 |
| 9 | 04/27/2002 2102 | 04/28/2002 0735 | 11:33 | 1.13 | .40 | .34 | 22,520 |
| 10 | 05/01/2002 2155 | 05/02/2002 0042 | 02:47 | .22 | .12 | .10 | 4,380 |
| 11 | 05/25/2002 0811 | 05/27/2002 0751 | 47:40 | 1.27 | .20 | .20 | 25,310 |
| 12 | 06/13/2002 2045 | 06/14/2002 1046 | 14:01 | .31 | .56 | .44 | 6,180 |
| 13 | 06/21/2002 1714 | 06/21/2002 1819 | 01:05 | .36 | .88 | .52 | 7,170 |
| 14 | 07/25/2002 1729 | 07/25/2002 1837 | 01:08 | .40 | 1.12 | .70 | 7,970 |
| 15 | 09/19/2002 0448 | 09/19/2002 0636 | 01:48 | .21 | .28 | .22 | 4,190 |
Table 7. Percentage of runoff and inlet volumes for the pressurized stormwater treatment system.
[ft3, cubic feet]
| Event | Inlet start (date and 24-hour time) | Inlet end (date and 24-hour time) | Percent runoff | Inlet volume (ft3) |
|---|---|---|---|---|
| 1 | 06/02/2001 0345 | 06/02/2001 1123 | 99 | 16,070 |
| 2 | 06/10/2001 1226 | 06/10/2001 1536 | 77 | 6,310 |
| 3 | 06/11/2001 2238 | 06/12/2001 0027 | 59 | 2,370 |
| 4 | 06/15/2001 1020 | 06/15/2001 1236 | 71 | 5,370 |
| 5 | 08/25/2001 0245 | 08/25/2001 1047 | 66 | 4,470 |
| 6 | 12/12/2001 2218 | 12/13/2001 0133 | 71 | 5,500 |
| 7 | 04/18/2002 0427 | 04/18/2002 0843 | 62 | 4,960 |
| 8 | 04/24/2002 1507 | 04/24/2002 1904 | 64 | 8,040 |
| 9 | 04/27/2002 2015 | 04/28/2002 0807 | 74 | 16,630 |
| 10 | 05/01/2002 2219 | 05/02/2002 0100 | 58 | 2,560 |
| 11 | 05/25/2002 0831 | 05/27/2002 0808 | 64 | 16,110 |
| 12 | 06/13/2002 2348 | 06/14/2002 1133 | 75 | 4,640 |
| 13 | 06/21/2002 1715 | 06/21/2002 1857 | 69 | 4,980 |
| 14 | 07/25/2002 1739 | 07/25/2002 1956 | 72 | 5,730 |
| 15 | 09/19/2002 0448 | 09/19/2002 0709 | 61 | 2,790 |
To assess how rainfall during the 15 monitored events compared to long-term rainfall patterns, the distribution of monitored rainfall depths from this study was compared to the distribution of rainfall depths from the historical record monitored by the National Oceanic and Atmospheric Administration (NOAA). Probability distributions for both data sets were constructed using the Weibull plotting position (Helsel and Hirsch, 1992). Rainfall depths for individual events were computed for both data sets. Events that were greater than or equal to 0.2 in. (the minimum event depth sampled during this project) were ranked from smallest to largest depth. A cumulative probability distribution was then computed for both data sets using the formula PR=iR/(n+1) where R is the rainfall event referred to, PR is the probability of a storm having a rainfall depth less than that of event R, iR is the ranking of event R, and n is the total number of events in the data set. Results indicate that the distribution of rainfall depths of the events that were monitored for this study compare well to the distribution of historical rainfall events (fig. 2).
Event mean concentrations from inlet and outlet samples for each runoff event are summarized in table 8. Concentrations of total suspended solids and total zinc inlet samples were lower than those typically reported in previous studies of parking lot runoff (table 9). Lower concentrations in this study may be due to dilution of parking-lot runoff by runoff from the hospital rooftop, which constitutes 26 percent of the drainage area. Concentrations of nitrate plus nitrite, and dissolved and total phosphorus concentrations were similar to those reported in other studies (table 9).
[mg/L, milligrams per liter; µg/L, micrograms per liter; --, no data; <, less than; Min, minimum; Max, maximum]
| Event | Suspended solids, total (mg/L) | Dissolved solids, total (mg/L) | Suspended sediment concentration (mg/L) | Kjeldahl nitrogen, total (mg/L) | Nitrate plus nitrite as nitrogen (mg/L) | Phosphorus, dissolved (mg/L) | Phosphorus, total (mg/L) | Zinc, total (µg/L) | Calcium, total (mg/L) | Magnesium, total (mg/L) | ||||||||||
|---|---|---|---|---|---|---|---|---|---|---|---|---|---|---|---|---|---|---|---|---|
| Inlet | Outlet | Inlet | Outlet | Inlet | Outlet | Inlet | Outlet | Inlet | Outlet | Inlet | Outlet | Inlet | Outlet | Inlet | Outlet | Inlet | Outlet | Inlet | Outlet | |
| 1 | 10 | <3 | 38 | 186 | 12 | -- | 0.32 | 0.39 | 0.286 | 0.674 | 0.005 | <0.005 | 0.023 | 0.015 | 24 | 19 | 6.5 | 19.0 | 2.3 | 8.3 |
| 2 | 38 | 7 | 62 | 610 | 47 | 4 | .51 | .59 | .641 | 1.700 | <.005 | <.005 | .070 | <.005 | 50 | 20 | 11.0 | 60.0 | 4.3 | 29.0 |
| 3 | 20 | <2 | 106 | 504 | -- | -- | 1.01 | .55 | .889 | 1.490 | <.005 | <.005 | .059 | .028 | 36 | 24 | 13.0 | 49.0 | 4.6 | 23.0 |
| 4 | 23 | 4 | 74 | 367 | 25 | 4 | .62 | .57 | .557 | 1.100 | .020 | .014 | .061 | .037 | 45 | 25 | 11.0 | 37.0 | 4.1 | 17.0 |
| 5 | 32 | <2 | 160 | 250 | 31 | 2 | 1.34 | .53 | 1.690 | 1.630 | .012 | .021 | .061 | .025 | 72 | 19 | 21.8 | 25.7 | 8.5 | 11.0 |
| 6 | 17 | 3 | 54 | 380 | 14 | 3 | .42 | .43 | .357 | .931 | .021 | .025 | .043 | .033 | 45 | <16 | 7.7 | 41.6 | 3.1 | 23.0 |
| 7 | 153 | 45 | 282 | 646 | 141 | 43 | 2.05 | 1.71 | 1.340 | 1.800 | .038 | .028 | .165 | .087 | 134 | 56 | 33.6 | 47.2 | 12.0 | 20.0 |
| 8 | 426 | 61 | 546 | 768 | 340 | 67 | 2.22 | 1.04 | .743 | .906 | .026 | .021 | .316 | .087 | 208 | 50 | 63.6 | 35.3 | 30.0 | 14.0 |
| 9 | 25 | 9 | 174 | 448 | 28 | 19 | .33 | .35 | .393 | .839 | .022 | .021 | .069 | .051 | 35 | 26 | 13.2 | 33.3 | 5.4 | 14.9 |
| 10 | 15 | 8 | 204 | 950 | -- | -- | .56 | .43 | .697 | 1.880 | .024 | .017 | .053 | .034 | 36 | 18 | 17.4 | 77.2 | 7.4 | 36.0 |
| 11 | 14 | 4 | 122 | 282 | 13 | 5 | .84 | .51 | .599 | .789 | .014 | .015 | .056 | .033 | 53 | 22 | 12.0 | 25.0 | 4.5 | 11.0 |
| 12 | 19 | 3 | 190 | 344 | 16 | 4 | .51 | .75 | .587 | .935 | .015 | .011 | .050 | .032 | 31 | 18 | 23.8 | 34.1 | 10.0 | 15.0 |
| 13 | 88 | 8 | 122 | 574 | 122 | 7 | .84 | .57 | .623 | 1.340 | .016 | .008 | .114 | .034 | 73 | 21 | 21.1 | 51.9 | 9.8 | 25.6 |
| 14 | 176 | 25 | 68 | 808 | 238 | 12 | 1.06 | .78 | .839 | 2.090 | .017 | .025 | .213 | .067 | 132 | 22 | 34.6 | 75.9 | 16.0 | 41.0 |
| 15 | 21 | 6 | 208 | 556 | 43 | 2 | .78 | .46 | .839 | 1.240 | .168 | .119 | .255 | .134 | 52 | 17 | 22.5 | 47.4 | 11.0 | 28.0 |
| Min | 10 | <2 | 38 | 186 | 12 | 2 | .32 | .35 | .286 | .674 | <.005 | <.005 | .023 | <.005 | 24 | 17 | 6.5 | 19.0 | 2.3 | 8.3 |
| Max | 426 | 61 | 546 | 950 | 340 | 67 | 2.22 | 1.71 | 1.690 | 2.090 | .168 | .119 | .316 | .134 | 208 | 56 | 63.6 | 77.2 | 30.0 | 41.0 |
| Median | 23 | 8 | 122 | 504 | 31 | 5 | .78 | .55 | .641 | 1.240 | .020 | .021 | .061 | .034 | 50 | 22 | 17.4 | 41.6 | 7.4 | 20.0 |
| Mean | 72 | 15 | 161 | 512 | 82 | 14 | .89 | .64 | .739 | 1.290 | .031 | .027 | .107 | .050 | 68 | 26 | 20.9 | 44.0 | 8.9 | 21.1 |
[mg/L, milligrams per liter; µg/L micrograms per liter; --, no data available]
| Study | Total suspended solids (mg/L) | Total Kjeldahl nitrogen (mg/L) | Nitrate plus nitrite as N (mg/L) | Dissolved phosphorus (mg/L) | Total phosphorus (mg/L) | Total zinc (µg/L) |
|---|---|---|---|---|---|---|
| St. Mary's Hospital parking lot, Green Bay | 72 | 0.89 | 0.74 | 0.031 | 0.106 | 68 |
| City maintenance yard, Madison (Waschbusch, 1999) | 214 | -- | .48 | .16 | .44 | 217 |
| City garage and parking lot, Milwaukee (Corsi and others, 1999) | 313 | -- | .39 | .02 | .28 | 164 |
| Commercial strip, Madison (Waschbusch and others, 1999) | 82 | -- | -- | .012 | .09 | -- |
| Commercial strip, Marquette, Mich., (Steuer and others, 1997) | 134 | 1.25 | .39 | .031 | .20 | 148 |
| Shopping center, Madison (Waschbusch, 1995) | 47 | .90 | .96 | .054 | .09 | 182 |
| Industrial, Madison (Bannerman and others, 1993) | 91 | -- | -- | .07 | .26 | 261 |
| Commercial strip, Milwaukee (Bannerman and others, 1983; Post Office) | 212 | .108 | .708 | -- | .108 | 145 |
| Shopping center, Milwaukee (Bannerman and others, 1983; Rustler) | 202 | .105 | .781 | -- | .105 | 156 |
Concentrations of individual constituents at each site were tested for normality/log-normality by use of the Shapiro-Wilk test statistic (Helsel and Hirsch, 1992). Concentrations from inlet samples were log-normally distributed. Concentrations from outlet samples for TSS, total dissolved solids (TDS), nitrate plus nitrogen, total magnesium, and total calcium were normally distributed. Concentrations of total phosphorus, dissolved phosphorus, TKN, and total zinc were log-normally distributed.
Because the inlet and outlet concentrations were generally not of the same statistical distribution, the nonparametric Wilcoxon rank-sum test was used to explore differences between inlet and outlet concentrations. The Spearman's rho statistic was used to test for positive correlations between concentrations at the two sites (Helsel and Hirsch, 1992). Test conclusions were made using a confidence interval of 95 percent. For the Wilcoxon rank-sum test, the null hypothesis was that the inlet and outlet concentration distributions are the same. A direct comparison of inlet and outlet constituent concentrations from individual runoff events is problematic due to mixing of stormwater and ground water stored in the holding tank between events. Ground water continuously leaks into the storm sewer and therefore into the PFS system during dry weather. For this reason, the holding tank contains an initial amount of ground water at the beginning of each event. Because the tank is upstream from the outlet, the ground water stored in the tank at the beginning of each event is sampled as part of the event. For suspended constituents and some dissolved constituents, this ground-water influence may reduce the concentrations at the outlet. For dissolved constituents such as calcium and magnesium, the concentrations at the outlet may be increased as a result of the ground-water influence.
[Concentrations in milligrams per liter]
| Sample | Total dissolved solids | Total calcium | Total magnesium |
|---|---|---|---|
| 1 | 774 | 81.5 | 49.0 |
| 2 | 836 | 73.2 | 47.6 |
| 3 | 780 | 78.0 | 46.2 |
| 4 | 782 | 80.9 | 48.0 |
| Mean | 793 | 78.4 | 47.7 |
Inlet samples had detectable concentrations of all constituents analyzed except for dissolved phosphorus in three samples (table 8). Generally, outlet samples also had detectable concentrations of all constituents except TSS in three samples, dissolved phosphorus in three samples, total phosphorus in one sample, and total zinc in one sample. For values that were reported as below the detection limit (censored values), one-half of the detection limit was used as an estimate of the concentration for statistical testing and for calculation of event loads. To verify that this estimate did not bias reported results, the load efficiencies were also computed by ignoring the events that had censored values or replacing these censored values with a zero value. Resulting differences were only ± 2 percent, suggesting that using one-half of the detection limit as an estimate of concentration does not substantially bias results.
Of the 10 constituents analyzed for in samples collected throughout this study, those that are associated with particulate matter had higher mean concentrations in inlet samples than in outlet samples, dissolved constituents that are associated with ground-water seepage entering the system had higher mean-concentrations in outlet samples, and dissolved phosphorus concentrations were not significantly different between the two monitoring locations.
Inlet concentrations were significantly higher than outlet concentrations (p less than 0.05) for TSS, TKN, total phosphorus, and total zinc. In addition, inlet and outlet concentrations were positively correlated for TSS, TKN, and total phosphorus (p less than 0.05). This implies that, in general, outlet concentrations for these three constituents increased with increasing inlet concentrations. For concentrations of TKN and total zinc, the pattern appears similar, but tests do not show this relation to be statistically significant.
Concentrations of TDS, calcium, magnesium, and nitrate plus nitrite—all dissolved constituents—were higher (p less than 0.05) in the outlet. The increase in TDS, calcium, and magnesium is most likely explained by ground-water contributions to the holding tank. The initial ground water stored in the tank was pumped through the PSF system at the beginning of each runoff event. Because the stormwater was combined with this initial ground water in the holding tank, it was included in samples from the outlet but not in samples from the inlet. On August 8, 2001, grab samples of ground water that had seeped into the storm-sewer system were collected at four different locations in the system. The concentrations for TDS, calcium, and magnesium in ground water were much higher than concentrations in the runoff (table 10), providing evidence that the ground-water contribution influenced the composition of water at the outlet. These ground-water seepage samples were not analyzed for nitrate plus nitrite, so the cause of the higher nitrate plus nitrite concentrations at the outlet has not been determined. Because nitrate plus nitrite is also a dissolved constituent, the ground-water seepage is a likely source. Another potential source of added nitrate plus nitrite at the outlet could be transformation of organic nitrogen and ammonium to nitrate and nitrite.
Inlet concentrations for TSS ranged from 10 to 426 mg/L, and the median was 23 mg/L. The outlet maximum concentration was 61 mg/L, the median value was 8 mg/L, and three samples had concentrations below the detection limit. Concentrations of TSS exceeded Wisconsin standards for sewage-treatment-works effluent (30 mg/L) at the inlet for six events and at the outlet for two events (Wisconsin Administrative Code NR 210, 1997). The total event loadings of TSS monitored for the study were 453.7 lb at the inlet and 79.4 lb at the outlet, resulting in an overall removal efficiency of 83 percent (table 11).
[lbs, pounds; SOL, sum of loads; --, no data]
| Event | Suspended solids, total (lbs) | Dissolved solids, total (lbs) | Suspended sediment concentration (lbs) | Kjeldahl nitrogen, total (lbs) | Nitrate plus nitrite (lbs) | Phosphorus, dissolved (lbs) | Phosphorus, total (lbs) | Zinc, total (lbs) | Calcium, total (lbs) | Magnesium, total (lbs) | ||||||||||
|---|---|---|---|---|---|---|---|---|---|---|---|---|---|---|---|---|---|---|---|---|
| # | Inlet | Outlet | Inlet | Outlet | Inlet | Outlet | Inlet | Outlet | Inlet | Outlet | Inlet | Outlet | Inlet | Outlet | Inlet | Outlet | Inlet | Outlet | Inlet | Outlet |
| 1 | 10.0 | 1.5 | 38.1 | 186.6 | 12.0 | -- | 0.32 | 0.39 | 0.287 | 0.676 | 0.005 | 0.005 | 0.023 | 0.015 | 0.024 | 0.019 | 6.5 | 19.1 | 2.3 | 8.3 |
| 2 | 15.0 | 2.8 | 24.4 | 240.3 | 18.5 | 1.6 | 0.20 | 0.23 | 0.253 | 0.670 | 0.001 | 0.001 | 0.001 | 0.001 | 0.020 | 0.008 | 4.3 | 23.6 | 1.7 | 11.4 |
| 3 | 3.0 | 0.1 | 15.7 | 74.6 | -- | -- | 0.15 | 0.08 | 0.132 | 0.220 | 0.000 | 0.000 | 0.009 | 0.004 | 0.005 | 0.004 | 1.9 | 7.2 | 0.7 | 3.4 |
| 4 | 7.7 | 1.3 | 24.8 | 123.0 | 8.4 | 1.3 | 0.21 | 0.19 | 0.187 | 0.369 | 0.007 | 0.005 | 0.020 | 0.012 | 0.015 | 0.008 | 3.7 | 12.4 | 1.4 | 5.7 |
| 5 | 8.9 | 0.3 | 44.6 | 69.8 | 8.6 | 0.6 | 0.37 | 0.15 | 0.472 | 0.455 | 0.003 | 0.006 | 0.017 | 0.007 | 0.020 | 0.005 | 6.1 | 7.2 | 2.4 | 3.1 |
| 6 | 5.8 | 1.0 | 18.5 | 130.5 | 4.8 | 1.0 | 0.14 | 0.15 | 0.123 | 0.320 | 0.007 | 0.009 | 0.015 | 0.011 | 0.016 | 0.003 | 2.6 | 14.3 | 1.1 | 7.9 |
| 7 | 47.4 | 13.9 | 87.3 | 200.0 | 43.7 | 13.3 | 0.63 | 0.53 | 0.415 | 0.557 | 0.012 | 0.009 | 0.051 | 0.027 | 0.042 | 0.017 | 10.4 | 14.6 | 3.7 | 6.2 |
| 8 | 213.8 | 30.6 | 274.0 | 385.5 | 170.6 | 33.6 | 1.11 | 0.52 | 0.373 | 0.455 | 0.013 | 0.011 | 0.159 | 0.044 | 0.104 | 0.025 | 31.9 | 17.7 | 15.1 | 7.0 |
| 9 | 26.0 | 9.3 | 180.6 | 465.1 | 29.1 | 19.7 | 0.34 | 0.36 | 0.408 | 0.871 | 0.023 | 0.022 | 0.072 | 0.053 | 0.036 | 0.027 | 13.7 | 34.6 | 5.6 | 15.5 |
| 10 | 2.4 | 1.3 | 32.6 | 151.8 | -- | -- | 0.09 | 0.07 | 0.111 | 0.300 | 0.004 | 0.003 | 0.008 | 0.005 | 0.006 | 0.003 | 2.8 | 12.3 | 1.2 | 5.8 |
| 11 | 14.1 | 4.0 | 122.7 | 283.6 | 13.1 | 5.0 | 0.84 | 0.51 | 0.602 | 0.794 | 0.014 | 0.015 | 0.056 | 0.033 | 0.053 | 0.022 | 12.1 | 25.1 | 4.5 | 11.1 |
| 12 | 5.5 | 0.9 | 55.0 | 99.6 | 4.6 | 1.2 | 0.15 | 0.22 | 0.170 | 0.271 | 0.004 | 0.003 | 0.014 | 0.009 | 0.009 | 0.005 | 6.9 | 9.9 | 2.9 | 4.3 |
| 13 | 27.4 | 2.5 | 37.9 | 178.4 | 37.9 | 2.2 | 0.26 | 0.18 | 0.194 | 0.417 | 0.005 | 0.002 | 0.035 | 0.011 | 0.023 | 0.007 | 6.6 | 16.1 | 3.0 | 8.1 |
| 14 | 63.0 | 8.9 | 24.3 | 289.0 | 85.1 | 4.3 | 0.38 | 0.28 | 0.300 | 0.748 | 0.006 | 0.009 | 0.076 | 0.024 | 0.047 | 0.008 | 12.4 | 27.2 | 5.7 | 14.7 |
| 15 | 3.7 | 1.0 | 36.2 | 96.8 | 7.5 | 0.3 | 0.14 | 0.08 | 0.146 | 0.216 | 0.029 | 0.021 | 0.044 | 0.023 | 0.009 | 0.003 | 3.9 | 8.3 | 1.9 | 4.9 |
| Total | 453.7 | 79.4 | 1,016.7 | 2,974.6 | 443.9 | 84.1 | 5.33 | 3.94 | 4.173 | 7.339 | 0.133 | 0.121 | 0.600 | 0.279 | 0.429 | 0.164 | 125.8 | 249.6 | 53.2 | 117.4 |
| SOL Efficiency | 83 | -193 | 81 | 26 | -76 | 9 | 54 | 62 | -98 | -121 | ||||||||||
Suspended-sediment concentrations were determined in samples from 13 events at the inlet and 12 events at the outlet. Sample volume was not sufficient to perform analysis of suspended-sediment concentration for several events. The general relation between suspended-sediment concentration and TSS concentrations is positive; linear regression results in R2 values of 0.92 and 0.93 for the inlet and the outlet data, respectively. However, the ratio of TSS to suspended-sediment concentration ranged from 0.49 to 1.25 at the inlet with a median of 0.92. The ratio ranged from 0.47 to 3.0 at the outlet with a median of 1.0. The total event loadings of suspended-sediment concentration for the sampled events were 443.9 lb at the inlet and 84.1 lb at the outlet, resulting in a removal efficiency of 81 percent.
Total nutrients (total phosphorus and TKN) were also reduced through the PSF system. The median concentrations of total phosphorus were 0.061 at the inlet and 0.034 at the outlet (table 8). The total monitored loading of phosphorus was reduced by 54 percent. Median concentrations of TKN were 0.78 and 0.55 at the inlet and outlet, respectively; a total loading reduction of 26 percent.
Total recoverable zinc concentrations were also reduced between the inlet and the outlet. The median concentration at the inlet was 50 µg/L and the median at the outlet was 22 µg/L. This resulted in an overall 62-percent reduction of zinc loading. The Wisconsin State Standard for Surface Water Quality Criteria for Toxicity (Wisconsin Administrative Code NR 105, 1997) was exceeded at the inlet for only two events and was not exceeded at the outlet.
Concentrations of dissolved nutrients were not significantly reduced through the PSF system. The median concentrations of dissolved phosphorus were nearly identical (0.20 and 0.21 mg/L at the inlet and outlet, respectively). The loading, however, was reduced by 9 percent. Most likely, nitrate plus nitrite concentrations increased between the inlet and outlet monitoring sites because of the ground-water influence to the PSF system. Median nitrate plus nitrite concentrations were 0.641 mg/L at the inlet and 1.24 mg/L at the outlet. The total monitored loading of nitrate plus nitrite was increased by 76 percent.
Other constituents monitored were TDS, calcium, and magnesium. All three of these constituents were influenced by the ground-water contribution to the PSF system. Median TDS concentration increased from 122 to 504 mg/L between the inlet and the outlet, resulting in an increased total TDS loading of 193 percent. Median calcium concentrations increased from 17.4 mg/L at the inlet to 41.6 mg/L at the outlet, and median magnesium concentrations increased from 7.4 to 20.0 through the system. Corresponding inlet and outlet loadings of calcium and magnesium increased by 98 and 121 percent, respectively.
Results of particle-size analysis for the 15 monitored events, samples from 12 events at the inlet and outlet were analyzed for a sand/silt split (table 12). Of those 12 events, 6 samples at the inlet had sufficient sediment content and sample volume for the VA tube analysis (table 13). Of those six samples, three samples also had sufficient sediment content for the pipet analysis, resulting in a full definition of the particle-size distribution. All outlet samples did not contain enough sediment and sample volume for the VA tube and pipet analyses.
[µm, micrometer; %, percent by mass; >, greater than; <, less than]
| Inlet % | Outlet % | ||||
|---|---|---|---|---|---|
| Event number | >62 (µm) | <62 (µm) | >62 (µm) | <62 (µm) | |
| 2 | 44.0 | 56.0 | 29.1 | 70.9 | |
| 4 | 23.8 | 76.2 | 21.7 | 78.3 | |
| 5 | 33.0 | 67.0 | 54.8 | 45.2 | |
| 6 | 10.0 | 90.0 | 20.6 | 79.4 | |
| 7 | 1.9 | 98.1 | 2.3 | 97.7 | |
| 8 | 0.9 | 99.1 | 8.8 | 91.2 | |
| 9 | 19.4 | 80.6 | 7.6 | 92.4 | |
| 11 | 10.0 | 90.0 | 1.4 | 98.6 | |
| 12 | 18.5 | 81.5 | 24.7 | 75.3 | |
| 13 | 42.5 | 57.5 | 17.7 | 82.3 | |
| 14 | 37.9 | 62.1 | 3.0 | 97.0 | |
| 15 | 67.9 | 32.1 | 2.4 | 97.6 | |
[mm, millimeter; --, insufficient sample amount for determination of smaller particle sizes; %, percent by mass; NA, not analyzed; <, less than]
| Event number | ||||||
|---|---|---|---|---|---|---|
| Particle size (mm) | 7 (%) |
8 (%) |
9 (%) |
13 (%) |
14 (%) |
15 (%) |
| <1,000 | 100 | 100 | 87.6 | 79 | 94.3 | 40.2 |
| <500 | 100 | 100 | 86.8 | 72.2 | 85.1 | NA |
| <250 | 99.6 | 100 | 82.2 | 60.4 | 75.2 | 36 |
| <125 | 98.7 | 99.8 | 80.8 | 57.5 | 68.8 | 32.5 |
| <62 | 98.1 | 99.1 | 80.6 | 57.5 | 62.1 | 32.1 |
| <31 | 94.4 | 95.5 | -- | -- | 44.4 | -- |
| <16 | 81.4 | 78.8 | -- | -- | 32.6 | -- |
| <8 | 58.9 | 56.4 | -- | -- | 25.2 | -- |
| <4 | 35.3 | 38.9 | -- | -- | 17.3 | -- |
| <2 | 17.9 | 23.9 | -- | -- | 13.5 | -- |
At the end of the monitoring period, core samples were collected from the flow splitter (a catch basin that separated the inlet pipe and the bypass pipe from the holding tank). All sediment was removed from the flow splitter in May 2001, and the coring was done in November 2002. The depth of sediment in the flow splitter ranged from 14 in. near the inlet to 1 in. towards the bypass (fig. 3). Three composite samples of three subsamples each were collected and analyzed for particle-size distribution. These samples were used to define the percentage of sediment by mass that had diameters less than 2,000, 1,000, 500, 250, 125, and 62 µm.
Results from the sand/silt split analyses demonstrated that the particle-size distribution in samples from the inlet and the outlet contained a higher percentage of silt-sized particles than sand-sized particles. The median silt content in samples was 78 percent and 87 percent for the inlet and outlet, respectively. Sediment in samples from only 1 of 12 events at the inlet and 1 of 12 events at the outlet had more sand than silt-sized particles (table 12). Sediment particle-size results also showed that 83 percent of the sediment load for these 12 events consisted of silt-sized particles, and 92 percent of the outlet sediment load was silt. Linear regression did not indicate any obvious trends between sand or silt percentage and rainfall depth or intensity.
Results from the VA tube and pipet analyses illustrate that there can be large between-event differences in the particle-size distribution at the inlet (table 13, fig. 4). For example, 60 percent of sediment in the sample collected during event 15 was greater than 1,000 µm, whereas all sediment in samples from events 7 and 8 had diameters less than 1,000 µm. In the flow splitter, 97 percent of the sediment had diameters greater than 62 µm, 49 percent had diameters greater than 1,000 µm, and only 3 percent had diameters less than 62 µm (table 14). These larger particles consisted of sand, gravel, pavement, leaves, cigarette butts, and vegetation. Data from the flow splitter suggested that some of the larger particles were selectively removed by settling before water was drained to the holding tank but that the smaller particles remained in suspension.
[mm, millimeter; %, percent by mass; <, less than]
| Sample number | ||||
|---|---|---|---|---|
| Particle size (mm) | 1 (%) | 2 (%) | 3 (%) | Mean (%) |
| <2,000 | 70 | 68 | 71 | 70 |
| <1,000 | 51 | 49 | 54 | 51 |
| <500 | 34 | 34 | 39 | 36 |
| <250 | 16 | 16 | 21 | 18 |
| <125 | 6 | 7 | 8 | 7 |
| <62 | 3 | 3 | 4 | 3 |
The primary purposes of this project were to evaluate the performance of the pressurized stormwater filter (PSF) system for the U.S. Environmental Protection Agency's (USEPA) Environmental Technology Verification Program (ETV) program and to characterize runoff from the roof and parking lot for comparison to other sources monitored in WDNR and USGS urban-runoff studies. The ETV program was established to provide information to help guide municipalities in selecting treatment practices for reduction of stormwater pollutants in urban runoff. This is the first of three systems that the USGS and WDNR collaborated on in cooperation with the USEPA ETV program. Since 1978, the U.S. Geological Survey (USGS) and Wisconsin Department of Natural Resources (WDNR) have conducted several projects to understand the water-quality characteristics of stormwater in Wisconsin.
A pressurized stormwater filter system was installed at St. Mary's Hospital in Green Bay, Wisconsin to treat runoff from 5.5 acres of rooftop and parking lot in 1998. The pressurized stormwater filtration system consists of a flow splitter, which directs runoff either to the underground holding tank or to the bypass pipe. The water that enters the holding tank is then pumped through a dual filter unit and discharged to the storm sewer. The system was designed to treat event runoff up to 0.54 inches, which would account for approximately 76 percent of the total average annual rainfall depth in Green Bay.
From November 2000 until September 2002, 15 nonconsecutive runoff events greater than or equal to 0.2 inch of rainfall were monitored for flow and water quality. All runoff from these 15 events was treated without the occurrence of bypassing. Samples from the inlet and the outlet to the system were analyzed for water quality for all events. At the end of the monitoring period, sediment core samples were collected from the flow splitter and were analyzed for sediment mass and sieved for particle-size distribution. The quantity of water passing through the treatment system for the 15 monitored events ranged from 2,370 to 16,630 ft3 for individual events and was, on average, 70 percent of the total rainfall volume in the contributing watershed. Significant reductions in concentration were achieved between the inflow and the outflow in constituents such as TSS (83 percent), suspended sediment (81 percent), total phosphorus (54 percent), TKN (26 percent), and total recoverable zinc (62 percent). Concentrations of TSS exceeded Wisconsin Standards for sewage-treatment-works effluent (30 mg/L) at the inlet for six events and at the outlet for two events. The Wisconsin State Standard for Surface Water Quality Criteria for Toxicity for total recoverable zinc (Wisconsin Administrative Code NR105, 1997) was exceeded at the inlet during two events and was not exceeded at the outlet. The dissolved fraction of phosphorus was not significantly removed. Concentrations of other dissolved constituents were increased between the inlet and outlet due to ground-water contribution to the holding tank between monitored events. Although the amount of total sediment was reduced through the system, the sand/silt fractions did not change appreciably from the inlet to the outlet. Final results were consistent with the manufacturer's design for the removal of 80 percent of suspended solids greater than 5 µm for all water passing through the PSF system. Results from this study were forwarded to ETV personnel for their verification reporting (U.S. Environmental Protection Agency 2004).
American Public Health Association, 1989, Standard methods for the examination of water and wastewater, 17th ed.: Washington, D.C. [variously paginated].
Bannerman, R.T., Baun, K., Bohn, M., Hughes, P.E., and Graczyk, D.J., 1983, Evaluation of urban nonpoint source pollution management in Milwaukee County, Wisconsin—Volume 1 for U.S. Environmental Protection Agency, Region V: Wisconsin Department of Natural Resources Publication PB 84—114164 [variously paged].
Bannerman, R.T., Owens, D.B., Dodds, R.B., and Hornewer, N.J., 1993, Sources of pollutants in Wisconsin stormwater: Water Science Technology, v. 28, no. 3—5, p. 241—259.
Bachhuber, J., Corsi, S., and Bannerman, R., 2001, Test plan for the verification of Arkal Filtration Systems, Inc. —Pressurized stormwater filtration system, St. Mary's Hospital, Green Bay, Wis.: U.S. Environmental Protection Agency, Office of Research and Development [variously paged].
Corsi, S.R., Greb, S.R., Bannerman, R.T., and Pitt, R.E., 1999, Evaluation of the multi-chambered treatment train, a retrofit water-quality management device: U.S. Geological Survey Open-File Report 99—270, 24 p.
Dynasonic, Series 902/903 Portable Doppler ultrasonic flow meter, Operation and maintenance manual: Dynasonic REV 4/00, 45 p.
Guy, H.P., 1977, Laboratory theory and methods for sediment analysis: U.S. Geological Survey Techniques of Water-Resources Investigations, book 5, chap. C1, 58 p.
Helsel, D.R., and Hirsch, R.M., 1992, Statistical methods in water resources: New York, Elsevier, 522 p.
Knott, J.M., Glysson, G.D., Malo, B.A., and Schroder, L.J., 1993, Quality assurance plan for the collection and processing of sediment data: U.S. Geological Survey Open-File Report 92—499, 18 p.
Kopp, J.F. and G.D. McKee, 1979, Methods for chemical analysis of water and waste: 3rd ed., U.S. Environmental Protection Agency, Environmental Monitoring and Support Laboratory, EPA—600/4—79—020 [variously paged].
National Oceanic and Atmospheric Administration, 1997, National Climatic Data Center: Austin Straubel International Airport, Green Bay Weather Service Office (WSO) precipitation records 1949—1992, 2000—2002.
Steuer, J.J., Selbig, W.R., Hornewer, N.J., and Prey, J., 1997, Sources of contamination in an urban basin in Marquette, Michigan, and an analysis of concentrations, loads, and data quality: U.S. Geological Survey Water-Resources Investigations Report 97—4242, 25 p.
U.S. Environmental Protection Agency, 1979, Methods for chemical analysis of water and wastes: U.S. Environmental Protection Agency EPA 600/4—79—020, 460 p.
U.S. Environmental Protection Agency, 1983, Results of the Nationwide Urban Runoff Program, Volume 1–final report, Water Planning Division: Washington, D.C., National Technical Information Service PB84—185552 [variously paged].
U.S. Environmental Protection Agency, 2000, Storm water phase II final rule: U.S. Environmental Protection Agency EPA 833—F—00—001, Fact Sheet 1.0, 4 p.
U.S. Environmental Protection Agency, March 2002, ETV verification protocol stormwater source area treatment technologies, EPA/NSF wet-weather flow technologies pilot, v. 4.1 [variously paged].
U.S. Environmental Protection Agency, March 2002, ETV verification protocol stormwater source area treatment technologies: EPA Draft 4.1, 25 p.
U.S. Environmental Protection Agency, 2004, Environmental Technology Verification Report—Stormwater source area treatment device—Arkal Pressurized Stormwater Filtration System: U.S. Environmental Protection Agency EPA/600/R—04/084 [variously paged].
U.S. Geological Survey, 1993, Publication of sediment size data determined by use of the sedigraph: Office of Surface Water Technical Memorandum No. 93.11, accessed September 11, 2003, at http://water.usgs.gov/admin/memo/SW/sw93.11.html
Waschbusch, R.J., 1995, Stormwater-runoff data in Madison, Wisconsin, 1993—94: U.S. Geological Survey Open-File Report 95—733, 33 p.
Waschbusch, R.J., Selbig, W.R, and Bannerman, R.T., 1999, Sources of phosphorus in stormwater and street dirt from two urban residential basins in Madison, Wisconsin, 1994—95: U.S. Geological Survey Water-Resources Investigations Report 99—4021, 25 p.
Waschbusch, R.J., 1999, Evaluation of the effectiveness of urban stormwater treatment unit in Madison, Wisconsin, 1994—95: U.S. Geological Survey Water-Resources Investigations Report 99—4021, 25 p.
Wisconsin Administrative Code, 1997, Wisconsin Department of Natural Resources, Environmental Protection General: chaps. NR100 and 200, [variously paged].
Document Accessibility: Adobe Systems Incorporated has information about PDFs and the visually impaired. This information provides tools to help make PDF files accessible. These tools convert Adobe PDF documents into HTML or ASCII text, which then can be read by a number of common screen-reading programs that synthesize text as audible speech. In addition, an accessible version of Acrobat Reader 6.0, which contains support for screen readers, is available. These tools and the accessible reader may be obtained free from Adobe at Adobe Access.
| AccessibilityFOIAPrivacyPolicies and Notices | |
 |
|