
![]()
U.S. GEOLOGICAL SURVEY
Scientific Investigations Report 2004–5237
Conceptual Model and Numerical Simulation of the Ground-Water-Flow System in the Unconsolidated Deposits of the Colville River Watershed, Stevens County, Washington
Model Applications
The calibrated model can be used to derive components of the ground-water budget or estimate the response of the regional system to new stresses such as alternative ground-water management strategies. Water-resource managers can use that information to make informed decisions to plan for future ground-water development. The uncertainty associated with inaccuracies in the ground-water-flow model is carried forward to the model applications.
Model-Derived Ground-Water Budget
A ground-water budget for September 2001 in the model area is expressed by the following equation:
GWin + R = GWout + D +ΔS, (4)| where | |
| GWin | is ground-water inflow to the model area, |
| GWout | is ground-water outflow from the model area, |
| R | is recharge, |
| D | is discharge, and |
| ΔS | is change in ground-water storage. |
Recharge to the ground-water system occurs primarily as precipitation and seepage from streams and lakes. Secondary recharge occurs as seepage from septic systems and deep percolation of irrigation water. Discharge from the system occurs as seepage to streams and lakes, as evaporation of ground water from soils and transpiration from plants, as ground-water outflow, and as pumping from wells. A more detailed representation of the ground-water budget of the Colville River Watershed model is provided by the equation:
GWin + Rppt + Rsw + Rsec =GWout + Dsw + Det + Dppg + ΔS, (5)| where | |
| Rppt | is recharge from precipitation, |
| Rsw | is recharge from streams and lakes, |
| Rsec | is secondary recharge, |
| Dsw | is discharge to streams and lakes, |
| Det | is ground-water discharge by evapotranspiration, |
| Dppg | is pumping from wells. |
All water-budget components can be quantified on the basis of the calibrated model except discharge by evapotranspiration and change in ground-water storage. Evapotranspiration from the ground-water system is unknown but was largely accounted for in the determination of recharge and assumed to be relatively insignificant (Det = 0). The Colville River Watershed model is a steady-state representation of the system, that is, inflow to the system is assumed to be equal to outflow from the system, resulting in no change in the volume of water stored within the system (ΔS = 0). The conceptual model for the Colville River Watershed assumes no ground-water inflow from outside the watershed.
Substituting the calibrated-model values and above assumptions into equation 6 yields the following (all terms are as defined above and all values are in thousands of acre-feet per year):
| IN | Rate (acre-ft/yr) × 1000 |
OUT | Rate (acre-ft/yr) × 1000 |
| GWIN | 0 | GWOUT | 9 |
| RPPT | 47 | DSW | 71 |
| RSW | 36 | DET | 0 |
| RSEC | 6 | DPPG | 9 |
| Totals | 89 | 89 |
The calibrated ground-water model budget can be used to make general conclusions about the flow system. Total flow through the ground-water system was about 89,000 acre-ft/yr. Precipitation was the primary source of ground-water recharge in the Colville River Watershed; secondary recharge was 12 percent of the total recharge. Total ground-water withdrawals for September 2001 were about 10 percent of the total flow. Ground-water outflow from the model area was 9,000 acre-ft/yr, or 10 percent of the total ground-water flow. Kahle and others (2003) reported an estimated annual ground-water discharge of 16,100 acre-ft. Considering that Kahle and others (2003) estimated a long-term annual average, the simulated ground-water discharge for September 2001 was considered reasonable. Net streamflow (gains minus losses) for all river cells was 49 ft3/s. The September 2001 monthly mean streamflow for the Colville River at Kettle Fall (station 12409000) was 50.9 ft3/s. The period of simulation, September 2001, was extremely dry so all components of the ground-water budget are presumably below average.
Simulation of Increased Ground-Water Pumping
In 1994, the DOE halted the issuance of new ground-water rights in the Colville River Watershed owing to possible hydraulic connection of the ground- and surface waters. However, the 2001 estimate of the actual water use of ground water in the Colville River Watershed was only 25 percent of the existing water right permits, certificates, and claims (Kahle and others, 2003). The challenge of the Planning Team is to supply additional water resources while limiting any adverse effects on surface water and maintaining sufficient instream flows for all users.
Ground water that discharges naturally is not necessarily available for further water development. Theis (1940) and Bredehoeft and others (1982) state any new discharge (withdrawal) superimposed on a previously stable system must be balanced by an increase in recharge, a decrease in the original discharge, a loss of aquifer storage, or by a combination of these factors. Theis (1940) reported on the hydrologic principles that govern the response of the ground-water system to increased pumping. At first, water is removed from storage as the water level declines but eventually, if the stress continues, the increased ground-water pumping will begin to reduce the natural discharge of ground water. Reduction in ground-water discharge is manifested by reduced inflow to streams and springs, reduced ground-water outflow, less evapotranspiration, and reductions in other discharge mechanisms. Increased ground-water pumping also can induce recharge from surface-water bodies such as streams and lakes. These effects can be reduced only by an increase in recharge. There is no evidence to suggest that recharge from precipitation will increase, but rather the effects of continued population growth (such as an increase in area of impervious surface) may even result in decreased precipitation recharge. (Secondary recharge would mitigate the adverse effects somewhat but at a probable reduction in water quality.) Additional ground-water pumping, therefore, would most likely result in a loss of storage (decline in ground-water levels), and a reduction in natural discharge.
The steady-state model was used to simulate the effects of several ground-water pumping alternatives. No change was made in secondary recharge from the calibrated model. Actual long-term consumptive use of water in the Colville River Watershed is small. Water used within the watershed generally is returned to the system (minus ground-water evaporation). Assuming some of the additional ground water withdrawn would become secondary recharge (through septic systems, sewage disposal, and irrigation), this method represents a conservative approach.
The uncertainty associated with inaccuracies in the model is carried forward to the ground-water pumping alternatives and new uncertainties are introduced. Drawdown in a specific model cell is an average over the entire cell. Actual drawdown in a pumped well would be much greater. The increased pumping rate assigned to a well may even exceed the actual maximum production rate of the well. For the purposes of the simulation, the pumping rate in any model cell, represented as being from a single well or a group of wells, has little effect on the results.
Some additional error may exist in the simulated drawdowns because unit UA is simulated as confined. Because the model represents unit UA as confined, the transmissivity (hydraulic conductivity times saturated thickness) remains constant instead of gradually decreasing as drawdowns increase. Actual drawdown in unit UA would then be greater than that simulated.
Effects of Increased Ground-Water Pumping at Chewelah, Loon Lake, Springdale, Addy, Kettle Falls, and Colville
Current ground-water pumping rates throughout the Colville River Watershed is less than the maximum existing water rights. The ground-water model can be used to simulate different water- management alternatives and provide information about the potential effects of simulating those alternatives. Additional ground-water pumping was simulated at seven locations by increasing pumping rates at current public-supply well locations. At five locations, the increased rate of pumping was based on 2025 projections supplied by the Planning Team. For two locations, Springdale and Addy, the rate of ground-water pumping was increased over the projected rate to provide a meaningful stress to the system. Due to the steady-state nature of the model, simulated effects are an "ultimate" response and do not indicate the time required to reach this result. In addition, all simulated alternative management strategies (different pumping rates and locations) are imposed on September 2001 conditions. Because of the below-normal precipitation for this period, the model would produce very conservative results. Patterns in system response would likely be similar during a period of average or above average precipitation, but drawdowns and associated decreases in streamflow would be smaller.
Kahle and others (2003) reported that 93 percent of the precipitation not lost to evapotranspiration ultimately discharges to the rivers and streams of the Colville River Watershed. The simulations indicate that any increase in the amount of pumping would come from increased river and lake leakage and decreased ground-water flow exiting the system table 7). The rivers and streams were divided into two groups: Colville River valley floor and tributaries. A few of the areas of simulated increased ground-water pumping are near the confluence of the Colville River and a tributary, and it is difficult to assess what percentage of the withdrawal would come from each source.
[Mgal/d, million gallons per day]
| Location of increased simulated ground-water pumping | Rate of simulate dincreased ground-water pumping (Mgal/d) | Source of simulated ground-water pumping, as a percentage of total |
|||
|---|---|---|---|---|---|
| From Colville Valley floor | From tributaries | From ground-water outflow | From ground-water flow to lakes | ||
| Chewelah (South) | 0.53 | 85 | 15 | 0 | 0 |
| Chewelah (North) | .31 | 37 | 63 | 0 | 0 |
| Loon Lake | .14 | 0 | 0 | 0 | 100 |
| Springdale | .34 | 17 | 83 | 0 | 0 |
| Addy | .53 | 75 | 22 | 3 | 0 |
| Kettle Falls | .55 | 18 | 1 | 81 | 0 |
| Colville | .29 | 7 | 89 | 4 | 0 |
Morgan and Jones (1999) reported that the capture of ground water that would otherwise discharge naturally, expressed as a percentage of the pumping rate, is nearly constant, and therefore the percentage of decrease in streamflow is directly proportional to the pumping rate of the well. This linear response is owing, in part, to the simulated constant transmissivity of the hydrogeologic units. Similar conclusions were found in the ground-water pumping alternatives presented in this report, so only one pumping rate increase for each alternative and location is presented here.
All ground-water pumping alternatives were simulated as withdrawals from unit LA, where that unit was present. For Chewelah North, Loon Lake, and Colville, unit UA was the only aquifer present. Varying the depth of the pumping well was not investigated because of the simple vertical discretization. Morgan and Jones (1999) found that pumping from successively deeper model layers will spread the capture zone over a wider downstream area. Simulating ground-water pumping immediately adjacent to a river cell would strongly localize the effects on the nearby stream.
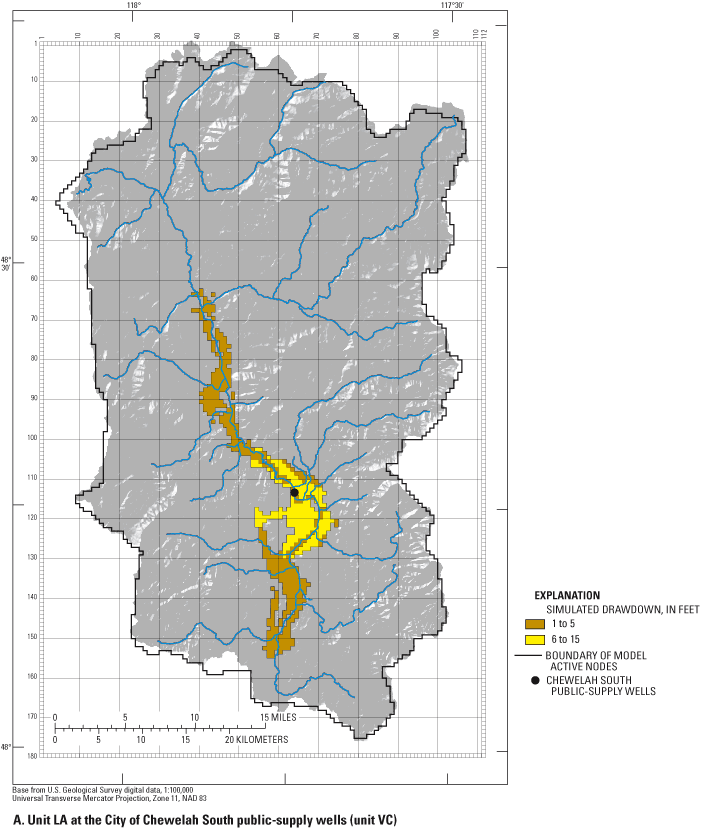
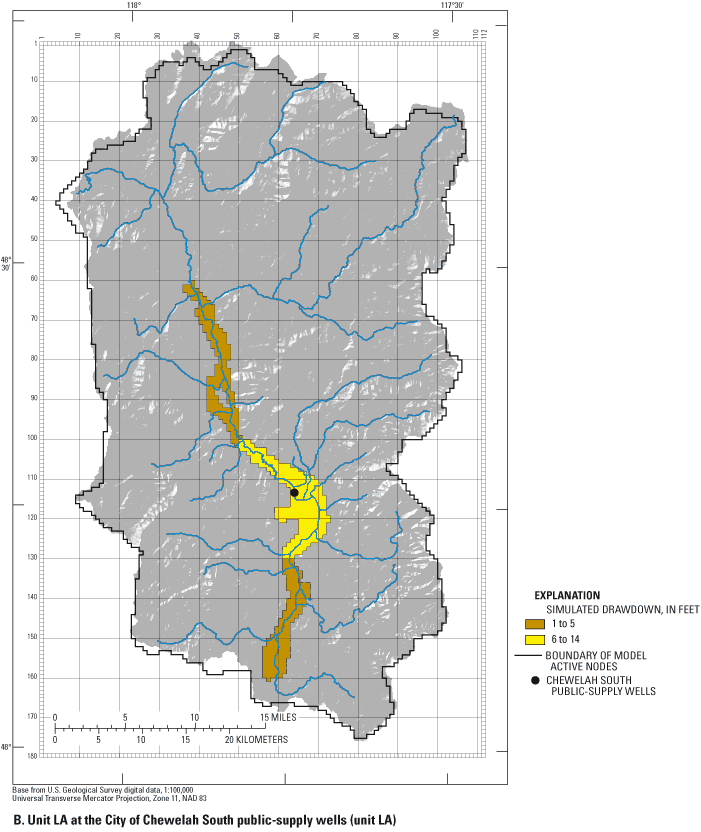
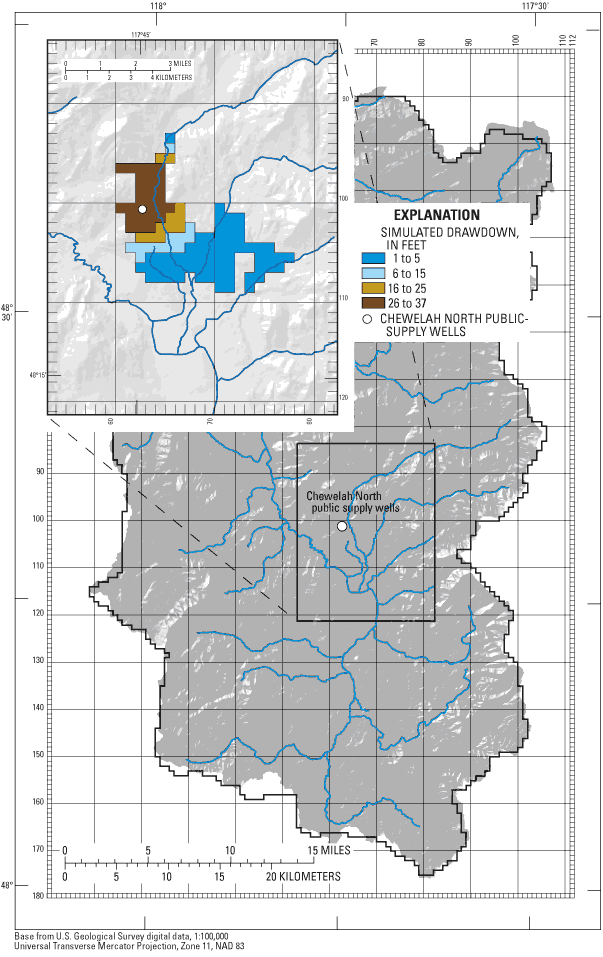
Surface-water features on the Colville River valley floor would be most affected by increased pumping at the Chewelah South public-supply wells. Surface water on the valley floor would supply about 85 percent of the ground-water pumpage and Chewelah Creek and a few other tributaries would supply about 15 percent. Simulated increased pumping at the Chewelah North wells is relatively small compared to the larger pumping rates to the south, and Chewelah Creek would be the source of most of the ground water withdrawn (63 percent).
Another way to examine the effects of increased ground-water pumping is the drawdown produced by the additional pumping. The spatial extent and magnitude of simulated drawdowns in response to increased pumping from unit LA at the City of Chewelah South public-supply wells is shown in figures 25A-B. Maximum simulated drawdowns of 15 and 14 ft occur in units VC and LA, respectively. The affected area extends from the confluence of Sheep and Deer Creek and the Colville River to Arden. The simulated drawdown for most of that area is 1 ft. The spatial extent and magnitude of drawdowns for the increased pumping from unit UA at the City of Chewelah North public-supply wells is shown in figure 26. Unit UA is relatively thin and discontinuous, and the simulated drawdowns reflect this fact. The spatial extent of drawdown is less than the Chewelah South alternative but the magnitude of drawdown is more. Water levels in the area surrounding the pumping well are lowered by as much as 37 ft.
Eighty-three percent of the increased pumping at Springdale would come from upper Sheep Creek and 17 percent from the valley floor (which includes a part of Sheep Creek). This area of the watershed most likely has a very shallow ground-water divide and any new stress to the steady-state environment may result in a shift of that divide and capture water from the watershed to the south. The Addy public-supply well would draw water from the Colville River valley floor (75 percent) and Colville River tributaries (22 percent). Increased pumping from public-supply wells near Loon Lake would have little effect on the flow of Sheep Creek. About 100 percent of the increased ground-water pumping would come from increased lake leakage to the ground-water system. The simulation of increased pumping at Kettle Falls indicates that ground water would come primarily from decreased ground-water discharge from the Lower aquifer and Bedrock. Some inaccuracies for the simulations near Loon Lake and Kettle Falls exist due to their proximity to model boundaries. In both locations, a lake is represented by a general head boundary. In the steady-state model, lake elevations remain constant and supply an infinite source of water. Lake leakage is controlled by a conductance term. The constant lake elevation maintains water levels in the area surrounding the lake, thereby minimizing simulated drawdowns. In reality, the increased leakage from the lake that would result from the increased pumping would cause a decline in lake levels.
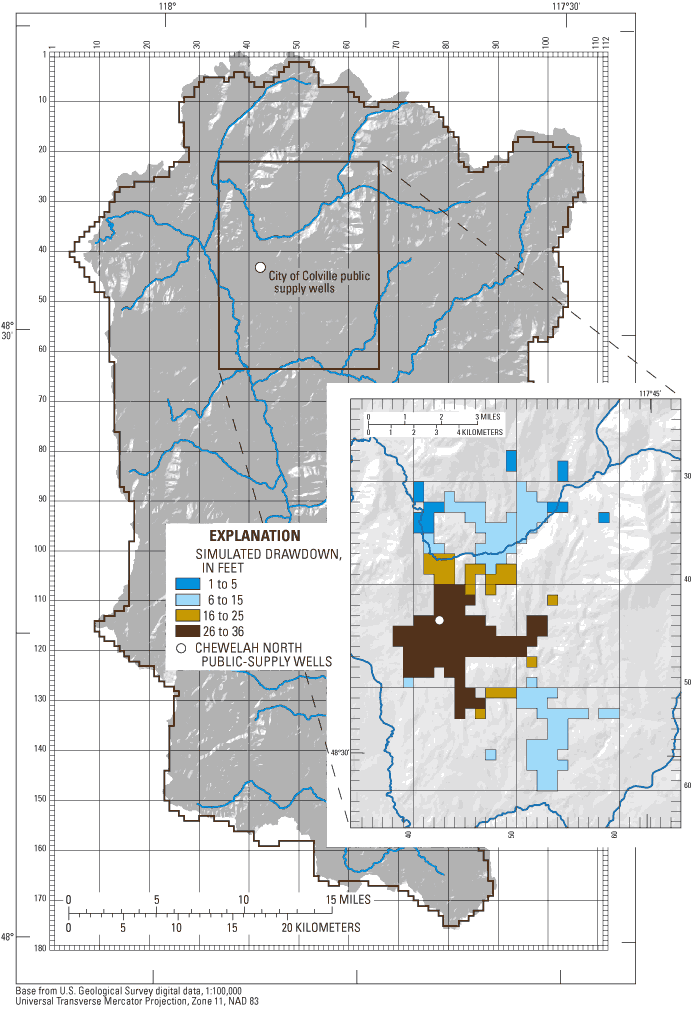
The City of Colville public-supply wells are completed in the relatively thin and discontinuous Upper aquifer (unit UA). Simulated drawdown in unit UA is shown in figure 27 for the 20 percent increase in pumping. Drawdowns in model cells adjacent to the pumping location range from 15 to 36 ft and decrease with distance from the pumping. The simulated drawdown in the outlying, disconnected cells is likely an artifact of the simplified model construction and probably would not be observed in the field. Mill Creek is the major source of water for the increased pumping (table 7).
Effects of Ground-Water Pumping from the Lower Aquifer Along the Colville River Valley
It has been suggested that the Lower aquifer (unit LA) along the main valley floor is the best potential source for further ground-water development. (Unit LA is a continuous, relatively thick unit separated from the Colville River by the thick Colville Valley confining unit.) To examine this possibility, three alternatives were simulated to examine the effects of location and pumping rate on the ground- and surface-water resources.
- Alternative 1 — simulated a pumping well near the City of Colville withdrawing water at 1.44 Mgal/d (4.4 acre-ft/d).
- Alternative 2 — simulated a pumping well near Chewelah withdrawing water at 1.44 Mgal/d (4.4 acre-ft/d).
- Alternative 3 — simulated four wells along the main Colville River valley, each pumping at a rate of 0.36 Mgal/d (1.1 acre-ft/d) for a total withdrawal of 1.44 Mgal/d (4.4 acre-ft/d).
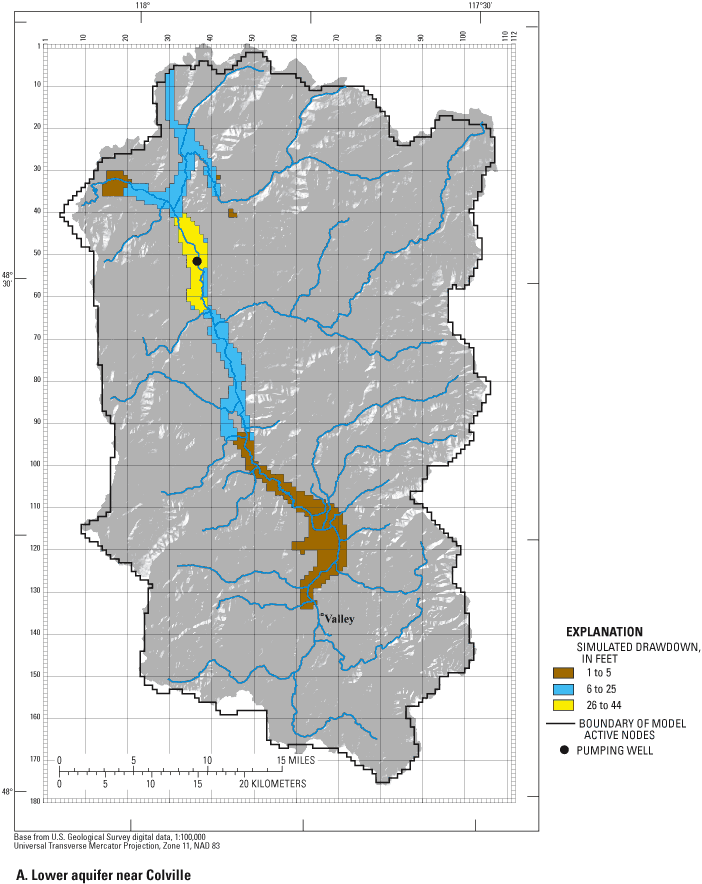
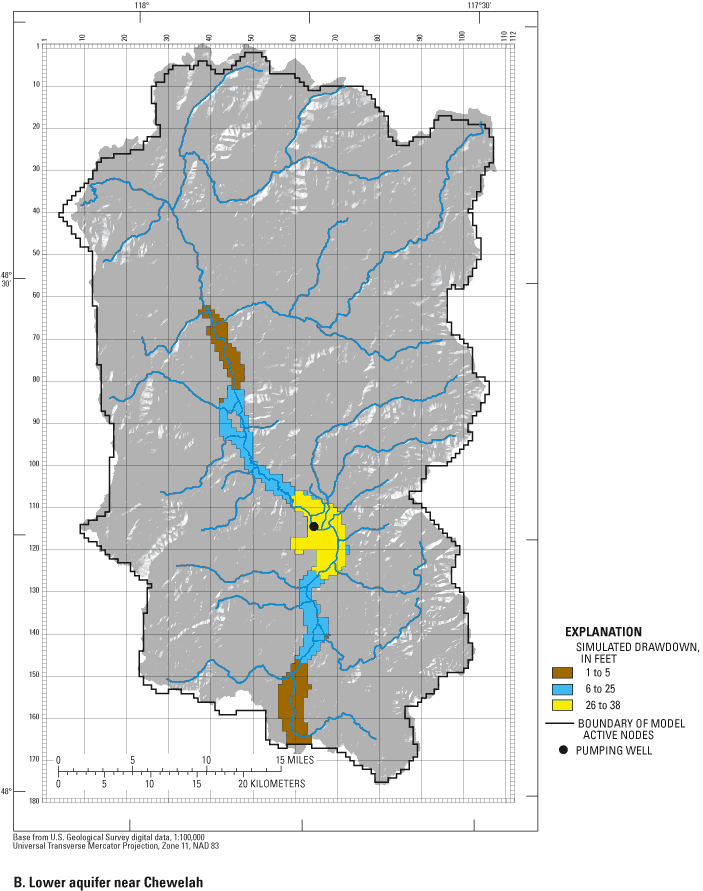
Alternative 1 results in simulated water-level declines in unit LA reaching a maximum of 44 ft near the well and extending from the northern boundary of the watershed to the town of Valley (fig. 28A). This simulated drawdown exceeds the few measured drawdown values. The ultimate response simulated by a steady-state model calibrated to a drier than average low-period undoubtedly exceeds the actual response of the system to the simulated stress under average conditions. The major sources of ground water for the withdrawal are distributed among the Colville River valley floor (44 percent), tributaries (32 percent), and ground-water outflow (24 percent) (table 8). Simulated drawdowns for alternative 2 are generally less than those for alternative 1, with maximum drawdowns reaching 38 ft (fig. 28B). The difference in drawdowns between the alternatives is owing, in part, to the wide valley floor near Chewelah. The sources of water for this alternative also are quite different. Eighty-two percent of the ground-water withdrawal is from the Colville River valley floor and 18 percent from Chewelah Creek. The greater distance of the wells from the ground-water outflow (drains) near Kettle Falls is the significant reason for the differences.
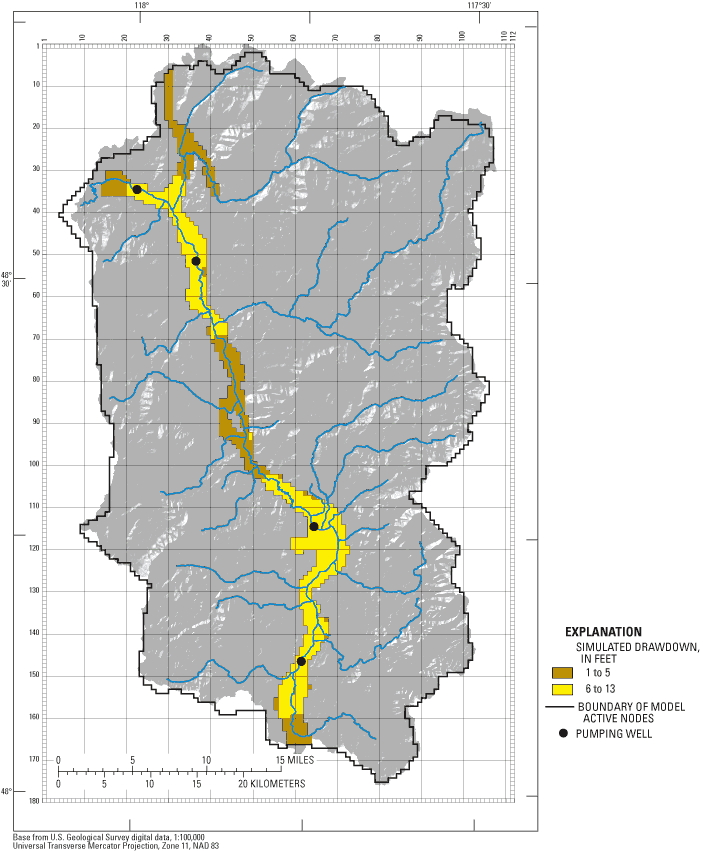
In alternative 3, water is withdrawn at the same rate as in alternatives 1 and 2 but the pumping is spread along the Colville River valley floor. Drawdowns were much less in this alternative, with a maximum water-level decline of 13 ft (fig. 29). The area affected by pumping, however, spanned the length of the unit. The sources of water for alternative 3 reflect the pumping well distribution. As the wells are spread out, so too are the major sources of pumped water. The Colville River valley floor, its tributaries, and ground-water outflow contribute 46, 29, and 25 percent, respectively.
[Mgal/d, million gallons per day]
| Alternative | Location of increased simulated ground-water pumping | Rate of simulated increased ground-water pumping (Mgal/d) | Source of simulated ground-water pumping, as a percentage of total |
||||
|---|---|---|---|---|---|---|---|
| Row | Column | From Colville Valley floor | From tributaries | From ground-water outflow | From ground-water flow to lakes | ||
| 1 | 52 | 37 | 1.44 | 44 | 32 | 24 | 0 |
| 2 | 115 | 65 | 1.44 | 82 | 18 | 0 | 0 |
| 3 | 35 | 23 | .36 | 46 | 29 | 25 | 0 |
| 52 | 37 | .36 | |||||
| 115 | 65 | .36 | |||||
| 147 | 62 | .36 | |||||
The effects of secondary recharge were examined by simulating an injection well in the same row and column as the ground-water pumping alternatives but located in the surficial unit. (A rate of 50 percent of the ground-water pumping rate was used for the injection well). Drawdowns in unit LA decreased in all three alternatives, from 44, 38, and 13 ft to 39, 34, and 12 ft, respectively. The source of the ground-water withdrawal presented in table 8 would not change, but the decrease in measured discharge would be less, as the injected water recharged the Colville River.
Simulation of Predevelopment Ground-Water and Surface-Water Conditions
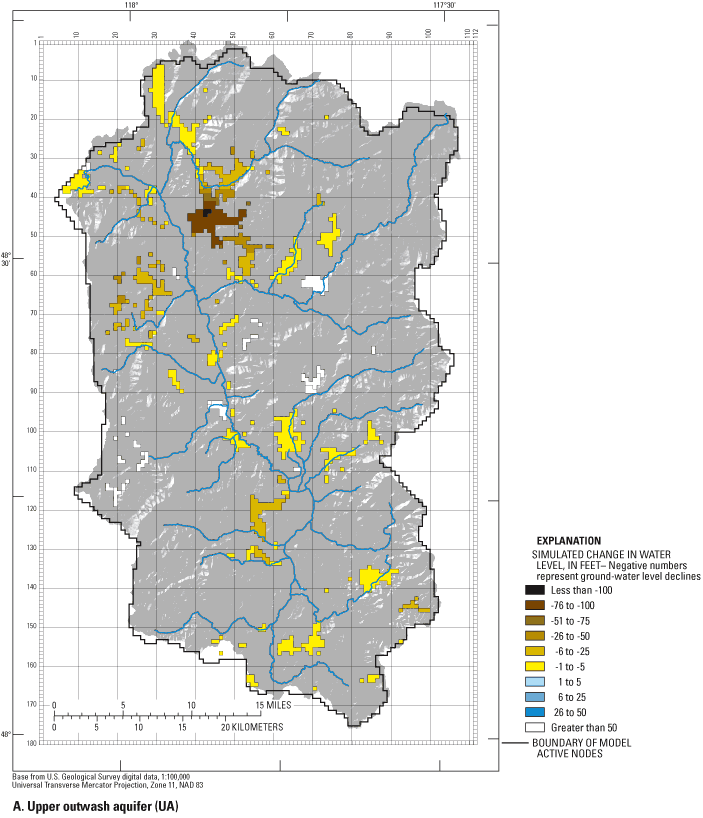
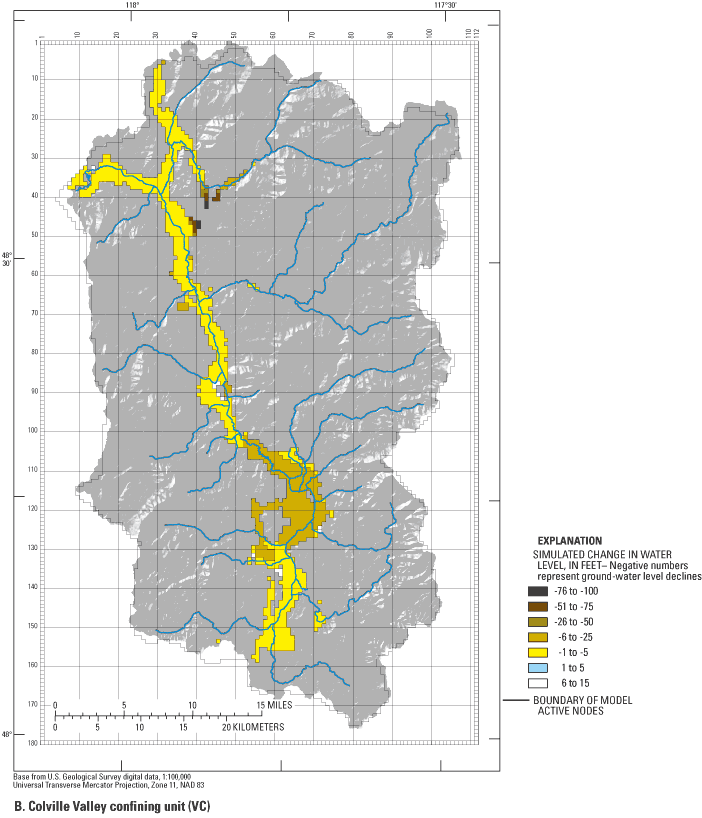
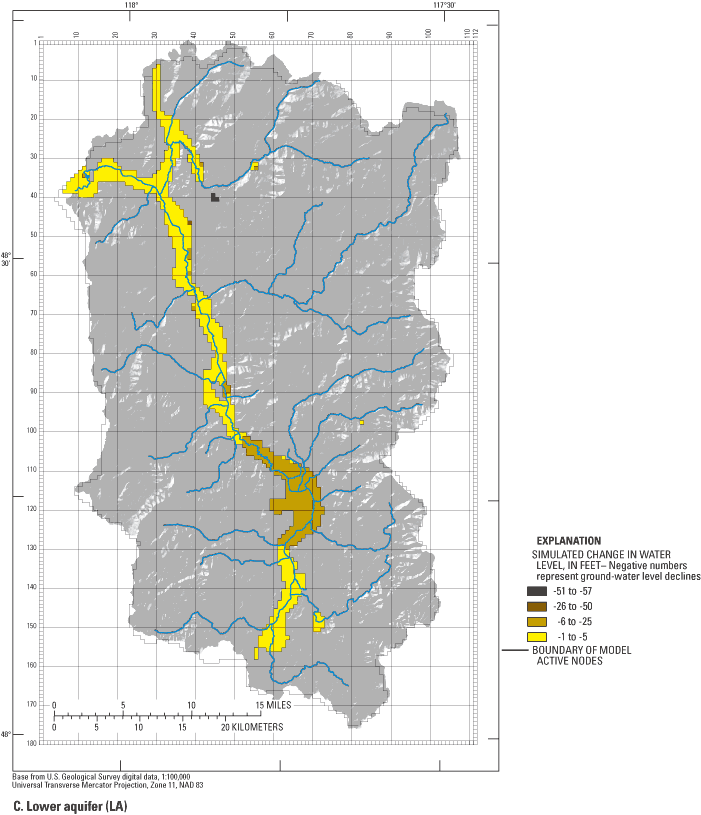
Human activity and water appropriation predates any formal system of water measurements and, as a result, predevelopment streamflow conditions are unknown. The calibrated steady-state model was used to simulate flow conditions as if no ground-water pumping, secondary recharge, or irrigation application were occurring (predevelopment conditions). Simulated changes in ground-water levels in units UA, VC, and LA are shown in figures 30A-C. The changes represent the deviation of current conditions from predevelopment conditions. Areas of positive ground-water level change represent areas where secondary recharge such as irrigation application and sewage disposal are applied. In these areas, ground-water levels would rise due to the application of the artificial recharge during the dry month of September. Predevelopment streamflow in the Colville River Watershed increased by 1.1 ft3/s (from present-day flows), or about 37 percent of net ground-water withdrawal (ground-water withdrawal minus secondary recharge). The simulated predevelopment conditions also resulted in increased ground-water outflow and lake recharge.
Simulation of Ground-Water Flow to Loon Lake, Chewelah, and Colville
Projected growth and development in three areas — Loon Lake, Chewelah, and Colville — were addressed, in part, by examining ground-water flow to local public-supply wells. These ground-water flow pathlines were estimated using the water-level contours from the areas of discharge to the areas of recharge (contributing area). The uncertainty associated with inaccuracies in the ground-water-flow model is carried forward to the contributing area.
Contributing Area for Ground-Water Pumping near Chewelah
Results of the simulations estimate the contributing area for ground-water pumping near the City of Chewelah. The pumpage in this area originated as precipitation recharge and secondary recharge up gradient along the Colville River valley (from Springdale to Chewelah). A small portion of the ground-water entered the system in the area near Springdale moved deeply into the system and upward through the bedrock. The simulated pumping wells also withdrew ground water from a few downgradient (to the north) model cells.
Contributing Area for Ground-Water Pumping near Loon Lake
The ground-water-flow model simulated six public-supply wells in the Loon Lake area with a total pumping rate of 0.39 Mgal/d (1.2 acre-ft/d) from unit UA. The water withdrawn by these wells came mostly from Loon Lake. As previously discussed, Loon Lake is represented by constant head boundary cells that (in the simulation) can supply an infinite source of water. Ground water flowing to the north side of Loon Lake came from precipitation recharge to the north and leakage from Deer Lake. The simulated contributing area was limited by the proximity of Loon Lake to the southeastern no-flow boundary. Model cells in this area are recharged locally.
Contributing Area for Colville Public-Supply Wells
The model represented the City of Colville public-supply wells with two pumping wells in unit UA withdrawing a total of 1.5 Mgal/d (4.5 acre-ft/d). River leakage from Mill Creek was a major source of the water withdrawn by the simulated wells. The water withdrawn by these wells also came from precipitation recharge, secondary recharge, and irrigation near the pumping centers.
For more information about USGS activities in Washington, visit the USGS Washington District home page .
![]()
![]()