Scientific Investigations Report 2006–5106
U.S. GEOLOGICAL SURVEY
Scientific Investigations Report 2006–5106
Annual freshwater and saline loads of DIN were delivered to Hood Canal by atmospheric precipitation falling directly on the canal water surface, surface streams flowing into the canal, regional ground water flowing from drainage basins, and from adjacent hillsides directly into the canal, shallow subsurface flow originating from human development within 150 m of the shoreline, and marine water flowing over the seaward sill. Mean annual DIN loads for 1971–2002 for each of these pathways were calculated as the product of the inflow of water from the specific pathway to Hood Canal and a representative DIN concentration for the pathway. The boundaries of Hood Canal were defined by the shoreline and the seaward sill near the Hood Canal Floating Bridge (fig. 1) and were chosen because of the locations where data were known to be available.
DIN in streams and in regional ground water in these subbasins originates from atmospheric fallout of rain and particles; from the release from the geologic reservoir within the soil column; from the production of nitrate from gaseous nitrogen that takes place in the rhizobia of some plants, such as alder trees; and from additions of nitrogen from human activities, such as septic disposal; application of fertilizers on residential and agricultural lands; and the rearing of livestock. The geologic reservoir of nitrogen within the soil column could have accumulated through natural geologic and biological processes or through human activities. During the dry season, shallow ground-water discharges provide the base flow of the streams and rivers. DIN that does not seep into streams or is not taken up by aquifer soils will travel in the ground water through unconsolidated glacial and fluvial deposits and will eventually discharge into Hood Canal.
In the Hood Canal drainage basin, the prevailing winds are from the southwest, which suggests that DIN in wet precipitation primarily is oceanic and non-local, although not entirely of natural origin. Atmospheric wet deposition to the water of Hood Canal was calculated using the surface area of Hood Canal (28,925 ha for subareas 51 to 57 of McLellan, 1954) and data on the annual wet deposition of nitrogen (N) as nitrate and ammonia (National Atmospheric Deposition Program, 2004).
The National Atmospheric Deposition Program (NADP) calculates annual wet deposition (kilograms of DIN per hectare per year) using the precipitation-averaged DIN concentrations and the amount of rainfall. The DIN concentration is the sum of nitrate concentration as N plus nitrite concentration as N plus ammonia concentration as N. Samples of precipitation are collected weekly over the annual precipitation cycle in a sampler with a specific surface area and are analyzed for concentrations of nitrate and ammonia by the NAPD. The mean annual wet DIN deposition for the nearest NADP site at the Hoh Ranger station in the Olympic National Park (see fig. 1 for locations of NADP sites) was 1.03 ± 0.38 kg/ha as N, for the 17 years between 1980 and 2002 in which the data were sufficiently complete to calculate annual wet deposition. Assuming that a DIN of 1.03 kg/ha was deposited over the entire surface area of Hood Canal, the total annual wet deposition DIN load was 30 ± 11 metric tons (MT). The annual amount of wet deposition of DIN in western Washington seems to be independent of the amount of precipitation. The annual amount of wet deposition of DIN at the long-term (1984–2002) NAPD site at LaGrande, Wash. also averaged 1.04 ± 0.29 kg/ha, whereas the mean at a site at the Marblemount Ranger Station in the North Cascades National Park was 1.85 ± 0.46 kg/ha. A DIN value of 1.85 kg/ha probably represents a maximum mean deposition to Hood Canal because Marblemount Ranger Station site probably receives more DIN from the population centers west of the Cascade Range than does Hood Canal. If the wet-deposition value for DIN from Marblemount Ranger Station site is applied to the surface area of Hood Canal, the estimated total annual wet deposition DIN load is 54 ± 13 MT.
Under a steady-state condition without additional nitrogen inputs, atmospheric nitrogen deposited on land areas of the Hood Canal basin would be delivered to Hood Canal via streamflow and ground-water flow. Annual atmospheric deposition of nitrogen accounts for an estimated 272 ± 80 MT per year for the land areas of the Hood Canal drainage basin if the annual deposition of DIN in the drainage basin is similar to the deposition at the Hoh Ranger Station (table 1).
The load of DIN delivered to Hood Canal by surface waters is estimated as the product of streamflow and its DIN concentration from the 50 subbasins draining to Hood Canal. For the purposes of calculating freshwater (streamflow and ground-water flow) DIN loads to Hood Canal, the drainage basin was divided into 50 subbasins in four geographic groups (fig. 2): the Skokomish River subbasins; other Olympic River subbasins, which includes Little Quilcene River, Big Quilcene River, Dosewallips River, Duckabush River, and Hamma Hamma River subbasins; North Olympic lowland subbasins; and the South Olympic, south shore, and Kitsap lowland subbasins. Hydroclimatic regions are identified to estimate mean flow for ungaged regions and do not coincide with the geographic groupings.
Calculations of DIN loads delivered by streamflow to Hood Canal were based on estimates of mean streamflow from 1971 to 2002 from the Skokomish River, other large rivers draining the eastern side of the Olympic Peninsula (Other Olympic Rivers), and smaller rivers and streams draining the lowlands around Hood Canal (table 2). The subbasins range in size from the 622 km2 Skokomish River subbasin to a 0.9-km2 unnamed subbasin (shore 15) north of the Hamma Hamma River (fig. 2). Complete streamflow records were available for the Skokomish River (USGS gaging station 12061500) and the Duckabush River (USGS gaging station 12054000), and partial records were available for Big Beef, Dewatto, and Mission Creeks, and the Big Quilcene, Dosewallips, Hamma Hamma, Little Quilcene, Tahuya, and Union Rivers. Records were not available for the remaining 15 streams and 24 shoreline subbasins.
For rivers with partial records, streamflow for each year, ![]() ,
of record was multiplied by an annual scaling factor. This factor was equal
to sum of the mean streamflow for 1971–2002
,
of record was multiplied by an annual scaling factor. This factor was equal
to sum of the mean streamflow for 1971–2002 ![]() of index stations with complete records (North Fork of the Skokomish River,
USGS gaging station 12056500; and the Duckabush River, USGS gaging station 12054000)
divided by sum of the annual mean streamflow
of index stations with complete records (North Fork of the Skokomish River,
USGS gaging station 12056500; and the Duckabush River, USGS gaging station 12054000)
divided by sum of the annual mean streamflow ![]() at the index stations for year
at the index stations for year ![]() .
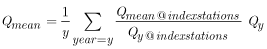
Mean streamflow
.
Mean streamflow ![]() for 1971–2002 at each station was calculated as:
for 1971–2002 at each station was calculated as:
 .
(1)
.
(1)
This approach assumes a linear correlation between annual streamflow in any river draining to Hood Canal and the annual mean streamflow of the index stations. For the Skokomish River, the gaging station on the North Fork of the Skokomish River (USGS gaging station 12056500) was used as the index station rather than station 12061500, because streamflow in the North Fork is not regulated or diverted. Mean streamflow diverted from Lake Cushman and discharged directly into Hood Canal through the penstocks of the hydroelectric powerhouse near Potlatch, Wash., in shoreline subbasin 10 was 23.2 m3/s for 1971–2002 (Todd Lloyd, Tacoma Power, written commun., July 9, 2005).
The 15 stream and 24 shoreline subbasins with no streamflow
records account for 30 percent of the drainage area of Hood Canal. The 39 ungaged
subbasins are all in lowland areas that receive less precipitation than high-altitude
basins and, thus, were estimated to have contributed less than 30 percent of
the total streamflow to Hood Canal. For these subbasins, mean streamflow ![]() for 1971–2002 was calculated using empirical relations between
for 1971–2002 was calculated using empirical relations between ![]() and drainage area (
and drainage area (![]() ),
based on streamflow records for the Hood Canal drainage basin. Relations for
estimating mean streamflow from drainage area were derived for two geographic
groups: North Olympic lowlands and South Olympic, South-Shore, and Kitsap lowlands.
Least-square regression was used to develop a power function of drainage area
for streamflow in each geographic group, where the relation minimizes the residuals
of the log-transformed calculated versus measured streamflows. Where annual
mean streamflow was available at multiple stations for a single river or stream
in a given year, the value from only one station was used.
),
based on streamflow records for the Hood Canal drainage basin. Relations for
estimating mean streamflow from drainage area were derived for two geographic
groups: North Olympic lowlands and South Olympic, South-Shore, and Kitsap lowlands.
Least-square regression was used to develop a power function of drainage area
for streamflow in each geographic group, where the relation minimizes the residuals
of the log-transformed calculated versus measured streamflows. Where annual
mean streamflow was available at multiple stations for a single river or stream
in a given year, the value from only one station was used.
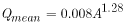
Three streamflow-gaging stations on the Big and Little Quilcene Rivers were used to develop the relation for the ungaged North Olympic lowland subbasins (fig. 3). The North Olympic lowland subbasins relation was:
 ,
(2)
,
(2)
where
 |
is mean streamflow in cubic meters per second, and |
 |
is drainage area in square kilometers (fig. 3). |
The exponent in the relation indicates that unit-area streamflow is high in large basins in this region, which is consistent with the expectation of increasing precipitation at high altitudes.
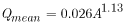
Records from gaging stations on 11 streams on the Kitsap Peninsula (table 11, at back of report) were used to develop the following streamflow-drainage area relation for the South Olympic, South- Shore, and Kitsap lowlands:
 .
(3)
.
(3)
A shoreline subbasin may include multiple, parallel streams
flowing into Hood Canal rather than a single stream. As a result, the drainage
area of a shoreline subbasin cannot be used directly in the regression equations.
Instead, each shoreline subbasin was assumed to be composed of parallel 1-km2
catchments with a combined area equal to the area of the shoreline subbasin.
In this case, ![]() for each shoreline subbasin was calculated simply as the product of area and
the coefficient (0.008 for North Olympic lowland subbasins and 0.026 for Kitsap
lowland subbasins) with 1 as the exponent in the regression equations.
for each shoreline subbasin was calculated simply as the product of area and
the coefficient (0.008 for North Olympic lowland subbasins and 0.026 for Kitsap
lowland subbasins) with 1 as the exponent in the regression equations.
Monthly streamflow was calculated based on generalized distributions for three regions of Hood Canal: the Skokomish River, other Olympic Rivers, and lowland rivers and streams. Each region represents distinct hydroclimatic settings that affect the monthly distribution of streamflow. The fraction of annual streamflow for each month was calculated at all available gaging stations in each region. The mean fraction for all stations in a region (fig. 4) was used to distribute annual streamflow among each month for the 50 river and stream subbasins draining to Hood Canal.
Historical data on DIN concentrations in 741 water samples for nine rivers and streams that drain to Hood Canal were available from the Washington State Department of Ecology (http://www.ecy.wa.gov/apps/watersheds/riv/regions/state.asp, accessed March 14, 2006) and the USGS (http://nwis.waterdata.usgs.gov/nwis/qwdata, accessed March 14, 2006) (table 3). The time series for the Skokomish, Duckabush, Dosewallips, and Hamma Hamma Rivers may indicate decreasing nitrogen concentrations; however, the series were not analyzed for trends and were assumed to be constant for this evaluation.
DIN concentrations varied greatly at each site over time, but
show weak positive relations to daily streamflow (fig.
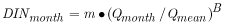
5). A general model for DIN concentration as a function of monthly streamflow
![]() scaled by mean streamflow
scaled by mean streamflow ![]() was used to assign the monthly mean concentration for each stream:
was used to assign the monthly mean concentration for each stream:
 .
(4)
.
(4)
where ![]() and
and ![]() are empirically derived coefficients.
are empirically derived coefficients.
Least-squares linear regression was applied to measured values
of streamflow and DIN concentration to determine the parameters ![]() and
and ![]() for each river and stream (table 3). The coefficient
for each river and stream (table 3). The coefficient
![]() was adjusted using the nonparametric Smearing estimator (Duan, 1983) to account
for bias in the retransformation of DIN concentration from log space. The Smearing
estimator is the mean of retransformed residuals from the least-squares regression
and was calculated for each of the nine rivers and streams with DIN concentration
data. The median values of
was adjusted using the nonparametric Smearing estimator (Duan, 1983) to account
for bias in the retransformation of DIN concentration from log space. The Smearing
estimator is the mean of retransformed residuals from the least-squares regression
and was calculated for each of the nine rivers and streams with DIN concentration
data. The median values of ![]() and
and ![]() for the nine rivers and streams were applied to estimates of DIN in other rivers
and streams draining to Hood Canal. The exponent
for the nine rivers and streams were applied to estimates of DIN in other rivers
and streams draining to Hood Canal. The exponent ![]() indicates the sensitivity of nitrogen concentrations to changes in streamflow
(low
indicates the sensitivity of nitrogen concentrations to changes in streamflow
(low ![]() values = low sensitivity; high
values = low sensitivity; high ![]() values = high sensitivity). Because this analysis indicates that DIN is only
weakly related to flow for the rivers and streams, DIN loads can be calculated
by monthly streamflow without introducing large errors. As DIN becomes more
flow dependent, however, this approach will underestimate the contribution of
DIN from high flows.
values = high sensitivity). Because this analysis indicates that DIN is only
weakly related to flow for the rivers and streams, DIN loads can be calculated
by monthly streamflow without introducing large errors. As DIN becomes more
flow dependent, however, this approach will underestimate the contribution of
DIN from high flows.
Monthly DIN loads for the 26 stream and 24 shoreline subbasins
(table 12, at back of report) were
calculated using mean streamflow (table 2), the distribution
of the monthly streamflow over the annual cycle, and the DIN concentration-streamflow
relation (eq. 4). The median values of ![]() and
and ![]() were used for the streams without data on DIN concentration. The annual DIN
load from streamflow to Hood Canal was estimated to be 493 ± 170 MT (table
2).
were used for the streams without data on DIN concentration. The annual DIN
load from streamflow to Hood Canal was estimated to be 493 ± 170 MT (table
2).
The primary aquifers around Hood Canal are unconsolidated sediments deposited by glaciers during the Pleistocene epoch. These deposits form only a thin mantle over consolidated marine sediments on the western shore of Hood Canal, but may be more than 300 m thick in the southern parts of the Hood Canal drainage basin (Vaccaro and others, 1998). Annual ground-water discharge to Hood Canal was calculated for each river or stream subbasin using a water balance, where ground-water flow was equal to annual precipitation minus streamflow and evapotranspiration (Linsley and others, 1982). Evapotranspiration was estimated to be at most 50 cm/yr from a stream subbasin. Any residual water remaining after subtracting streamflow and evapotranspiration from precipitation was allocated to ground-water flow from each stream subbasin. This approach constrains the combined inflow of ground water and streamflow to Hood Canal, but will produce errors in ground-water flow equal in magnitude, but opposite in sign, to errors in streamflow, assuming that precipitation and evapotranspiration are accurate.
Mean annual precipitation for the Hood Canal drainage basin was 217 cm and ranged from 330 cm for the Skokomish River subbasin to 81.3 cm for unnamed shoreline subbasin 23 at the northwest end of Hood Canal (U.S. Soil Conservation Service, 1965). Mean annual runoff for the Hood Canal drainage basin was 169 cm. Mean annual evapotranspiration was 37.3 cm. Precipitation and runoff are higher than in other areas of Puget Sound, but evapotranspiration is around the 20th percentile (Vaccaro and others, 1998). The residual term from the water balance was 8.7 cm, which represents the annual unit ground-water flow into Hood Canal. This is equivalent to annual ground-water flow of 7.3 m3/s to Hood Canal from the 2,640-km2 Hood Canal drainage basin. Ground-water flow to Puget Sound was estimated by Vaccaro and others (1998) to range from 0.0011 to 0.0044 m3/km2, which would equal between 2.9 and 6.9 m3/s for the Hood Canal drainage basin.
Various sources were considered for selecting a nominal concentration of DIN for ground water. The Washington Department of Health (WDOH) maintains a database with water-quality information for more than 14,000 drinking-water wells in Water Resource Inventory Areas (WRIAs) 14, 15, 16, and 17, which includes all of the Hood Canal drainage basin and surrounding regions. The median inorganic nitrogen concentration for all wells was 0.2 mg/L in WRIAs 14-17, but this includes deep wells that may not represent ground-water flow to the canal. The median inorganic nitrogen concentration reported for shallow, regional ground water in the Puget Sound Basin was 1.0 mg/L (Inkpen and others, 2000). The median nitrate-plus-nitrite concentration for 136 wells near the Naval Submarine Base Bangor (Bangor SUBASE) in Kitsap County was 0.06 mg/L (Greene, 1997). A nominal inorganic nitrogen concentration of 0.6 mg/L was selected, which represents the midpoint between WDOH and regional Puget Sound values. Based on a Hood Canal drainage basin-wide ground-water flow of 7.3 m3/s and a nominal concentration of 0.6 mg/L, the annual DIN load from regional ground water to Hood Canal was estimated to be 138 ± 77 MT (table 2).
The nitrogen load from shallow subsurface flow was calculated separately from regional ground-water flow to account for nitrogen from residential septic systems located close to the shore of Hood Canal. Septic effluent from residences close to the shore has little opportunity for denitrification and is likely to flow laterally into Hood Canal rather than vertically into regional ground water. Nitrogen load from shallow subsurface flow was calculated on the basis of seasonal estimates of the number of people in residences near the shore of Hood Canal (defined as less than 150 m) and per capita nitrogen load rates.
The nearshore population of Hood Canal is estimated using a geographic information system (GIS) and census tract data (U.S. Census Bureau, 2004). A 150-m buffer around Hood Canal was overlayed onto GIS coverage of census tracts to identify tracts wholly or partly within the buffer. Aerial photographs of the tracts partly within the buffer were reviewed to assess whether most residences were inside or outside of the buffer. Tracts that were wholly within the buffer and tracts in which most residences were located inside the buffer were retained. The population reported for the tracts was about 6,400 people (table 13, at back of report), and this number was used as the nearshore population for October through May. To account for increased occupancy of residences during summer months, the number of residences (about 4,900 housing units, table 13) was multiplied by an average occupancy rate of 2.2 people per housing unit to calculate the nearshore population of 12,200 for June through September.
Per capita estimates of DIN loads from residential septic systems were calculated assuming (1) an effluent volume of 230 ± 70 L/d (Porter, 1980; Reddy and Dunn, 1984; and Cantor and Knox, 1986); (2) a total dissolved nitrogen concentration of 55 ± 30 mg/L (Dudley and Stephenson, 1973; Porter, 1980; Cantor and Knox, 1986; and Alhajjar and others, 1987); (3) retention by the aquifer solids of the 25 percent of the total dissolved nitrogen in the dissolved organic nitrogen form (75 percent of the total dissolved nitrogen in the effluent is ammonia, which is completely nitrified); and (4) a loss of 10 percent of the total dissolved nitrogen through denitrification to nitrogen gas (N2) or volatilization of ammonia (Dudley and Stephenson, 1973; and Walker and others, 1973a, 1973b). The per capita load rate was estimated to be 2.95 kg of DIN per person per year. The annual DIN load from septic effluent to Hood Canal from nearshore residences was estimated to be 26 ± 15 MT.
The saline load of DIN was calculated as the product of the volume of Admiralty Inlet water transported over the sill in the lower layer near the Hood Canal Floating Bridge and the concentration of DIN in Admiralty Inlet water. Cokelet and others (1990) used the Knudsen’s relation that reflects conservation of water volume and mass of salt to calculate mass transport in the lower layer in the reach south of the Hood Canal Floating Bridge (called Hazel Point). In this method, available current measurements were used indirectly. Four current measurements with a total duration of 84 days from February and March 1978 were used to define the boundary (13 m) between the seaward flowing upper layer and the landward flowing lower layer. The salinity of 294 discrete samples from 37 water column hydrocasts collected between 1952 and 1955 were combined with the current profile to obtain a flux-weighted mean salinity in the surface layer (salinity of 28.07) and lower layer (salinity of 29.95). Cokelet and others (1990) used USGS streamflow data between 1951 and 1956 to calculate a mean streamflow of 166 m3/s for the Hood Canal drainage basin. Using the index station method described in the section “Estimates of Streamflow,” streamflow for the same period was estimated to be 171 m3/s. Combining the flux-weighted mean salinity in the two layers with mean streamflow into Knudsen’s relation, Cokelet and others (1990) estimated that volumetric transport in the landward-flowing bottom water ranged from 1,500 to 3,600 m3/s. Using an indirect method based on utilization of DO, Ebbesmeyer and others (1984) reported that the transport in the lower layer ranged from 1,000 to 2,000 m3/s and decreased with increasing distance from the sill. Warner and others (2001) used the dissipation of a chemical signal of chlorofluorocarbon-12 between April and December 1998 to calculate volumetric fluxes of water into the bottom water of Hood Canal over four periods. The estimated fluxes ranged from 890 m3/s (between April and June) to 3,380 m3/s (between September and October), with a mean time-weighted flux of 1,800 m3/s. The transport of water in the lower layer appears to exhibit a strong seasonal variation, and possibly inter-annual variations.
Paulson and others (1993) first reported DIN concentrations in Hood Canal from Admiralty Inlet to Lynch Cove in 1986. The DIN concentration transported by the marine inflow is estimated from the concentrations in nine samples collected at or below 40 m in Admiralty Inlet (station MB86-15) or at the entrance to Hood Canal (station HC86-8; Paulson and others, 1991). Between 1999 and 2002, Washington State Department of Ecology (2004) also collected 11 samples off Subbase Bangor in which the regeneration of inorganic nitrogen from decomposing Hood Canal organic matter appears to be unlikely. The mean DIN concentrations in 1986 (0.29 ± 0.01 mg/L) were similar to the more recent mean DIN concentrations of 0.27 ± 0.02 mg/L from the Washington Department of Ecology. DIN annually transported over the sill by marine currents based on mean DIN concentrations and estimated flows over the sill (ranging from1,000 to 3,600 m3/s) was estimated to range from 10,100 to 34,000 MT of DIN.
The direct discharge of DIN from point sources, primarily the municipal wastewater-treatment plant for a resort near Union, Washington, was estimated to be between 0.17 and 1.8 MT/yr (Fagergren and others, 2004). Between 15 and 22 MT/yr of nitrogen were associated with the carcasses of chum salmon that were disposed in the canal and were assumed to sink below the thermocline before they began to decompose and release inorganic nitrogen. Less than 22 MT/yr of nitrogen would have been released as DIN, because much of the biomass of the chum carcasses was consumed by detritus feeders (Fagergren and others, 2004). In 2004, tribal fisherman worked with PSAT to eliminate carcass dumping.
The mean annual freshwater flow from the subbasins of the Hood Canal drainage basin through surface and regional ground-water flow to the upper layer of Hood Canal was 149 m3/s of fresh water between 1971 and 2002 (table 4). Surface- and regional ground-water flow contributed 631 ± 247 MT of DIN annually.
The Skokomish River subbasin contributed about 220 MT/yr of DIN (about 35 percent of the total DIN load from the subbasins of Hood Canal listed in table 4) through both the Skokomish River and diversion flow through the powerhouse penstocks (diverted to a discharge point located in shoreline subbasin 10; see fig. 2). The significant DIN load of the Skokomish River subbasin is not a result of its high DIN concentrations (median concentration of 0.09 mg/L), but a result of its high annual flow (59 m3/s, or 40 percent of the mean annual flow). The diversion of an annual mean flow of 23 m3/s through the penstocks to shoreline subbasin 10 diverted 89 MT of DIN that otherwise would be transported in the waters of the Skokomish River. The impact of this diversion of water and nitrogen on the physics or biogeochemistry of Hood Canal is not known.
Although other Olympic River subbasins (Little Quilcene, Big Quilcine, Dosewalips, Duckabush, and Hamma Hamma) contributed about 38 percent (55 m3/s) of the freshwater flow, they contributed only about 27 percent (168 MT/yr) of the total DIN load. The low mean concentration of DIN in the Duckabush River (0.04 mg/L) and the small contribution from ground water primarily were the reasons that the DIN loads of the other Olympic River subbasins contributed a smaller percentage of the DIN load compared to their percentage of freshwater flow. In contrast, the South Olympic, South-shore, and Kitsap lowland subbasins contributed about 31 percent of the total surface- and regional ground-water DIN load (about 193 MT/yr) compared to about 19 percent (28 m3/s) of freshwater flow. In particular, Union River, a lowland subbasin, contributed 4.8 percent (30.6 MT/yr) of total DIN load (table 2) from surface and regional ground water, compared to 1.5 percent (2.2 m3/s) of freshwater flow, because of its high median DIN concentration (0.37 mg/L). The North Olympics and South Olympic, South-shore, and Kitsap lowland subbasins also contributed most of the ground-water discharge (72 percent) to Hood Canal. Of the estimated DIN load from the North Olympic lowland subbasins (3 percent of total Hood Canal load from all surface and regional ground water), 40 percent is calculated to come from ground-water flow.
In addition to surface- and regional ground-water flow, wet precipitation and shallow ground-water flow from septic systems also add fresh water and DIN to the upper layer of Hood Canal (table 5). Wet atmospheric precipitation annually added 30 ± 11 MT of DIN to the upper layer of Hood Canal from the Hood Canal Floating Bridge to Lynch Cove. Shallow shoreline septic systems were estimated to contribute 26 MT ± 15 MT. Of the 688 MT of DIN added to the upper layer of Hood Canal, surface flow contributed 72 percent of the total DIN load and regional ground-water flow contributed 20 percent. Shallow ground-water flow from shallow shoreline septic systems and atmospheric deposition each contributed 4 percent.
The emphasis on DIN in this report may underestimate the loads of nitrogen that could be biologically active. For instance, wet deposition of atmospheric DIN does not include biologically active sources of atmospheric dryfall. Likewise, the dissolved organic nitrogen is not included in the DIN loads of surface water. Total dissolved nitrogen (TDN), which includes DIN and dissolved organic nitrogen, was reported for 337 samples collected from nine surface-water stations in the subbasins of Hood Canal (table 3). The median TDN concentration was 20 percent higher than the concentration of DIN for samples in which both constituents were analyzed. Thus, the total dissolved nitrogen load may be about 20 percent higher than the DIN load. Loads from several sources are highly uncertain. For the saline loads from Admiralty Inlet, there is a three-fold difference between the low and high estimates. Estimates for septic systems were based on several assumptions that have been inferred from studies in other regions. These assumptions have not been validated for the soil type and land use surrounding Hood Canal. Likewise, both the flow estimates of regional ground water and the concentrations of biologically active nitrogen species in ground water are highly uncertain. The estimates of ground-water flow into Hood Canal were not based on direct measurements or from a hydrogeological model. The concentrations of dissolved nitrogen species were estimated from well data from various depths and may not reflect the influences of biogeochemical reactions affecting shallow subsurface transport of nitrogen.
The relative contribution of these four freshwater sources of DIN to the upper layer of Hood Canal changed significantly throughout the year. Sixty-seven percent of the surface-water loads were added from November through March (fig. 6). To a lesser degree, the load of DIN from atmospheric precipitation followed the seasonal pattern of surface-water flow. The regional ground water was treated as having constant discharge throughout the year, so its relative contribution increased during the summer months. The relative contributions of shallow ground-water flow from shallow shoreline septic systems also increased significantly because of the increased population along the shore when summer homes were occupied. The subsurface loads of DIN from the combination of the regional ground-water system and shallow shoreline septic systems were estimated to have contributed more than one-half of the DIN discharged into the upper layer of Hood Canal during the summer. In the region of The Great Bend and Lynch Cove, most of the DIN added to the surface water was assimilated to produce organic matter that can reduce DO concentrations in the lower layer during the critical autumn period, when DO concentrations are lowest (Paulson and others, 1993).
In order for the large load of DIN associated with saline water from Admiralty Inlet to be assimilated into biomass, it must first mix upwards into an upper layer that has been stratified sufficiently to sustain phytoplankton growth. If there were no upward mixing of saline water, the salinity of the upper layer would be zero. However, the mean salinity in the upper layer of Hood Canal was 28.07, compared to a bottom salinity of 29.95. Mass-balance calculations indicated that 94 percent of the volume of water in the upper layer was saline water and demonstrated that upward mixing of marine water into the upper layer was occurring in Hood Canal. More than 80 percent of the volume of the upper layer of Hood Canal from Lynch Cove to Eldon had DIN concentrations that were lower than expected from conservative mixing of saline-derived DIN upwards into the upper layer of Hood Canal (Paulson and others, 1993). This depletion of DIN in the upper water suggests that a significant portion of the DIN derived from Admiralty Inlet water that had mixed upward had been assimilated into biomass. Although it is clear that saline-derived DIN is being assimilated into biomass that sinks and consumes oxygen in the deep water of Hood Canal, the rate at which saline-derived nitrogen is being assimilated is unknown.
For more information about USGS activities in Washington, visit the USGS Washington Water Science Center home page.

![]() U.S.
Department of the Interior | U.S. Geological
Survey
U.S.
Department of the Interior | U.S. Geological
Survey
Persistent URL: https://pubs.water.usgs.gov/sir20065106
Page Contact Information: Publications Team
Page Last Modified: Thursday, 01-Dec-2016 19:03:33 EST
