Scientific Investigations Report 2007–5014
Prepared in cooperation with the Lac Courte Oreilles Band of Lake Superior Chippewa
This report is available for download (1,147
KB).

Abstract
Introduction
Purpose and Scope
Physical Setting
Data Sources
Assumptions and Limitations
Methods
Conceptual Model
Development of the Regional GFLOW Model
Refinement of the Model Near New Post
Model Calibration
Simulation of Changes in Grindstone Creek Base Flow due to Hydrologic Stress
Scenario 1—Average Annual Withdrawal
Scenario 2—Maximum Seasonal Withdrawal
for Peak Demand
Effect on Grindstone Creek
Application of the Model to Simulate Zones of Contribution to Existing and Possible
Replacement Wells Near New Post
Summary and Conclusions
Acknowledgments
References
Appendix--Supplemental Data
Figure 1. Map showing the location of the Grindstone Creek and New Post study areas, Sawyer County, Wis.
Figure 2. Diagram showing conceptual model of the hydrologic system in Sawyer County, Wis., in A, the vicinity of Grindstone Creek, and B, the vicinity of New Post, Wis.
Figure 3. Maps showing simulated hydrologic features with analytic elements in A, the far field and B, the near field, with calibrated water-table elevations, water-level residuals, and base-flow residuals.
Figure 4. Maps showing location of locally refined model area around New Post, Sawyer County, Wis.
Figure 5. Graph showing model-simulated and observed water-level altitudes and associated calibration statistics for the regional model.
Figure 6. Maps showing simulated zone of contribution to the two wells that supply drinking water to the community of New Post, Sawyer County, Wis.
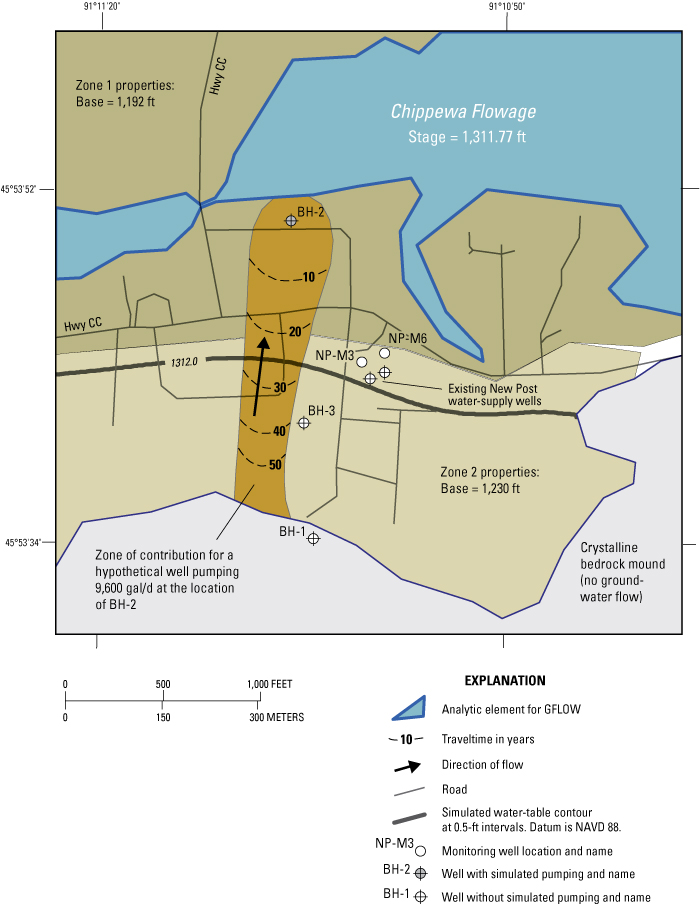
Figure 7. Maps showing simulated zone of contribution to a possible replacement well pumping at 9,600 gallons per day at the location of BH-2.
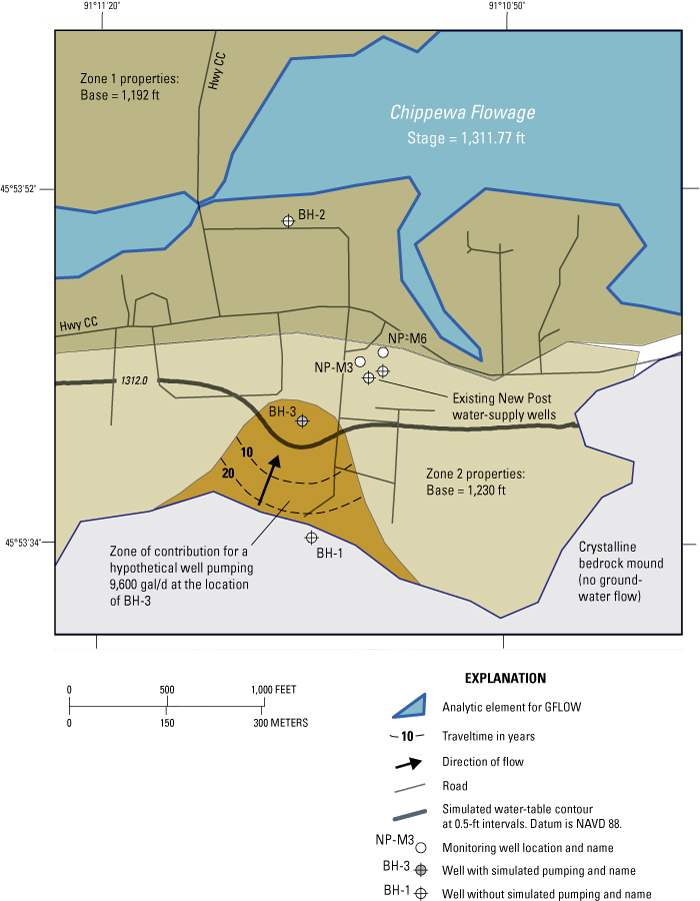
Figure 8. Maps showing simulated zone of contribution to a possible replacement well pumping at 9,600 gallons per day at the location of BH-3.
Table 1. Measured and simulated values and weighting statistics of ground-water-level and base-flow targets used for the regional model calibration, Sawyer County, Wis.
Table 2. Measured and simulated water levels in two wells used to evaluate
the
regional model calibration for local simulations of the New Post area,
Sawyer County, Wis.
Table 3. Calibrated parameter values for the analytic element model and UCODE- calculated composite scaled sensitivities (CSS) of the parameters.
Table 4. Simulated results for base flows and water levels in the Grindstone Creek area, Wis., for scenario 1 with average annual withdrawal from upgradient irrigation wells.
Table 5. Simulated results for base flows and water levels in the Grindstone Creek area, Wis., for scenario 2 with maximum seasonal withdrawal from upgradient irrigation wells.
Multiply |
By |
To Obtain |
Length |
||
| inch (in.) | centimeter (cm) | |
| foot (ft) | meter (m) | |
| mile (mi) | kilometer (km) | |
Volume |
||
| gallon (gal) | liter (L) | |
| million gallons (Mgal) |
cubic meter (m3) | |
Flow rate |
||
| cubic foot per second (ft3/s) | cubic meter per second (m3/s) | |
| gallon per minute (gal/min) |
liter per second (L/s) | |
| gallon per day (gal/d) |
|
cubic meter per day (m3/d) |
| inch per year (in/yr) |
millimeter per year (mm/yr) | |
| foot per day (ft/d) |
meter per day (m/d) | |
| foot squared per day (ft2/d) | meter squared per day (m2/d) | |
Vertical coordinate information is referenced to the North American Vertical Datum of 1988 (NAVD 88). Elevation, as used in this report, refers to distance above the vertical datum. * Hydraulic conductivity: The standard unit for hydraulic conductivity is cubic foot per day per square foot of aquifer cross-sectional area (ft3/d/ft2). In this report, the mathematically reduced form, foot per day (ft/d), is used for convenience. ** Transmissivity: The standard unit for transmissivity is cubic foot per day per square foot times foot of aquifer thickness [(ft3/d)/ft2]ft. In this report, the mathematically reduced form, foot squared per day (ft2/d), is used for convenience. |
||
A two-dimensional, steady-state ground-water-flow model of Grindstone Creek, the New Post community, and the surrounding areas was developed using the analytic element computer code GFLOW. The parameter estimation code UCODE was used to obtain a best fit of the model to measured water levels and streamflows. The calibrated model was then used to simulate the effect of ground-water pumping on base flow in Grindstone Creek. Local refinements to the regional model were subsequently added in the New Post area, and local water-level data were used to evaluate the regional model calibration. The locally refined New Post model was also used to simulate the areal extent of capture for two existing water-supply wells and two possible replacement wells.
Calibration of the regional Grindstone Creek simulation resulted in horizontal hydraulic conductivity values of 58.2 feet per day (ft/d) for the regional glacial and sandstone aquifer and 7.9 ft/d for glacial thrust-mass areas. Ground-water recharge in the calibrated regional model was 10.1 inches per year. Simulation of a golf-course irrigation well, located roughly 4,000 feet away from the creek, and pumping at 46 gallons per minute (0.10 cubic feet per second, ft3/s), reduced base flow in Grindstone Creek by 0.05 ft3/s, or 0.6 percent of the median base flow during water year 2003, compared to the calibrated model simulation without pumping. A simulation of peak pumping periods (347 gallons per minute or 0.77 ft3/s) reduced base flow in Grindstone Creek by 0.4 ft3/s (4.9 percent of the median base flow).
Capture zones for existing and possible replacement wells delineated by the local New Post simulation extend from the well locations to an area south of the pumping well locations. Shallow crystalline bedrock, generally located south of the community, limits the extent of the aquifer and thus the southerly extent of the capture zones. Simulated steady-state pumping at a rate of 9,600 gallons per day (gal/d) from a possible replacement well near the Chippewa Flowage induced 70 gal/d of water from the flowage to enter the aquifer. Although no water-quality samples were collected from the Chippewa Flowage or the ground-water system, surface-water leakage into the ground-water system could potentially change the local water quality in the aquifer.
Grindstone Creek is a 3-mile-long stream near Hayward, Wis. (fig. 1), that receives much of its flow from four spring complexes. Because the springs are fed by discharge from the ground-water system, hydrologic stresses to the ground-water system could reduce springflow and related streamflow. In order to assess the effects of stresses on the creek, a study was done by the U.S. Geological Survey (USGS), in cooperation with the Lac Courte Oreilles Band of Lake Superior Chippewa (LCO). Initial study objectives were to measure streamflow in Grindstone Creek and, by use of an analytic element ground-water model, simulate the effects of proposed pumping for golf-course irrigation on base flow in Grindstone Creek.
Figure 1. Location of the Grindstone Creek and New Post study areas, Sawyer County, Wis.
After the project began, an additional work element was included–delineating capture zones for existing water-supply wells and possible future well locations near the community of New Post. The community of New Post, located on the eastern side of the LCO reservation in Sawyer County, Wis. (fig. 1) has approximately 50 residents. In order to improve understanding of the local aquifer characteristics and directions of ground-water flow in the New Post area, a field investigation and additional model simulations were done by the USGS, in cooperation with the LCO. The field investigation focused on characterizing the lithologic sediments of the unconsolidated aquifer near New Post.
This report describes the construction and results of two-dimensional, steady-state, ground-water-flow modeling of the shallow hydrologic system near Grindstone Creek, the community of New Post, and the surrounding areas. Geologic and hydrologic data used during this study consisted of interpretive maps, previously published reports, and historical and contemporary streamflow and water-level measurements. These data and exploratory drilling at three sites in the vicinity of New Post form the basis for development of the ground-water-flow model. The calibration of the model is discussed, and results of simulations made with the calibrated model are used to describe effects of ground-water withdrawal on base flow in Grindstone Creek and capture zones for existing and two possible future water-supply wells for the Community of New Post. Because of the emphasis on ground-water/surface-water interaction and the absence of confining units in the modeled area, the work focused on the shallow ground-water-flow system near Grindstone Creek and the community of New Post.
Grindstone Creek, in west-central Sawyer County, Wis. (fig. 1), is a first-order stream (no tributaries) that is fed primarily by four spring complexes. Seepage and drainage lakes are common in the area and influence the ground-water-flow system. Grindstone Lake, an important regional-flow-system boundary, receives input from Grindstone Creek, direct precipitation, overland runoff, and ground-water discharge (Tyrolt, n.d.), and drains into Lac Courte Oreilles to the south.
The community of New Post is in central Sawyer County along the southern shores of the Chippewa Flowage (fig. 1). The ground-water-flow system near New Post is bounded by the Chippewa Flowage to the north and a buried mound of crystalline bedrock to the south. The regional ground-water system of the Grindstone Creek and New Post areas is drained by the Namekagon River to the north and west and tributaries of the Chippewa River to the south and east.
Geologic data used in this study consisted of interpretive maps by Clayton (1984), Mudrey and others (1982), and Water Resources Management Program (1991); aquifer-test analyses reported by Tyrolt (2002); and lithologic samples collected as part of this project by the USGS and LCO Conservation Department in October 2005. These data were used to estimate the distribution and properties of bedrock and glacial sedimentary deposits. USGS 7.5-minute topographic maps were used to locate and estimate elevations of surface-water features and to estimate the location of a crystalline bedrock mound near New Post. The elevation of Grindstone Creek and Grindstone Lake were later refined on the basis of a field survey on November 20−21, 2003. The elevation of the Chippewa Flowage was refined for the local New Post simulation on the basis of data from the outlet dam near Winter, Wis. (Robert Olson, Xcel Energy, written commun., 2006) and a field survey by the LCO Conservation Department on April 13, 2006.
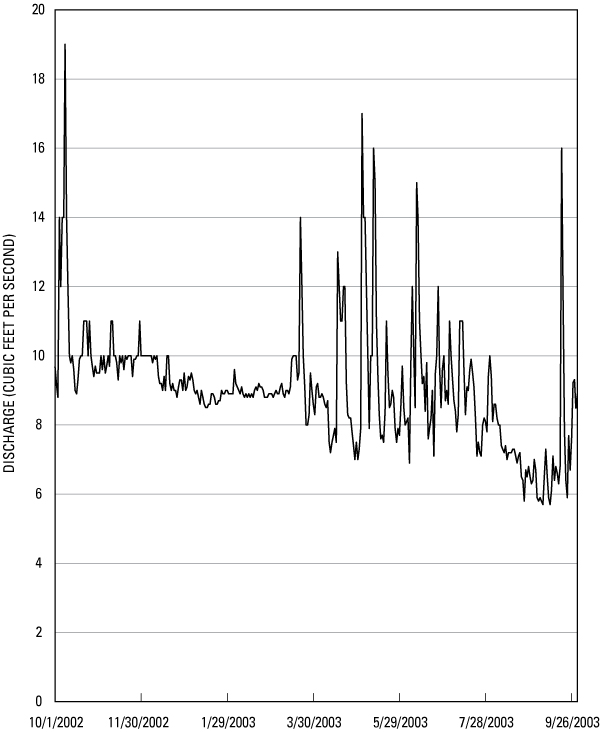
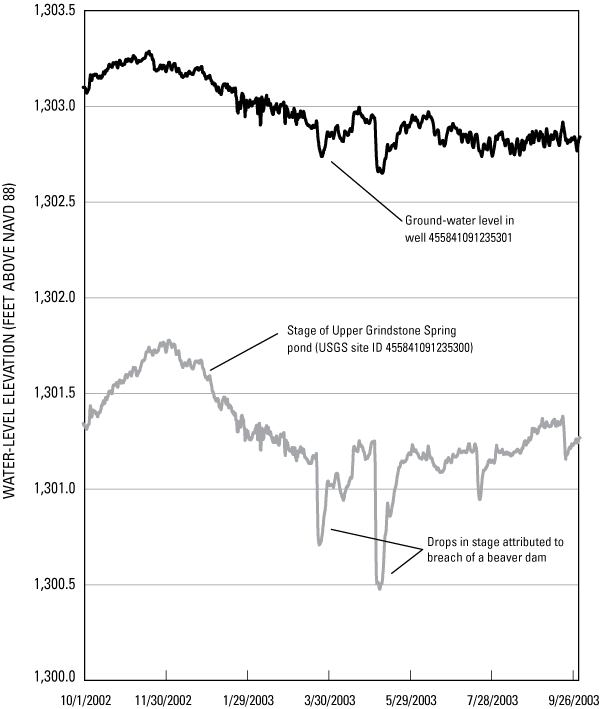
Streamflow and water-level data were obtained from historical records maintained in the USGS National Water Inventory System (NWIS) database (Dempster, 1990), a source-water protection plan for the LCO reservation (Tyrolt, 2002), and measurements made during this study. A gaging station (USGS station ID 05356078) was installed to measure streamflow in Grindstone Creek at County Highway E from October 1, 2002, to September 30, 2003. Water levels were also measured in the Upper Grindstone Spring pond (USGS site ID 455841091235300) and in a USGS-installed well (USGS site ID 455841091235301) located about 15 ft north of the pond. Hydrographs of daily streamflow and ground-water and surface-water levels are included in appendix figures 1 and 2; data for these sites are published in Waschbusch and others (2004).
Given the relatively high hydraulic conductivity of the aquifer, relatively high net annual precipitation, and presence of springs and perennial headwater streams, the ground-water and surface-water systems were assumed to be in close hydrologic connection in the modeled area and elevations of surface-water features to be representative of the ground-water system. Areal two-dimensional assumptions were assumed to be appropriate for the model because the ground-water-flow system is thin and areally extensive. Steady-state assumptions were assumed to be appropriate for this system because hydraulic conductivity is high and distances between surface-water features are relatively small; these characteristics help dampen the effects of periodic transient stresses applied to the system (Haitjema, 1995). Steady-state assumptions, which ignore ground-water release from storage, can be expected to result in an estimate of the higher range of system response to a hydrologic stress.
Limitations of the model result from these assumptions. Namely, local three-dimensional flow and transient system response expected near wells and surface-water features are only approximately represented. In addition, local features of the ground-water system (for example, local variations in hydraulic conductivity and recharge) are only approximated by the regional model.
An analytic element ground-water-flow model, using the computer program GFLOW (Haitjema, 1995), was developed to simulate the ground-water system and its interaction with surface-water features. A complete description of analytic elements is beyond the scope of this report, but a brief description follows. Hunt (2006) gives a review of applications of the analytic element method and Haitjema (1995) discusses the underlying concepts and mathematics of the method in detail.
An infinite aquifer is assumed in analytic element modeling. The problem domain (model area) does not require a grid or involve interpolation between cells. To construct an analytic element model, features important for controlling ground-water flow (for example, wells and surface-water features) are entered as mathematical elements or strings of elements. The amount of detail specified for the features depends on distance from the area of interest. Each element is represented by an analytic solution. The effects of these individual solutions are added together to form a solution for any location in the simulated ground-water-flow system. Because the solution is not confined to a grid, heads and flows can be computed anywhere in the model domain without nodal averaging. In the GFLOW model used here, the analytic elements are two dimensional and are used only to simulate steady-state conditions (that is, water levels that do not vary with time). The analytic element method and comparisons of analytic element to finite-difference numerical model techniques have been discussed by others (Haitjema, 1995; Hunt and Krohelski, 1996; Hunt and others 1998; and Hunt and others, 2003).
The GFLOW model was calibrated by means of parameter estimation techniques. Numerous publications detail the advantages of parameter estimation models (for example, Poeter and Hill, 1997 and Hill, 1998). Briefly, the primary benefit of a properly prepared parameter estimation model over typical trial-and-error calibration is the ability to automatically calculate parameter values (for example, hydraulic conductivity and recharge) that are a quantified best fit between simulated model output and observed data (for example, ground-water levels and streamflows). In addition, parameter correlation (for example, correlation of hydraulic conductivity with recharge) and parameter sensitivity can be quantified and assessed. In this study, the GFLOW model was coupled with the parameter estimation code UCODE (Poeter and Hill, 1998).
Before simulating the ground-water system using a flow-modeling code, a conceptualization of the hydrologic system is essential because it forms the framework for model development and reduces the ground-water system into important component parts. This reduction is a necessary simplification of the hydrologic system because inclusion of all of the complexities into a model is not feasible. Steps in the development of the conceptual model include (1) characterization of the aquifer(s) (2) identification of sources and sinks of water, and (3) identification and delineation of hydrologic boundaries in the area of interest. The conceptual model of the hydrologic system is shown in figure 2A for the area near Grindstone Creek and in figure 2B for the area near New Post.
Figure 2. Conceptual models of the hydrologic system in Sawyer County, Wis., in A, the vicinity of Grindstone Creek, and B, the vicinity of New Post, Wis. The conceptual models are not drawn to scale.
The regional ground-water system in the Grindstone Creek area comprises both shallow and deep aquifers. The shallow aquifer consists of laterally extensive glacial deposits, composed primarily of sandy till and stream deposits that are about 200 ft thick near Grindstone Creek. The deep aquifer consists of Cambrian sandstones (roughly 100 ft thick near Grindstone Creek) that thicken as they extend to the southwest of Grindstone Creek and pinch out within 3 mi to the north and east of Grindstone Creek. Where the sandstone is absent, glacial sediments are deposited directly on crystalline bedrock. The sandstone and glacial deposits were simulated together as a single aquifer in the ground-water-flow model (as conceptualized in fig. 2) because (1) the ability of the sandstone to transmit water is less than that of the overlying glacial aquifer, meaning that the ground-water-flow system is dominated by the glacial sediments, and (2) initial sensitivity analyses with the analytic element model showed that differentiating between areas of glacial sediments underlain by sandstone rather than crystalline bedrock was not needed to calibrate the model. Furthermore, Juckem and others (2003) demonstrated that simulated base-flow reductions in Grindstone Creek due to pumping agreed to within 1 percent when results from a one-layer model were compared to results from a four-layer model that included aquifer heterogeneity.
Glacial sediments were deposited directly on top of crystalline rocks in the New Post area and therefore comprise the entire aquifer in this area. Thickness of the glacial sediments is varied and related in part to the elevation of the underlying crystalline bedrock. Bedrock is within 25 ft of the land surface along the southern edge of New Post, where it forms a major hydraulic boundary for the glacial aquifer, but is more than 100 ft below land surface beneath most of New Post and the area north of the community. The topography of the crystalline bedrock in the New Post area is constrained in the conceptual model by data from three geologic borings drilled for this study but is otherwise only approximately known away from the New Post area.
Ground water moves from higher to lower hydraulic potential (areas of higher ground-water levels to areas of lower ground-water levels). As a result, ground water generally discharges to surface-water features or pumping wells and recharges in areas away from these features. Grindstone Springs and the downstream Grindstone Creek system (fig. 1) receive appreciable discharge from the ground-water system; hydrograph separation indicates that ground-water-derived base flow made up about 92 percent of the total streamflow in Grindstone Creek during water year 2003 (USGS unpublished data). The Chippewa Flowage is a ground-water discharge area near New Post. The stage of this large reservoir controls the water-table elevation in areas near the flowage, such as New Post.
Initial model development included estimating the elevation of the base of the ground-water system, a recharge rate, and a horizontal hydraulic conductivity. The base of the model (1,100 ft above NAVD 88) roughly corresponds with the top of the crystalline bedrock near the area of Grindstone Creek. Sandstone (where present) and glacial sediments that overlie sandstone and crystalline bedrock were incorporated into a single model layer with a single regional hydraulic conductivity. In two-dimensional areal models, where transmissivity of a single layer represents the flow system, the base elevation is correlated with hydraulic conductivity. Therefore, parameter calibration focused on horizontal hydraulic conductivity rather than the aquifer base elevation. In addition to horizontal hydraulic conductivity, ground-water recharge was also considered a calibration parameter; therefore, these two parameters were varied during model calibration. Initially, one recharge and horizontal-hydraulic-conductivity zone was used to represent the entire model domain. After calibration of the regional Grindstone Creek simulation, however, it was determined that the shallow ground-water system is better represented by one recharge value and two hydraulic-conductivity zones that represented variability in hydraulic properties of the glacial sediments.
Because analytic element models are gridless and are well suited for rescaling to any area of the model domain, the regional model of the Grindstone Creek area was later locally refined for simulations in the New Post area. The following modifications were made in the refined model: (1) Two zones were added near New Post, where the base of the model was adjusted according to measurements of the depth to crystalline bedrock. (2) An impermeable area (no ground-water movement) was added south of New Post, where crystalline bedrock is near land surface. Therefore, the final model incorporated one recharge zone, two hydraulic-conductivity zones representing variability in the hydraulic properties of the glacial sediments, two areas where the base of the model was varied from the regional value, and an impermeable area where crystalline bedrock is near the land surface.
The ground-water-flow model consists of far-field and near-field elements that are determined by the model area of interest or by the need to simulate base flow along rivers for comparison with measured values during calibration. On the basis of the conceptual model, the location and elevation of far-field surface-water features were added to the model (fig. 3A). These are rivers and lakes distant from Grindstone Creek and the community of New Post that are simulated with coarse linesink networks and little or no resistance between the surface-water features and the ground-water system. Because an infinite aquifer extent is assumed in the analytic element method, the purpose of simulating the far-field features is to control the water levels at the model boundary and have the model explicitly simulate the large-scale ground-water flow around Grindstone Creek, the community of New Post (the near-field area of interest), and rivers with streamflow data used to calibrate the model (fig. 3A). The Namekagon River and its tributaries were simulated as near-field elements in order for the model to route streamflow along the river, which was compared to measured streamflows during calibration. The near-field area of interest encompasses (1) Grindstone Creek, Grindstone Lake, Spring Lake, Round Lake, and the area near the irrigation wells, in addition to other nearby features that affect the hydrology of Grindstone Creek (fig. 3B), and (2) the New Post area (where water-supply wells exist or might be installed in the near future), the Chippewa Flowage, nearby streams, and the area where crystalline bedrock is near land surface (fig. 4).
Figure 3. Simulated hydrologic features with analytic elements in A, the far field and B, the near field, with calibrated water-table elevations, water-level residuals, and base-flow residuals (ft3/s, cubic foot per second).
Figure 4. Location of locally refined model area around New Post, Sawyer County, Wis.
Streambed-sediment resistance in the near field was set equal to 0.5 day. Resistance is defined as the streambed-sediment thickness divided by the vertical hydraulic conductivity. For example, the model value of 0.5 day corresponds to a 1-ft sediment thickness and a vertical hydraulic conductivity of 2 ft/d. Parameter sensitivity assessments with UCODE demonstrated that the model results were not sensitive to changes in streambed resistance when varied over reasonable ranges; therefore, the values for all streams were fixed in all model runs. The width of each stream was assigned according to stream order and field observations, and it ranged from 10 to 100 ft. Streams in the far field were not used for base-flow calibration; therefore, streams were simply modeled as individual linesinks with zero streambed resistance.
Lakes were simulated using linesinks with resistance and streamflow routing in the near field. Drainage lakes (lakes that have a stream outlet) in the near field were linked to the stream network by stream elements based on the methods of Hunt and others (1998). Within the perimeter of each lake, the recharge rate applied to the lake represents net precipitation rather than ground-water recharge; therefore, the water added to the lakes differs from that of the regional aquifer. (Rlake = P-Elake; where Rlake is the net precipitation recharged inside the lake, P is the annual precipitation, and Elake is the evaporation rate from the lake.) The net precipitation recharged inside all near-field lakes in the model was set equal to 2.3 in/yr. This value was determined by Krohelski and others (1999) in simulating a hydrologic budget for nearby Shell Lake in Washburn County, Wis. The value of lake linesink resistance was assigned according to whether the lake was a seepage lake (no surface-water inflows or outflows) or a drainage lake (surface-water inflows and outflows); resistance was set to 50 days for seepage lakes, which matched the calibrated value used by Krohelski and others (1999) for Shell Lake, and 10 days for drainage lakes. A uniform width of 316 ft was assigned to all linesinks that represented lakes; this value was calculated by use of the methods of Hunt and others (2003) and an initial aquifer hydraulic conductivity of 50 ft/d, a resistance assigned to drainage lakes of 10 days, and an estimated saturated thickness of 200 ft based on the average elevation of near-field lakes (1,300 ft) and the base elevation of 1,100 ft.
The regional ground-water-flow model was locally refined to improve simulation of local-scale ground-water flow near the community of New Post. For the New Post simulations, properties of the regional model remained unchanged except in the immediate vicinity of New Post. Modifications to geologic properties in the model included addition of two zones in which the base elevation was increased over the regional base of 1,100 ft (fig. 4). A northern zone included a borehole (BH-2) near the northern end of the community, within 200 ft of the Chippewa Flowage. The base elevation of the northern zone was specified at 1,192 ft, which was the elevation at which crystalline bedrock was contacted at BH-2 (appendix table 2). A southern zone included another borehole (BH-3) that contacted crystalline bedrock at an elevation of 1,230 ft (appendix table 3) in the south-central part of New Post. Hydraulic conductivities for unconsolidated deposits in these two zones, estimated from sieve analyses of core samples (Daniel Tyrolt, Lac Courte Oreilles Conservation Department, written commun., 2006), were similar and therefore assigned the same value in the model. The hydraulic conductivity assigned to the two New Post zones was the calibrated regional value, because few data were available in the area and measured water levels were affected by fluctuations in the stage of the nearby Chippewa Flowage, an important hydraulic boundary. An impermeable boundary was also added to the model to correspond with a crystalline bedrock high, the perimeter of which was assumed to roughly coincide with the 1,340-ft land-surface elevation contour near New Post. The impermeable boundary included the area around another borehole (BH-1) that contacted crystalline bedrock at an elevation of 1,325 ft (appendix table 1), approximately 10 ft above the local water table. The configuration of this impermeable boundary could potentially be refined in the future by means of geophysical measurements such as ground-penetrating radar or seismic surveying.
The Chippewa Flowage shoreline location was also refined for local simulations near New Post by adding detail based on USGS topographic maps. Streambed resistance of the Chippewa Flowage was decreased from 10 days to 1 day because flowages are often expected to be in close hydraulic connection with the ground-water system (Graczyk and others, 2003). The stage of the Chippewa Flowage was also changed from the value of 1,313 ft reported on USGS topographic maps to a value contemporaneous to other measurements. The flowage was set to 1,311.77 ft on the basis of a water-level survey for the flowage and two monitoring wells, conducted by Sawyer County and the LCO Conservation Department on April 13, 2006 (Daniel Tyrolt, written commun., 2006). Data from the dam at the outlet of the flowage near Winter, Wis. shows that the stage of the Chippewa Flowage fluctuates on the order of 5 ft annually and 10 ft over a 10-year record (Robert Olson, written commun., 2006). Consequently, the surveyed monitoring-well water levels were used to evaluate the regional model fit in the New Post area but were not considered sufficiently representative for local re-calibration of the regional model, given the possible artifacts from stage changes in the nearby Chippewa Flowage. The two community water-supply wells were also added to the regional model; pumping rates were assigned by dividing the estimated 9,600 gal/d used by the community (Daniel Tyrolt, written commun., 2006) between the two wells, so that each well withdrew 4,800 gal/d.
The regional model was calibrated to regional ground-water-level and base-flow data near Grindstone Creek (table 1). The regional calibration was also evaluated with respect to local-water level data from the New Post area (table 2) after refinements to the model near New Post were incorporated. The best fit of simulation results to measured values of water-table elevation and streamflows was done by an automated calibration process using UCODE (Poeter and Hill, 1998); the calibration targets and weights are listed in table 1.
Table 1. Measured and simulated values and weighting statistics of ground-water-level and base-flow targets used for the regional model calibration, Sawyer County, Wis.
[Ground-water levels are divided into NWIS (standard deviation equal to 10 feet), monitoring-well nests (product of 2.5 feet standard deviation and the square root of the number of wells in each nest), and a continuously monitored USGS well (standard deviation equal to 0.5 feet)]
(standard deviations) |
||||
454907091230901 |
||||
455041091180302 |
||||
455202091250601 |
||||
455212091250301 |
||||
455220091250301 |
||||
455225091232201 |
||||
455234091241901 |
||||
455241091231201 |
||||
455242091242801 |
||||
455242091250301 |
||||
455247091231201 |
||||
455250091234001 |
||||
455306091142301 |
||||
455317091142101 |
||||
455321091160301 |
||||
455324091130401 |
||||
455327091130001 |
||||
455330091125501 |
||||
455331091175101 |
||||
(standard deviations) |
||||
455342091110001 |
||||
455351091104601 |
||||
455400091270801 |
||||
455541091224401 |
||||
455635091213401 |
||||
455712091171401 |
||||
455717091083701 |
||||
455725091205301 |
||||
455801091074001 |
||||
455818091212601 |
||||
455819091200001 |
||||
455839091145001 |
||||
455900091112201 |
||||
455918091192901 |
||||
460005091291801 |
||||
460039091285002 |
||||
460110091293801 |
||||
(standard deviations) |
||||
| Namekagon River at Leonards (gaging station) | ||||
| Grindstone Creek at Hwy E (gaging station) | ||||
| Grindstone Creek at Grindstone Springs Road | ||||
| Spring Lake outlet | ||||
| Osprey Creek | ||||
| Hatchery Creek | ||||
| Hay Creek | ||||
| Godfry Creek | ||||
| Bean Brook | ||||
| Big Brook | ||||
| Namekagon 1 | ||||
| Namekagon 2 | ||||
| Namekagon 3 | ||||
| Namekagon 4 | ||||
| Namekagon 5 | ||||
| Namekagon 6 | ||||
| Namekagon 7 | ||||
| Namekagon 8 | ||||
Table 2. Measured and simulated water levels in two wells used to evaluate the regional model calibration for local simulations of the New Post area, Sawyer County, Wis.
[Data are ground-water levels, in feet above NAVD 88]
| New Post – M3 | 1,311.87 | 1,311.88 | -0.01 |
| New Post – M6 | 1,311.71 | 1,311.85 | -.14 |
Ground-water targets for the regional model consisted of both historical and contemporaneous measurements (table 1). Historical ground-water levels for 46 wells were obtained from the NWIS database (Demptser, 1990). Ground-water levels for an additional 13 monitoring wells were obtained from the LCO Conservation Department (Tyrolt, 2002), and levels for two vertically nested observation wells on the golf course near Grindstone Creek were obtained from the Wisconsin Department of Natural Resources (John Prohaska, Wisconsin Department of Natural Resources, written commun., 2003). Because the model consisted of one layer, a transmissivity-weighted average water level (1,329.2 ft) was used to approximate the measured water level in the two vertically nested monitoring wells (QY324 and RA701) on the golf course. The average of four measured water levels (1,312.5 ft) in the sandstone well (QY324) was weighted by an estimated transmissivity of 1,000 ft2/d (100 ft thickness and hydraulic conductivity of 10 ft/d); the average of four measured water levels (1,330.9 ft) in the well open to glacial sediments (RA701) was weighted by an estimated transmissivity of 10,000 ft2/d (200 ft thickness and hydraulic conductivity of 50 ft/d). In addition, the calibration included the median ground-water level in a USGS observation well (site ID 455841091235301) located about 15 ft from the Upper Grindstone Spring pond, which was monitored continuously from October 1, 2002, to September 30, 2003 (appendix fig. 2).
For evaluation of the regional calibration using the local New Post simulations, ground-water levels from two monitoring wells (NP-M3 and NP-M6, fig. 4) in the community of New Post measured during the April 13, 2006, survey were used. These measured values were contemporaneous with and shared the same datum with a measurement of stage on the Chippewa Flowage. However, the local model was not recalibrated during the local New Post simulations because the flowage elevation was climbing and this hydraulic boundary could not be considered to be at steady state during this time. This boundary condition is important because changes in the stage of the Chippewa Flowage are expected to have a large influence on local New Post ground-water elevations.
Historical streamflows, as well as streamflows measured during the study of Grindstone Creek, were also used to calibrate the regional model. Historical streamflow targets (fig. 3A) included (1) a historical gaging station on the Namekagon River at Leonards, (2) eight additional locations along the Namekagon River with intermittent data, and (3) intermittent streamflow measurements on five streams (Bean Brook, Big Brook, Godfry Creek, Hatchery Creek, and Hay Creek). Streamflows were measured continuously during the Grindstone Creek study at a gaging station on Grindstone Creek at County Highway E (Hwy E) and intermittently on Grindstone Creek at Grindstone Springs Road, the outlet of Spring Lake, and on Osprey Creek at Hwy E. These streamflows were used to evaluate simulated base flows and constrain associated regional recharge. Streamflow in Grindstone Creek at Hwy E is shown graphically in appendix figure 1; daily values are published in Waschbusch and others (2004).
Base flows (flows at which ground-water discharge is the sole component of streamflow) used as target values for the two gaging stations (sites where discharge is monitored continuously) were estimated by use of the base-flow separation program, BFI (Wahl and Wahl, 1995). The BFI program is based on a method that combines a local minimum analysis and a recession-slope test (Institute of Hydrology, 1980a; 1980b; Wahl and Wahl, 1995) to separate base flow and runoff components of a hydrograph. Using the period of record for the two stations, base-flow targets were estimated to be 97.0 ft3/s for the Namekagon River at Leonards (1999−2000) and 8.7 ft3/s for Grindstone Creek at Hwy E (2002−03).
The GFLOW model was coupled to UCODE (Poeter and Hill, 1998) to calculate parameter values that result in the best match between simulated and observed ground-water levels and base flows. To assess the quality of the calibration, the modeler must assign weights to the observations that reflect their relative importance to the overall fit between simulated and measured values. UCODE calculates weights (inverse of the variance, or 1 divided by the square of the standard deviation) for each target through a user-supplied weighting statistic. Thus, calibration targets with more uncertainty (larger values of standard deviation or variance) reflect less relative importance to the calculation of overall fit. Weighting statistics for ground-water levels are expressed as a standard deviation; weighting statistics for streamflows are expressed as a coefficient of variation (defined as the standard deviation divided by the target value). The weighting statistic assigned to each calibration target, along with residuals derived from the optimized model solution, are listed in table 1.
Weighting statistics assigned to ground-water levels were grouped as follows: (1) NWIS wells, standard deviation equal to 10 ft; (2) nests of monitoring wells, standard deviation equal to 2.5 ft; and (3) the continuously monitored USGS well near the Upper Grindstone Spring pond, standard deviation equal to 0.5 ft, or roughly half the range in annual water-level fluctuation in the well. The assigned standard deviation reflects uncertainty associated with well locations and concerns with how well the measurements reflect average conditions (date and number of measurements). The standard deviation for each well that was part of a closely grouped nest of wells (those identified as M1 through M6 after their names in table 1) was apportioned according to the number of wells included in the well group, as described by the following equation:
![]()
where
δwell-n is the standard deviation calculated for the nth well in a group
of wells,
δnest is the assigned standard deviation for the entire well group (2.5
ft for this model), and
n is the number of wells in the nest.
Thus, the weight for each nest of wells was equal to the sum of weights for each individually located monitoring well used to calibrate the model. This weighting scheme reduced excessive influence on regional model calibration parameters caused by including several similar head measurements in a small area.
Weighting statistics for streamflows were assigned differently for gaging stations and intermittent measurements. The gaging station on the Namekagon River at Leonards (USGS station ID 05331833) had 6 years of continuous measurements; therefore, long-term steady-state conditions were known with considerable certainty (coefficient of variation equal to 0.01, or ±2 percent around the measured value). A coefficient of variation equal to 0.05 (±10 percent around the measured value) was assigned to the gaging station on Grindstone Creek at Hwy E (USGS station ID 05356078), which had 1 year of continuous measurements. The uncertainties related to intermittent streamflow measurements were assigned by stream order, because streams of relatively high order drain a larger part of the ground-water system than streams of low order. Consequently, low-order streams can be influenced by local geologic and hydrologic properties not incorporated into the conceptual model, whereas high-order streams are better represented by the regional characterization of the ground-water system as depicted by the model. Coefficients of variation were set equal to 0.50 for first-order streams, 0.10 for second-order streams, and 0.05 for third-order streams. A similar approach was applied by Feinstein and others (2006).
Hydraulic conductivities in two zones in the near field were varied during calibration of the regional model (fig. 3A). The location and configuration of the zones were based on (1) a relatively low permeability of glacial thrust-mass sediments associated with the Tiger Cat advance, as mapped by Clayton (1984) and (2) a mixture of proglacial stream sediment and sandy glacial till, which covers most of the modeled area. Calibrated hydraulic conductivities were 7.9 and 58.2 ft/d for zones 1 and 2, respectively (table 3). A uniform recharge rate of 10.1 in/yr was optimized for the entire model domain (table 3). Simulated results were relatively more sensitive to parameters with high composite scaled sensitivity (CSS) values (for example, recharge), which were computed by UCODE during the calibration process (table 3), than to parameters with low CSS values (glacial thrust-mass sediments). For the local New Post simulations, calibrated hydraulic conductivities and recharge values were left unchanged.
Table 3. Calibrated parameter values for the analytic element model and UCODE-calculated composite scaled sensitivities (CSS) of the parameters.
[in/yr, inch per year; ft/d, foot per day]
name |
parameter value |
||
| R-global | Uniform recharge to entire model domain | ||
| K-TM | Hydraulic conductivity of the glacial thrust-mass sediments | ||
| K-global | Hydraulic conductivity of the model domain outside of the glacial thrust-mass zone (lumped equivalent of sandy glacial till, proglacial stream sediment, and sandstone). |
The resulting model fit was close. Unweighted statistics comparing measured ground-water levels to calibrated modeled values included a mean error of ±2.7 ft, a mean absolute error of 6.3 ft, and a root mean square error of 7.6 ft. Figure 5 shows that simulated water levels generally matched measured water levels over the entire 216-ft range in measured water levels. The simulated streamflow at the gaging station on the Namekagon River at Leonards (USGS station ID 05331833) was 96.6 ft3/s (0.01 percent less than the estimated 97.0 ft3/s annual base flow). Simulated streamflow in Grindstone Creek at Hwy E (USGS station ID 05356078) was 8.3 cfs (4.1 percent less than the estimated 8.7 ft3/s annual base flow). Measured and simulated values for all ground-water levels and streamflows used to calibrate the regional model are compared in table 1 and those used to evaluate the regional model values for the local New Post simulations are compared in table 2.
Figure 5. Model-simulated and observed water-level altitudes and associated calibration statistics for the regional model.
The calibrated model was used to assess the influence of ground-water withdrawal for irrigation on base flow in Grindstone Creek. Ground-water withdrawal was simulated under steady-state conditions (continuous pumping at a uniform rate) for two pumping scenarios. The first scenario simulated a constant withdrawal rate of 46 gal/min, which was calculated by distributing the estimated annual pumping (24 Mgal) (Keith Norlin, Three Bears Environmental Services, written commun., 2002) equally over the year. Recognizing that the annual pumping will likely be concentrated over a shorter time period, a second scenario simulated withdrawal at 347 gal/min, which corresponds to the expected maximum pumpage (500,000 gal/d for 48 days) during peak demand periods in midsummer (Keith Norlin, written commun., 2002). In the model, ground-water withdrawal for irrigation was assumed to be completely evapotranspired (that is, irrigation water was assumed to be 100 percent consumed). The model was not used to simulate transient pumping conditions, which may reduce the effect of pumping on streamflow compared to effects calculated with a steady-state model (depending upon the actual rate and duration of pumping and the amount of water released from storage). Therefore, results of the steady-state model probably represent a worst case with regard to effects of pumping on ground-water levels and discharge to Grindstone Creek.
Ground-water withdrawal from three nested pumping wells open to both the glacial sediment and sandstone aquifers was simulated with a single pumping well at the location indicated in the high-capacity well application (roughly lat 45˚59'09"N., long 91˚23'07"W.; Keith Norlin, written commun., 2002). In the model, a steady-state ground-water withdrawal rate of 46 gal/min (0.10 ft3/s) reduced base flow in Grindstone Creek at Hwy E by 0.05 ft3/s, a 0.6-percent reduction from the simulated base flow in the calibrated model. The reduction in base flow represents 50 percent of the irrigation water pumped. Simulated base flow and water-level reductions at five stream locations and two wells in the near field are summarized for scenario 1 in table 4. The effect of ground-water withdrawal is largest near the pumping center and where streamflows are small (a 1.6-percent reduction in base flow at the Upper Grindstone Spring pond) and decreases as streamflow and the distance from the pumping wells increase (0.6 percent at the gaging station on Hwy E).
Table 4. Simulated results for base flows and water levels in the Grindstone Creek area, Wis., for scenario 1 with average annual withdrawal (46 gallons per minute) from upgradient irrigation wells.
[--, not applicable]
without pumping |
due to pumping |
Decrease |
|
| RA701 | |||
| USGS well (455841091235301) | |||
| Grindstone Creek at Hwy E (gaging station) | |||
| Grindstone Creek at Grindstone road | |||
| Upper Grindstone Spring1 | |||
| Spring Lake outlet | |||
| Namekagon at Leonards (gaging station) | |||
1 Discharge at Upper Grindstone Spring was
not measured and therefore not used as a calibration target, but was included
as an observation for scenario testing.
Simulating ground-water withdrawal at a rate of 347 gal/min (0.77 ft3/s) during steady-state periods of seasonal peak demand reduced base flow in Grindstone Creek at Hwy E by 0.4 ft3/s (a 4.9-percent streamflow reduction, 53 percent of irrigation water pumped) from the simulated base flow in the calibrated model (table 5). Simulated base flow and water-level reductions at five stream locations and two wells in the near field are summarized for scenario 2 in table 5. Again, the effect of ground-water withdrawal is largest near the pumping center and where streamflows are small (a 12.5-percent reduction in base flow at the Upper Grindstone Spring pond) and decreases as streamflow and the distance from the pumping wells increase (4.9 percent at the gaging station on Hwy E). As would be expected, simulated reductions in base flow and water levels are greater for scenario 2, in which the pumping rate was higher than for scenario 1.
Table 5. Simulated results for base flows and water levels in the Grindstone Creek area, Wis., for scenario 2 with maximum seasonal withdrawal (347 gallons per minute) from upgradient irrigation wells.
[--, not applicable]
| RA701 | |||
| USGS well (455841091235301) | |||
| Grindstone Creek at Hwy E (gaging station) | |||
| Grindstone Creek at Grindstone road | |||
| Upper Grindstone Spring1 | |||
| Spring Lake outlet | |||
| Namekagon at Leonards (gaging station) | |||
1 Discharge at Upper Grindstone Spring was not measured and therefore not used as a calibration target, but was included as an observation for scenario testing.
The range of measured streamflow in Grindstone Creek at Hwy E in the absence of pumping was greater than 13 ft3/s during water year 2003; base flow varied by 5.3 ft3/s. Therefore, reductions in streamflow (0.05 to 0.4 ft3/s) due to pumping would be difficult to distinguish from short-term natural streamflow variations without the aid of a model. Whereas it might be concluded that the simulated reductions in base flow are within the natural fluctuation of base flow, the hydrologic stresses simulated here differ from normal climatic variation because pumping stresses are a systematic reduction of water available to the hydrologic system. Whereas normal climatic variability includes both wet and dry years, the pumping stresses simulated here always reflect a condition of less water entering the creek. Therefore, although the normal climatic variation would still occur and streamflows would continue to fluctuate, the normal fluctuations would be overlain on a new, lower, base flow. Therefore, both wetter and drier years would have lower streamflows than if the pumping stress was not present.
The areal extent of zones of contribution to the two existing community wells and to two possible replacement wells located at BH-2 and BH-3 were assessed by use of the locally refined model simulations of the New Post area (figs. 6, 7, and 8). The contributing area of a well is the land area with the same horizontal extent as that part of the aquifer from which ground-water flow is captured by the well. The contributing areas of the wells were delineated by backward particle tracking from the well to the area of recharge. Mathematical particles of water were placed within the well at the bottom of the aquifer and traced backwards to the water table. Using a porosity of 0.25, which is typical of sand (Freeze and Cherry, 1979), estimates of the time required for a particle of water in the contributing area to reach the well also were calculated.
Figure 6. Simulated zone of contribution to the two wells that supply drinking water to the community of New Post, Sawyer County, Wis. (gal/d, gallon per day; ft, foot).
Figure 7. Simulated zone of contribution to a possible replacement well pumping at 9,600 gallons per day at the location of BH-2 (gal/d, gallon per day; ft, foot).
Figure 8. Simulated zone of contribution to a possible replacement well pumping at 9,600 gallons per day at the location of BH-3 (gal/d, gallon per day; ft, foot).
The simulated zones of contribution for the two existing wells (fig. 6), each pumping at 4,800 gal/d, covered much of the same area delineated by Tyrolt (2002) on the basis of measured water-level gradients in the New Post monitoring wells during 2001. Steady-state ground-water flow directions are generally from recharge areas along the perimeter of the crystalline mound toward the Chippewa Flowage and the pumping wells. Possible replacement wells pumping individually at 9,600 gal/d were simulated at BH-2 and BH-3 to evaluate potential zones of contribution to such wells (figs. 7 and 8). Ground water discharging to the potential replacement wells at BH-2 and BH-3 also flows from recharge areas near the crystalline mound toward the Chippewa Flowage and the wells.
On the basis of the simulation results, the potential to capture surface water from the flowage was greatest when a well at BH-2 was simulated with a pumping rate of 9,600 gal/d. This potential replacement well is located near the flowage. The zone of contribution for the well pumping at 9,600 gal/d intersects the shoreline of the Chippewa Flowage, inducing 70 gal/d (1 percent of well discharge) of surface-water leakage into the aquifer. Transient fluctuations in the lake stage of the Chippewa Flowage also likely induce a small amount of surface water to enter the aquifer during periods of rising lake stage, which typically occurs during spring and late fall. Short-term heavy pumping could also induce surface water from the Chippewa Flowage to enter the ground-water-flow system. Although no water-quality evaluation was done for the area near New Post, the short travel distance for surface-water leakage captured by a well would be expected to limit natural filtration by the aquifer material.
Grindstone Creek is a ground-water-fed stream near the site of potential high-capacity water withdrawals in Sawyer County, Wis. Because the creek is in close hydraulic connection with the ground-water system, hydrologic stresses in the ground-water system may affect base flow in the creek. The community of New Post obtains its drinking water from two wells that pump from a glacial-sediment aquifer located between a crystalline bedrock mound and the Chippewa Flowage. Identifying the zone of contribution to the existing wells and possible future wells is important for managing the quality of the drinking-water supply.
A two-dimensional, steady-state, analytic element ground-water-flow model of the hydrologic system was developed and calibrated by use of the computer code GFLOW. The model was used to estimate the hydrologic budget of Grindstone Creek and the hydraulic parameters of the ground-water-flow system. A regional model was calibrated to ground-water levels measured in 61 wells and to base flow at 18 locations along rivers and streams, including a gaging station on Grindstone Creek at Hwy E that was established for this study. The regional model was locally refined in the area near New Post by adjusting aquifer base elevation and refining the shoreline of a nearby surface-water boundary condition. The regional model calibration was evaluated for the local New Post area using data from two water-level sites near the New Post water-supply wells.
The calibrated regional model was used to assess hydrologic effects from an average annual withdrawal and an estimated maximum seasonal withdrawal for irrigation of a golf course near Grindstone Creek. The simulation results indicate that base flow in Grindstone Creek at Hwy E would be reduced by 0.05 ft3/s for average annual conditions to 0.4 ft3/s for the maximum pumping period expected annually in midsummer. Whereas these simulated effects may be difficult to ascertain by field measurements of streamflow, they represent a systematic reduction of ground-water discharge to the creek. Therefore, annual ground-water withdrawal for irrigation is expected to establish a new, lower, baseline base flow in the creek over which the natural variation due to climatic effects is added and subtracted.
Simulated zones of contribution for the New Post community water-supply wells encompassed an area primarily to the south of current and possible replacement wells. The zone of contribution extended to the crystalline bedrock mound, which was represented in the model as an impermeable boundary to ground-water flow. The rate of pumping and proximity of the possible replacement wells to the Chippewa Flowage shoreline are important considerations that could affect the potential to induce surface-water leakage into the aquifer. Transient fluctuations in the lake stage of the Chippewa Flowage, or short-term heavy pumping rates, could induce surface water in the Chippewa Flowage to enter the ground-water-flow system. Although no water-quality samples were analyzed for either the surface-water or ground-water systems near New Post, surface-water leakage into the aquifer would likely travel a short distance to a well, which could limit natural filtration by the aquifer material.
Daniel Tyrolt and Brett McConnel (LCO Conservation Department) are thanked for aquifer-coring assistance, sieve analyses on collected samples, and field reconnaissance near Grindstone Creek and New Post. John Prohaska (Wisconsin Department of Natural Resources) is thanked for providing specifications for the irrigation wells near Grindstone Creek. James Rauman (USGS, Wis.) operated the equipment that was used to collect core samples and contact crystalline bedrock at sites BH-1, BH-2 and BH-3 near New Post; his help is appreciated. Robert Olson (Xcel Energy) graciously provided water-level data for the Chippewa Flowage at the dam near Winter, Wis. David Johnson (Wisconsin Department of Natural Resources) and Charles Dunning (USGS, Wis.) are thanked for providing valuable technical review comments that have improved this report.
Clayton, L., 1984, Pleistocene geology of the Superior Region, Wisconsin: Wisconsin Geological and Natural History Survey Information Circular 46, 40 p., 1 pl.
Dempster, G.R., Jr., 1990, National Water Information System user’s manual—Volume 2, Chapter 3, Automated Data Processing System: U.S. Geological Survey Open-File Report 90–116 [variously paged].
Feinstein, D.T., Buchwald, C.A., Dunning, C.P., and Hunt, R.J., 2006, Development and application of a screening model for simulating regional ground-water flow in the St. Croix River Basin, Minnesota and Wisconsin: U.S. Geological Survey Scientific Investigations Report 2005–5283, 41 p.
Freeze, R.A., and Cherry, J.A., 1979, Groundwater: Englewoood Cliffs, N.J., Prentice-Hall, 604 p.
Graczyk, D.J., Hunt, R.J., Greb, S.R., Buchwald, C.A., and Krohelski, J.T., 2003, Hydrology, nutrient concentrations, and nutrient yields in nearshore areas of four lakes in northern Wisconsin, 1999–2001: U.S. Geological Survey Water-Resources Investigations Report 03–4144, 64 p.
Haitjema, H.M., 1995, Analytic element modeling of groundwater flow: San Diego, Calif., Academic Press, 394 p.
Hill, M.C., 1998, Methods and guidelines for effective model calibration; with application to UCODE, a computer code for universal inverse modeling, and MODFLOWP, a computer code for inverse modeling with MODFLOW: U.S. Geological Survey Water-Resources Investigations Report 98–4005, 90 p.
Hunt, R.J., 2006, Ground water modeling applications using the analytic element method: Ground Water, v. 44, no. 1, p.5–14.
Hunt, R.J., Anderson, M.P., and Kelson, V.A., 1998, Improving a complex finite-difference ground water flow model through the use of an analytic element screening model: Ground Water, v. 36, no. 6, p. 1011–1017.
Hunt, R.J., Haitjema, H.M., Krohelski, J.T., and Feinstein, D.T., 2003, Simulating ground water-lake interactions—Approaches and insights: Ground Water, v. 41, no. 2, p. 227–237.
Hunt, R.J., and Krohelski, J.T., 1996, The application of an analytic element model to investigate groundwater-lake interactions at Pretty Lake, Wisconsin: Journal of Lake and Reservoir Management, v. 12, no. 4, p. 487–495.
Hunt, R.J., Lin, Y., Krohelski, J.T., and Juckem, P.F., 2000, Simulation of the shallow hydrologic system in the vicinity of Middle Genesee Lake, Wisconsin, using analytic elements and parameter estimation: U.S. Geological Survey Water-Resources Investigations Report 00–4136, 16 p.
Institute of Hydrology, 1980a, Low flow studies—Report No. 1, Research report: Wallingford, Oxon, U.K., 21 p.
Institute of Hydrology, 1980b, Low flow studies—Report No. 3, Catchment characteristic estimation manual: Wallingford, Oxon, U.K., p. 12–19.
Juckem, P.F., Hunt, R.J., and Tyrolt, D.D., 2003, Using characteristic leakage length as a guide to model design—Application to the Grindstone Springs Area, Lac Courte Oreilles, Wisconsin, in American Water Resources Association, Wisconsin state section, proceedings: p. 51.
Krohelski, J.T., Feinstein, D.T., and Lenz, B.N., 1999, Simulation of stage and hydrologic budget for Shell Lake, Washburn County, Wisconsin: U.S. Geological Survey Water-Resources Investigations Report 99–4209, 23 p.
Mitchell-Bruker, S., and Haitjema, H.M., 1996, Modeling steady state conjunctive groundwater and surface water flow with analytic elements: Water Resources Research, v. 32, no. 9, p. 2725–2732.
Mudrey, M.G., Brown, B.A., and Greenberg, J.K., 1982, Bedrock geologic map of Wisconsin: Wisconsin Geological and Natural History Survey, State Map 18.
Pint, C.P., 2002, A groundwater flow model of the Trout Lake Basin—Calibration and lake capture zone analysis: University of Wisconsin—Madison, unpublished M.S. thesis, 123 p.
Poeter, E.P., and Hill, M.C., 1997, Inverse models: a necessary next step in ground-water modeling: Ground Water, v. 35, no. 2, p. 250–260.
Poeter, E.P., and Hill, M.C., 1998, Documentation of UCODE, a computer code for universal inverse modeling: U.S. Geological Survey Water-Resources Investigation Report 98–4080, 116 p.
Tyrolt, D.D., 2006, New Post soil boring sieve analysis report: unpublished document on file at the Lac Courte Oreilles Conservation Department, 21 p.
Tyrolt, D.D., 2002, Wellhead/Source Water Protection Plan—Lac Courte Oreilles Band of Lake Superior Chippewa Indians: Lac Courte Oreilles Conservation Department, 52 p. plus appendixes.
Tyrolt, D.D. [n.d.], Grindstone Lake water quality study: Lac Courte Oreilles Conservation Department, 73 p. plus appendixes.
Wahl, K.L., and Wahl, T.L., 1995, Determining the flow of Comal Springs at New Braunfels, Texas, in Texas Water ’95, San Antonio, Tex., August 16–17, 1995, Proceedings: American Society of Civil Engineers, p. 77–86.
Waschbusch, R.J., Olson, D.L., Ellefson, B.R., and Stark, P.A., 2004, Water resources data, Wisconsin, water year 2003: U.S. Geological Survey Water-Data Report WI–03–01, 607 p.
Water Resources Management Program, 1991, Water resources of the Lac Courte Oreilles Reservation, northwest Wisconsin: University of Wisconsin—Madison, 201 p.
Appendix figure 1. Hydrograph
showing daily mean streamflow of Grindstone Creek at Highway E, near Reserve,
Wis.
Appendix figure 2. Graph
showing ground-water level in U.S.G.S. well 455841091235301 and stage of the
Upper Grindstone Spring pond, Wis.
Appendix table 1. Lithologic
description of geologic cores from borehole BH-1 near New Post, Sawyer County,
Wis.
Appendix table 2. Lithologic
description of geologic cores from borehole BH-2 near New Post, Sawyer County,
Wis.
Appendix table 3. Lithologic
description of geologic cores from borehole BH-3 near New Post, Sawyer County,
Wis.
Appendix figure 1. Hydrograph of daily mean streamflow of Grindstone Creek at Highway E, near Reserve, Wis. (U.S. Geological Survey station ID 05356078).
Appendix figure 2. Ground-water level in U.S. Geological Survey well 455841091235301 and stage of the Upper Grindstone Spring pond, Wis. (U.S. Geological Survey site ID 455841091235300).
The two-letter classification codes in the following three appendix tables are based on the Unified Soil Classification System, which is widely used to describe particle size and sorting of unconsolidated materials.
| Poorly graded (well sorted) | |||
| Well graded (poorly sorted) | |||
| Silty |
[--, not applicable; modified from Daniel Tyrolt, Lac Courte Oreillies Conservation Department, written commun., 2006]
| (No sample collected) | ||
| Poorly graded gravel with appreciable fines | ||
| Crystalline bedrock |
Appendix table 2. Lithologic description of geologic cores from borehole BH-2 near New Post, Sawyer County, Wis.
[--, not applicable; modified from Daniel Tyrolt, Lac Courte Oreillies Conservation Department, written commun., 2006]
| Well-graded fine sand; 6 percent clay | ||
| Silty, fine sand; 12.5 percent clay | ||
| Coarse sand to fine gravel | ||
| Poorly graded coarse sand to coarse gravel | ||
| Poorly graded medium sand to fine gravel | ||
| Fine gravel | ||
| Poorly graded medium sand to fine gravel; weathered bedrock present | ||
| Crystalline bedrock |
Appendix table 3. Lithologic description of geologic cores from borehole BH-3 near New Post, Sawyer County, Wis.
[--, not applicable; modified from Daniel Tyrolt, Lac Courte Oreillies Conservation Department, written commun., 2006]
| Poorly graded silty to coarse sand | ||
| Poorly graded fine sand to fine gravel | ||
| Crystalline bedrock |

![]() U.S. Department of the Interior |
U.S. Geological Survey
U.S. Department of the Interior |
U.S. Geological Survey
Persistent URL: https://pubs.water.usgs.gov/sir20075014
Page Contact Information: USGS Publishing Network
Page Last Modified: Thursday, 01-Dec-2016 19:44:22 EST


.")


.")