Scientific Investigations Report 2007-5081
Prepared in cooperation with
St. Johns River Water Management District
 |
Select an option: |
|
CONTENTS Abstract Introduction Purpose and Scope Description of Project Sites Methods of Analyses Description of Study Area Climate Hydrogeology and Physiography Water Use Acknowledgments Analyses of Water-Level Differentials Descriptive Statistics Trends Influence of Selected Parameters Land-Surface Altitude Intermediate Confining Unit Properties Precipitation Interrelations among Differentials, Precipitation, and Pumpage Trends Influence of System Memory Descriptive Algorithms Estimating the Time Dependency of Confining Unit Storage Application of an Analytical Solution Limitations of Results and Suggestions for Future Studies Summary and Conclusions References Appendix A. Mean, residual, and percent change in water-level differentials at the project sites, 2000-2004 Appendix B. Amounts of water treated at municipal water treatment plants near the Charlotte Street monitoring-well cluster site, 2000-2004 |
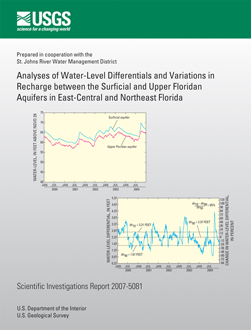
Continuous (daily) water-level data collected at 29 monitoring-well cluster sites were analyzed to document variations in recharge between the surficial (SAS) and Floridan (FAS) aquifer systems in east-central and northeast Florida. According to Darcys law, changes in the water-level differentials (differentials) between these systems are proportional to changes in the vertical flux of water between them. Variations in FAS recharge rates are of interest to water-resource managers because changes in these rates affect sensitive water resources subject to minimum flow and water-level restrictions, such as the amount of water discharged from springs and changes in lake and wetland water levels.
Mean daily differentials between 2000-2004 ranged from less than 1 foot at a site in east-central Florida to more than 114 feet at a site in northeast Florida. Sites with greater mean differentials exhibited lower percentage-based ranges in fluctuations than did sites with lower mean differentials. When averaged for all sites, differentials (and thus Upper Floridan aquifer (UFA) recharge rates) decreased by about 18 percent per site between 2000-2004. This pattern can be associated with reductions in ground-water withdrawals from the UFA that occurred after 2000 as the peninsula emerged from a 3-year drought. Monthly differentials exhibited a well-defined seasonal pattern in which UFA recharge rates were greatest during the dry spring months (8 percent above the 5-year daily mean in May) and least during the wetter summer/early fall months (4 percent below the 5-year daily mean in October). In contrast, differentials exceeded the 5-year daily mean in all but 2 months of 2000, indicative of relatively high ground-water withdrawals throughout the year. On average, the UFA received about 6 percent more recharge at the project sites in 2000 than between 2000-2004.
No statistically significant correlations were detected between monthly differentials and precipitation at 27 of the 29 sites between 2000-2004. For longer periods of record, double-mass plots of differentials and precipitation indicate the UFA recharge rate increased by about 34 percent at a site in west Orange County between the periods of 1974-1983 and 1983-2004. Given the absence of a trend in rainfall, the increase can likely be attributed to ground-water development. At a site in south Lake County, double-mass plots indicate that dredging of the Palatlakaha River and other nearby drainage improvements may have reduced recharge rates to the UFA by about 30 percent from the period between 1960-1965 to 1965-1970.
Water-level differentials were positively correlated with land-surface altitude. The correlation was particularly strong for the 11 sites located in physiographically-defined ridge areas (coefficient of determination (R2) = 0.89). Weaker yet statistically significant negative correlations were detected between differentials and the model-calibrated leakance and thickness of the intermediate confining unit (ICU).
Recharge to the UFA decreased by about 14 percent at the Charlotte Street monitoring-well site in Seminole County between 2000-2004. The decrease can be attributed to a reduction in nearby pumpage, from 57 to 49 million gallons per day over the 5-year period, with a subsequent recovery in UFA water levels that exceeded those in the SAS.
Differentials at Charlotte were influenced by system memory of both precipitation and pumpage. While not statistically correlated with monthly precipitation, monthly differentials were well correlated with the 9-month moving average of precipitation. Similarly, differentials were best correlated with the 2-month moving average of pumpage. The polynomial function that quantifies the correlation between differentials and the 2-month moving average of pumpage indicates that, in terms of UFA recharge rates, the system was closer to a steady-state condition in 2000 when pumpage rates were high, than from 2001-2004 when pumpage rates were lower. Although not statistically correlated on a monthly basis, the 9-month moving average of precipitation was well correlated with the 2-month moving average of pumpage. This memory-influenced relation was best quantified by a power function where changes in low levels of precipitation resulted in relatively large changes in pumpage, and vice versa.
An algorithm was developed that correlates monthly differentials with precipitation and pumpage and accounts for system memory and the distances between the Charlotte Street site and points of ground-water withdrawals. The correlation is well defined (R2 = 0.84) and, assuming no addition of water-supply sites or closure of existing sites, offers potential as a predictive tool for estimating water-level differentials and variations in UFA recharge rates based on changes in precipitation and pumpage.
A widely-applied analytical solution was used to estimate the time required for ICU storage effects to become negligible for an aquifer subject to an instantaneous change in head. Times varied by about three orders of magnitude across the 29 project sites, from about 1 day at sites in southwest Orange and south Lake Counties, to 1,595 days at the site in Baker County. Times were greater than 7 days at 18 sites but less than 1 month at 19 sites. Based solely on variations in regionally-mapped ICU thickness, timeframes ranged from less than 1 month in parts of Alachua, Brevard, Volusia, Lake, Marion, and Orange Counties, to more than 2 years in Nassau County and parts of Duval, Baker, and St. Lucie Counties. Uncertainty in parameter values and the constant-head boundary condition imposed in the unstressed aquifer limit the applicability of these results. Nonetheless, it does not appear that daily or weekly (or even monthly in some cases) stress periods would provide adequate timeframes in transient ground-water flow models to dissipate ICU storage effects across parts of east-central and northeast Florida. Accordingly, changes in differentials between the SAS and UFA should probably not be equated with proportionate changes in recharge for timescales of less than 1 month.
Murray, L.C., Jr., 2007, Analyses of Water-Level Differentials and Variations in Recharge between the Surficial and Upper Floridan Aquifers in East-Central and Northeast Florida: U.S. Geological Survey Investigations Report 2007-5081, 58 p.
U.S. Geological Survey
Florida Integrated Science Center
12703 Research Parkway
Orlando, FL 32826
407-803-5531
| Accessibility FOIA Privacy Policies and Notices | U.S. Department of the Interior, U.S. Geological Survey
Persistent URL: https://pubs.usgs.gov/sir/2007/5081 Page Contact Information: USGS Publishing Network Page Last Modified: Thursday, 01-Dec-2016 19:50:34 EST |
 |