Scientific Investigations Report 2007–5157
Methods for and estimates of 2003 and projected water use in the Seacoast Region, Southeastern New Hampshire
By Marilee A. Horn, Richard B. Moore, Laura Hayes, and Sarah M. Flanagan
|
|
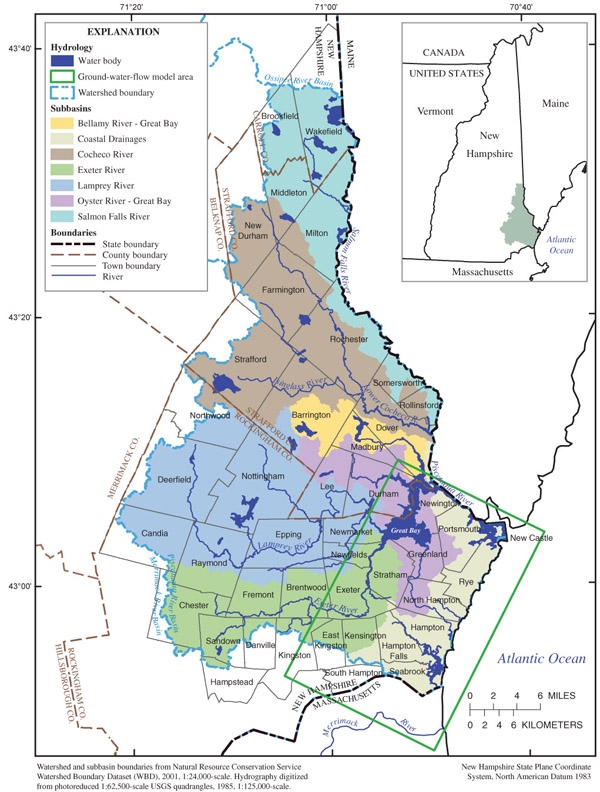
The Seacoast region encompasses approximately 830 mi2 in southeastern New Hampshire and contains all or parts of 44 towns—2 in Carroll County, 29 in Rockingham County, and 13 in Strafford County—and includes surface drainages to the Piscataqua River, Great Bay, and the Atlantic Ocean (Index map of the towns and subbasins in the Seacoast region, New Hampshire). Its proximity to metropolitan Boston has led to a 37-percent population increase from 1980 to 2000. This population increase, and associated urban development, has been accompanied by an estimated 50-percent increase in the use of ground- and surface-water resources for domestic, industrial, commercial, irrigation, and other purposes. Continued population and urban growth in the future will result in greater dependence on the available ground- and surface-water resources of the region. Determining the sustainability of and effectively managing these water resources requires a thorough understanding of the available resources, how much water is currently used, and how much water is projected to be needed in the future. To address these concerns, the U.S. Geological Survey (USGS), in cooperation with the New Hampshire Department of Environmental Services (including the New Hampshire Coastal Program and the New Hampshire Geological Survey (NHGS)) and 44 towns in the Seacoast region, conducted a study to assess the availability of water from ground- and surface-water resources and current and future water demand and withdrawal for the Seacoast region. Water-use activities include water withdrawal, delivery, demand, consumptive use, release, return flow, and transfer by registered and aggregated unregistered (less than 20,000 gallons per day) users at the census-block scale summarized by town. This CD includes Appendixes 2 and 3 developed during the course of this study. Appendix 2 contains a town summary of water-use activities in the form of maps, tables, and flow charts. Appendix 3 contains a subbasin summary of water-use activities in the form of flow charts. Detailed explanations of these documents are provided in the menu on the left. The entire report can be accessed online through the following link: https://pubs.usgs.gov/sir/2007/5157 |

![]() U.S. Department of the Interior |
U.S. Geological Survey
U.S. Department of the Interior |
U.S. Geological Survey
URL: https://pubs.usgs.gov/sir/2007/5157/intro.htm
Page Contact Information: Laura Hayes, Marilee Horn
Page Last Modified: 25-March-08, 16:00:00 EDT
