Geographic Analysis and Monitoring Program
Prepared in cooperation with the Civil Defense Division of the State of Hawai‘i Department of Defense, the Office of Planning of the State of Hawai‘i Department of Business, Economic Development, and Tourism, and the Pacific Disaster Center
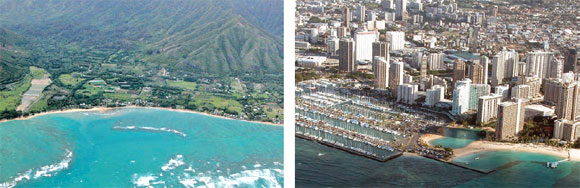
The communities of Punalu‘u (left) and Honolulu (right) on the island of O‘ahu
Hawai‘i has experienced numerous destructive tsunamis and the potential for future events threatens the safety and economic well being of its coastal communities. Although tsunami-evacuation zones have been delineated, what is in these areas and how communities have chosen to develop within them has not been documented. A community-level vulnerability assessment using geographic-information-system tools was conducted to describe tsunami-prone landscapes on the Hawaiian coast and to document variations in land cover, demographics, economic assets, and critical facilities among 65 communities. Results indicate that the Hawai‘i tsunami-evacuation zone contains approximately 80,443 residents (seven percent of the total population), 67,113 employees (eleven percent of the State labor force), and 50,174 average daily visitors to hotels (44 percent of the State total). With regards to economic conditions, the tsunami-evacuation zone contains 5,779 businesses that generate $10.1 billion in annual sales volume (both eleven percent of State totals), and tax parcels with a combined total value of $36.1 billion (18 percent of the State total). Although occupancy values are not known for each facility, the tsunami-evacuation zone also contains numerous dependent-population facilities (for example, child-day-care facilities and schools), public venues (for example, religious organizations and parks) and critical facilities (for example, fire stations). The residential population in tsunami-prone areas is racially diverse, with most residents identifying themselves as White, Asian, or Native Hawaiian and Other Pacific Islander, either alone or in combination with one or more race. Fifty-three percent of the households in the tsunami-evacuation zone are renter occupied. The employee population in the tsunami-evacuation zone is largely in accommodation and food services, health services, and retail-trade sectors.
Results indicate that community vulnerability, described here by exposure (the amount of assets in tsunami-prone areas) and sensitivity (the relative percentage of assets in tsunami-prone areas) varies considerably among 65 coastal communities in Hawai‘i. Honolulu has the highest exposure, Punalu‘u has the highest sensitivity, and Nāpili-Honokōwai has the highest combination of exposure and sensitivity to tsunamis. Results also indicate that the level of community-asset exposure to tsunamis is not determined by the amount of a community’s land that is in tsunami-evacuation zones. Community sensitivity, however, is related to the percentage of a community’s land that is in the tsunami-prone areas. This report will further the dialogue on societal risk to tsunami hazards in Hawai‘i and help identify future preparedness, mitigation, response, and recovery planning needs within coastal communities and economic sectors of the State of Hawai‘i.
Abstract
Introduction
Purpose and Scope
Methods and Data
Study Area
Land-Cover Data
Population Data
Economic Data
Critical-Facilities Data
Composite Indices of Exposure and Sensitivity
Statistical Methods
Results
Land Cover
Population
Residential Populations
Employee Populations
Dependent Populations
Tourist Populations
Economic Assets
Critical and Essential Facilities
Composite Indices of Community Exposure and Sensitivity
Statistical Relationship to Land-Cover Data
Summary
Acknowledgments
References Cited
Glossary
Appendix A. North American Industry Classification System (NAICS) Codes
Appendix B. Overview of Project Database
Appendix C. Supplemental Maps of Exposure and Sensitivity Results
1. Oblique photographs of (A) the community of Punalu‘u (B ) the community of Ewa Beach, (C ) the Ala Wai Boat Harbor near Waikïkï Beach, Honolulu, and (D ) Honolulu Harbor
2. Map of the State of Hawai‘i, including census-designated places that intersect tsunami-evacuation zones
3. Map of land-cover type for the Island of O‘ahu
4. Distribution of land-cover classes (by area) in tsunami-evacuation zones for the State of Hawai‘i
5. Amount and percentage of land-cover cells classifed as developed in tsunami-evacuation zones
6. Number and percentage of residents in tsunami-evacuation zones
7. Number and percentage of employees in tsunami-evacuation zones
8. Sum and percentage of hotel average daily visitor (ADV) estimates
9. Amount and percentage of total parcel value (minus exemptions)
10. Types of businesses in tsunami-evacuation zone
11. Map of composite exposure and sensitivity values
12. Frequency histogram of the sum of normalized exposure and sensitivity indices
13. Comparison of normalized exposure and sensitivity indices
14. Sum of normalized exposure and sensitivity indices for selected community assets
15. Scatter-plots comparing the distribution of land and of residents in relation to tsunami-evacuation zones
1. Demographic characteristics for residential populations.
2. Summary of the amount and percentage of dependent-population facilities in tsunami-evacuation zones.
3. Summary of the amount and percentage of public-venue locations in tsunami-evacuation zones.
4. Summary of the amount and percentage of economic assets in tsunami-evacuation zones.
5. Summary of the amount and percentage of critical- and essential-facilities in tsunami-evacuation zones.
6. Composite exposure and sensitivity values for communities in the tsunami-evacuation zone.
7. Statistical results for simple linear regression analyses comparing the amount of land and the amount of selected community assets.
Supporting Database This database contains community-specific data on exposure and sensitivity to tsunami hazards and is described in Appendix B of the report.
Wood, Nathan, Church, Alyssia, Frazier, Tim, and Yarnal, Brent, 2007, revised 2008, Variations in community exposure and sensitivity to tsunami hazards in the State of Hawai`i: U.S. Geological Survey Scientific Investigation Report 2007-5208 v. 1.1, 42 p. [https://pubs.usgs.gov/sir/2007/5208/].
Version history
This report is available online in Portable Document Format (PDF). If you do not have the Adobe PDF Reader, it is available for download at no cost from Adobe Systems Incorporated.
Send questions or comments about this report to the author, Nathan Wood , (360) 993-8951.

![]() U.S. Department of the Interior | U.S. Geological Survey
U.S. Department of the Interior | U.S. Geological Survey
URL: https://pubs.usgs.gov/sir/2007/5208/
Page Contact Information: Michael Diggles
Page Created: October 2, 2007 (av)
Page Last Modified: November 18, 2008
(md)