USGS Scientific Investigations Report 2008-5023
<--Return to Contents
MISCELLANEOUS TOPICS IN MODELING AND GEOPHYSICS
By Sachin D. Shah1, Bruce D. Smith2, Allan K. Clark3, and Wade H. Kress4
1U.S. Geological Survey,
8027 Exchange Drive,
Austin,
Texas
78754
2U.S. Geological Survey,
P.O. Box 25046, MS 973,
Denver,
Colorado
80225
3U.S. Geological Survey, 5563 De Zavala,
Suite 290,
San Antonio,
Texas
78249
4U.S. Geological Survey,
944 Arroyo Drive,
San Angelo,
Texas
76901
Download PDF [4.2 MB].
Adobe Reader is required to view the report. A free copy of the Adobe Reader may be downloaded from Adobe Systems Incorporated.
The U.S. Geological Survey, in cooperation with San Antonio Water System, conducted a geophysical and geological study of the Cibolo Canyon development area, northeast Bexar County, Texas, to characterize hydrostratigraphic features and to map surface and subsurface hydrogeologic features of the Edwards aquifer. Capacitively-coupled (CC) resistivity and frequency-domain electromagnetic (FDEM) profiling, direct current resistivity depth imaging (2D-DC) profiles, and time-domain electromagnetic (TDEM) soundings were used in conjunction with new geologic mapping, and borehole logging. This study shows that near surface geophysical methods were effective in defining electrical signatures of the various stratigraphic members of the Edwards aquifer. In general the upper hydrostratigraphic units of the Edwards aquifer (Kainer Formation) are less resistive than the lower units (Person Formation). The upper hydrostratigraphic units of the underlying Trinity aquifer have a lower resistivity than the overlying Edwards. The TDEM soundings were able to delineate changes in elevation of the base of the resistive units and define the amount of vertical displacement across the faults. Both CC resistivity and FDEM methods were used to map hydrostratigraphic contacts, fault zones, and possible karst features. The 2D-DC resistivity imaging techniques showed lateral changes in the subsurface lithology that correlate well with the CC and FDEM data. The TDEM and 2D-DC methods had limited application due to site accessibility and project time lines. Results from the study demonstrated that combining multiple geophysical methods and geological mapping significantly improved the hydrogeologic mapping the Cibolo Canyon development area.
The Edwards aquifer is a very productive karst aquifer system located throughout central and western Texas. The dissolution-modified, faulted limestone aquifer is the primary source of public-water for the city of San Antonio and most of central Texas. In Bexar County, residential and commercial development of the Edwards aquifer recharge zone is increasing. The aquifer could become contaminated by spills, leakage of hazardous materials, or runoff from the rapidly developing urban areas that surround, or are built on, the fractured and faulted karstic limestone outcrops that form the recharge zone (Buszka, 1987, p. 2). Currently (2007), a large area northeast of San Antonio, Texas, is being developed in the Cibolo Canyon area (fig. 1). In August 2007, The U.S. Geological Survey (USGS), in cooperation with the San Antonio Water System (SAWS), conducted a multi-tool geophysical and geologic study to map surface and subsurface hydrostratigraphic features, including karst features, within the Edwards. Data collection and analysis was targeted along one section of the fault where equal comparisons of each method can be made (fig. 1). Methodologies used include TDEM soundings, continuous CC resistivity and FDEM profiles, and 2D-DC resistivity imaging profiles. The goal of the project was to better understand the framework and structure of the Edwards aquifer in the Cibolo Canyon development area.
The study area encompasses about 20 square kilometers and is located in northeast Bexar County (fig. 1). Cibolo Creek, located on the northeast side of the development area, forms the border between Bexar County and Comal County. The Lower Cretaceous rocks that crop out at the Cibolo Canyon area, from oldest to youngest, are the Trinity Group and Edwards Group. The hydrostratigraphic divisions of the Edwards Group correspond with the lithologic divisions based on depositional environments. The Edwards Group in Bexar County is composed of approximately 450 ft of limestone, chert and dolomite (Stein and Ozuna, 1995). According to Rose (1972) the Edwards Group is composed of the Kainer and Person Formations informally referred to as the upper and lower Edwards Group. Rose (1972) further subdivided the Kainer Formation into four informal stratigraphic units which are the basal nodular member, the dolomitic member, Kirschberg evaporite member, and the grainstone member (table 1). Rose (1972) also subdivided the Person Formation into the regional dense member, the leached member, the collapsed member, the cyclic member and the marine member (table 1).
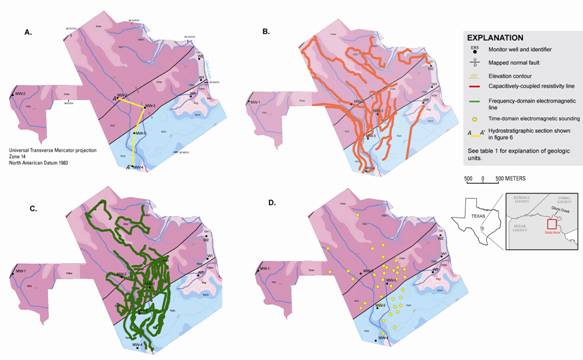
Figure 1. Location of the study with hydrogeology adapted from Stein and Ozuna (1995) and location of geologic transects: (A) hydrostratigraphic section A-A’ through existing wells, (B) capacitively-coupled resistivity lines, (C) frequency-domain electromagnetic lines, and (D) time-domain electromagnetic soundings, Cibolo Canyon development area, Bexar County, Texas.
Table 1. Summary of stratigraphic units that crop out on the Cibolo Canyon development area, Bexar County, Texas 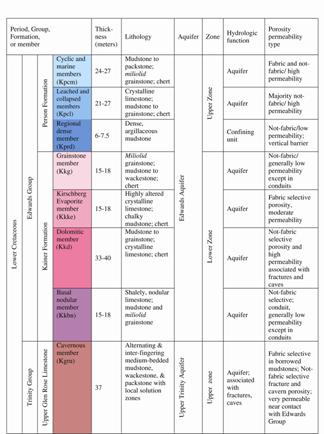
Lithology, stratigraphy, diagenesis, and karstification account for the high effective porosity and permeability in the Edwards aquifer. Karst features that can greatly enhance the effective porosity and permeability in the outcrop include sinkholes and caves. The primary controlling factor on cave development appears to be fractures (Veni, 1988). Also, extensions perpendicular to primary fault trends appears to have acted as the catalyst for cave formation and location of caves (Clark and Journey, 2006). Faulting may have an effect on ground-water flow paths at the Cibolo Canyon development area. An important fault at the site is Bat fault trending southwest to northeast within the study area. The amount of displacement along this particular fault tends to vary, and thus the effectiveness of the fault as a barrier to flow probably changes along the fault plane. Because fault zones can serve as fracture conduits for ground-water flow, characterizing and mapping hydrostratigraphic features in the study area is vital for understanding lateral and vertical ground-water flow for future water-quality studies.
First, a reconnaissance-level surface geologic mapping was done to refine the existing regional geologic map of the area (Stein and Ozuna, 1995) and to prioritize areas for geophysical surveys. Hydrostratigraphic units were identified from outcrops and borehole geophysical logs to revise the original geologic map by Stein and Ozuna (1995). Distinctive marker beds were identified in the field and used to correlate hydrogeologic subdivisions and their respective thicknesses.
In order to estimate the electrical signature (resistivity range) for particular geophysical hydrostratigraphic units, ground geophysical data were acquired in areas where new reconnaissance geologic mapping identified exposed units. Forty-four TDEM soundings, 16.8 km of continuous CC resistivity profiles, approximately 30 km of continuous FDEM survey lines, and two 480-m long 2D-DC resistivity imaging profiles were collected along intersecting lines (fig. 1). Near-surface profiles were collected using both continuous CC resistivity and FDEM methods. 2D-DC resistivity and TDEM were used to delineate electrical changes in the deeper subsurface; specifically to identify any offsetting caused by faulting, as well as to define the hydrostratigraphy. Using these methods, a range of resistivities were acquired that corresponded to a particular hydrostratigraphic unit or geologic member in the Cibolo Canyon development area (table 1).
The Geometrics1 OhmMapper (Geometrics Inc., 2007) TR-5 was used to measure the resistivity of the near surface along profiles in the study site. The OhmMapper TR-5 is a capacitively-coupled, towed-array resistivity system consisting of one transmitter and a combination of one to five receivers (Geometrics Inc., 2007). A dipole-dipole array with a dipole length of 10 m and a dipole separation of 5 m produced the best results for this investigation and was used to collect all of the CC resistivity data for each profile (fig. 2).
1Any use of brand or trade names does not imply endorsement by the USGS.
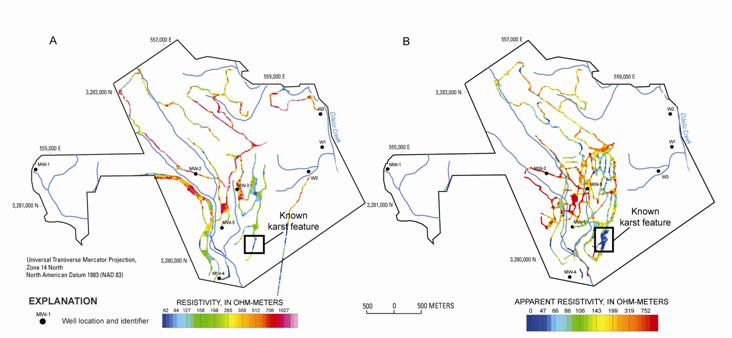
Figure 2. Map of near-surface profiles geophysical of (A) gridded resistivity along capacitively-coupled survey lines and (B) gridded apparent resistivity along frequency-domain electromagnetic survey lines, Cibolo Canyon development area, Bexar County, Texas.
The data are directly compared to the results of the FDEM survey (described below). The inversion results show that the area has a highly resistive surface of up to 1,500 ohm-m across most of the site (fig. 2). Figure 3 shows an example of a two-dimensional CC-resistivity profile that was collected on a north-south transect through the site across Bat Cave fault. The geology shown at the top of the profile is the original from Stein and Ozuna (1995). Geology shown at the bottom of the profiles (figs. 2 and 3) is the revised geology based on the geophysics and new geologic mapping. The CC profiles (figs. 2 and 3) and resistivity depth sections demonstrate that the geophysical survey data suggests a more complex hydrostratigraphy than originally mapped. The data also provides a more accurate location for the Bat Cave fault.
FDEM data were collected in the same areas as the OhmMapper and was also used to fill in data gaps in areas where the OhmMapper could not be used due to limited access (figs. 1 and 2) due to dense vegetation. FDEM data were compared to CC resistivity data. The FDEM surveys were performed with the GEM-2, a broadband, multi-frequency, fixed-coil EM induction instrument (Geophex, Ltd., 2007). The GEM-2 was operated in vertical-dipole mode (horizontal, coplanar coils) having a fixed 1.67 m spacing between coils. Five frequencies were measured: 6,270, 12,030, 24,450, 31,470, and 43,530 Hz (hertz).
Once the data were corrected for instrument drift using the calibration station data (Abraham and others, 2006), CC resistivity data were used to calculate a parts-per-million response and was then used to calibrate the GEM-2 data. FDEM was effective in detecting lateral electrical changes and anomalies that could be interpreted as karst features throughout the area. The FDEM data correlate well with the CC resistivity data and serve as a quality assurance/quality control method for both continuous profiling methods (fig. 2).
The IRIS Instruments Syscal Pro system was used to collect two 2D-DC resistivity profiles of apparent resistivity data using the dipole-dipole and Wenner-Schlumberger arrays (Iris Instruments, 2006). IRIS software was used for the data interpretation. The raw field data (current and voltage measurements) were also used to review uncertainty by evaluating the minimum and maximum current (transmitter) and voltage (receiver) values as well as the standard deviation of the computed apparent resistivity data using Prosys II version 2.15 (Iris Instruments, 2006).
The 2D-DC resistivity data model resolves lateral and vertical changes in electrical resistivity across Bat Cave fault. The data map resistive limestone units in the geologic section. An integrated interpretation of the 2D-DC resistivity data is given in a following section.
Forty-four TDEM soundings were collected to provide a uniform distribution of data to define the vertical electrical stratigraphy near Bat Cave fault (fig. 1D). The Alpha Geophysics terraTEM system, and the Geonics Protem 47 and 57, were evaluated for data quality at the site. Approximately eight soundings were collected using the Protem system, whereas, the terraTEM was used to collect approximately 36 40-m2 TDEM soundings. After each sounding was inverted, a layered-earth model was generated and compared with other soundings along the same profile. Inversion results depicted a distinct electrical contrast between the Edwards aquifer and the more conductive hydrostratigraphic units of the underlying Trinity aquifer.
Generally, all of the TDEM soundings show a highly resistive first layer about 25-75 m thick with an underlies conductive layer (fig. 4). The resistive first layer consistently correlates with the lower Edwards aquifer (dolomitic member) that overlay the more conductive units of the upper Trinity aquifer. The elevation of this contact compares well with interpretation of elevations of hydrostratigraphic units picked from nearby borehole geophysical logs. Equivalence models show that the depth at which the contact is interpreted in the TDEM soundings could vary by approximately 10-15 m.
The data from surveys using four geophysical methods, new surface geological mapping, and borehole geologic data were used to define the electrical properties of hydrostratigraphic units and map them in the surface and subsurface. As part of the study, possible new karst features and structures were mapped in the Cibolo Cibolo Canyon development area. The integrated interpretations are divided into the two main objectives of the study: hydrostratigraphic electrical properties, and near-surface and subsurface mapping of hydrogeology.
The geologic features that are important in controlling the distribution and flow of ground water constitute the hydrogeology. In this study area, the important elements of the hydrogeology are the lithology, structure, and karst features. Each element has particular, but not unique, electrical signatures in the ground surveys that have been used to revise the hydrogeologic map of Stein and Ozuna (1995).
In general the different hydrogeologic units of the aquifers have a predictable difference in electrical resistivity based on their mineralogy, rock type, and water content (Smith and others, 2003 and 2007). The upper zone of the Edwards Group (Person Formation in the study area) has greater amounts of mudstones and wackestone than the lower zone (Kainer Formation) and thus has a lower resistivity. The highest resistivities are associated with the massive limestone units in the Leached and Collapsed Member of the upper zone and the Dolomitic and Kirschberg evaporite member of the lower zone. The high resistive units are shown in the 2D-DC resistivity profiles in figure 4 where the upper and lower zones of the Edwards Group are in fault contact and well mapped in the two profiles. It should be noted in figure 4 that the very near surface to a depth of one to two meters has highly variable resistivity which can be due to weathering and construction activities (mostly bulldozing) which created the open areas in the study area. There is not a significant weathered zone, regolith, or epikarst layer in the study area. Table 2 gives a qualitative assessment of the resistivities of the units of the Edwards aquifer in the study area.
The upper Trinity Group (not shown in table 2) has moderate to low resistivities. The relatively lower resistivity in comparison to the lower zone of the Edwards Group (Kkd and Kkke) is shown best by the deeper TDEM soundings in figure 4 (also shown in the borehole logs).
Table 2. Generalized ranges in resistivity for units of the Edwards aquifer, in ohm-meters, Cibolo Canyon development area, Bexar County, Texas
Edwards aquifer unit |
Hydrologic characterization |
Generalized resistivity range |
Cyclic and marine |
high permeability, local low permeability mudstone |
Moderate 100-300 |
Leached and collapsed |
high permeability |
High 300-500 |
Regional dense |
low permeability, barrier to vertical flow |
Low Below 100 |
Grainstone |
generally low permeability, local high permeability in conduits and fractures |
Moderate 100-300 |
Kirschberg evaporite |
moderate permeability |
High 300-500 |
Dolomitic |
high permeability associated with fractures and caves |
Very high Above 500 |
Basal nodular |
generally low permeability, local high permeability in conduits and fractures |
Low Below 100 |
Karst features can have an electrical signature ranging from resistive to conductive. Sinkholes and dolines may be associated with near surface clay-filled fissures possibly associated with deeper voids. Thus, in resistive terrains, these features may be anomalous low resistivity areas. In contrast, large near surface air-filled voids (caves and caverns) may be very high resistivity areas. Some of the anomalously low resistive areas in the CC profile shown in figure 3 within the resistive Dolomitic member could be karst features.
Structures can be either barriers to or channels for ground-water flow. One mechanism by which they can become barriers is through development of a clay "seal" along the fault plane. Maclay and Small (1976) developed a model by which normal faulting could juxtapose impermeable (mudstone) and permeable (limestone) units thus forming a barrier to ground-water flow in the limestone. They demonstrated that this type of model could produce the unusual ground-water flow paths of the Edwards aquifer that are nearly perpendicular to the topographic gradient. Thus, knowing fault offset and local hydrostratigraphy is critical to understanding possible ground-water flow. Figure 5 shows that the Bat Cave fault is associated with a local, nearly vertical low resistivity zone (blue) that can be interpreted as a clay filling along the fault which could influence local ground-water flow. The resistivity depth section in figure 5 also suggests that the permeable leached and collapsed members of the upper Edwards aquifer are at the same elevation as the Dolomitic member of the lower Edwards aquifer. Thus there could be a flow path across the fault if there is not a "seal."
Figure 4 makes use of the deeper penetrating TDEM sounding data interpretation and the data from boreholes to show structures and elevation changes of hydrostratigraphic units. As noted above, the shallow mapping profile data as well as the borehole data show that the upper and lower zones of the Edwards Group are in fault contact but still constitute a possible shallow flow path. Small faults on the south end of the profile (distance 1,950 m in fig. 4) have been mapped by geologic reconnaissance and geophysical profiling discussed above, which may also influence ground-water flow. There is a fracture zone interpreted north of Bat Cave fault in the hydrogeologic section (fig. 4) between distance 325 and 650 m. This fracture zone is in the same general location as a fault shown in the Stein and Ozuna (1995) hydrogeologic map (fig. 1). The TDEM soundings at sites 1 and 7 show an interpreted resistivity which is much lower than predicted from the general electrical signature of the Dolomitic unit (table 2). In addition, TDEM sounding at sites 13 and 14 have suggest resistivities for the Dolomitic unit more in agreement with the range in table 2. One reason for the low resistivity at site 1 and 7 may be the intense fracturing observed at outcrops in the area. These may be clay and water filled fractured areas of lower resistivity that could provide conduits for ground-water flow.
The integration of surface geophysics with hydrogeologic mapping was conducted to focus on critical areas defined by each member of the Edwards aquifer. In general, the geophysical data show a sharp electrical contrast across Bat Cave fault (figs. 2-5). Preliminary CC resistivity data more accurately located Bat Cave fault than the previous geologic mapping (figs. 2 and 3). In the profile shown in figure 3, approximately 100 m from the southern end of the line, there is a sharp change from low resistivity (20-80 ohm-m) to a moderate resistivity (200-600 ohm-m). This sharp break in resistivity did not correspond to any previously mapped contacts or faults. During reconnaissance field mapping, a new cross fault was found that exposed the Regional dense member (Kprd) not mapped previously. Another abrupt resistivity change is observed in the profile (fig. 3) approximately 50 m north of the original mapped location of Bat Cave fault. A moderately resistive (200-600 ohm-m) zone characteristic of the Leached and collapsed member is juxtaposed upon a highly resistive (900-1,000 ohm-m) zone, and is interpreted to be the Dolomitic member (Kkd) of the Edwards aquifer. Multiple continuous CC resistivity profile lines were collected (fig. 1) that crossed the suspected fault location and the same distinct resistivity change to very high resistivity was found. This resistivity expression of Bat Cave fault decreases in the eastern-most CC resistivity transects, which appear to remain moderately conductive north of the fault (figs. 2 and 3). Geologic mapping from new exposures in this area suggests previously unknown cross faulting (figs. 5 and 6). Surface geologic mapping revealed a previously unmapped exposure of the Cyclic and marine member south of Bat Cave fault as well as another unmapped Grainstone member exposure immediately to the north of Bat Cave fault. The Grainstone member appears to have approximately the same electrical signature as the other moderately conductive layers south of the fault.
Figure 2 (boxed area) shows a relatively large conductive area (blues) on the west side of the site. These areas are interpreted as possible karst or intensely fractured areas (figs. 2 and 6) that have been filled with clays and conductive soils. The highly conductive areas observed in the Leached and collapsed member southeast of Bat Cave fault correspond to a sinkhole discovered at the site. These same two features are also evident in the FDEM data (fig. 2). Geophysical data collected around the area provided an accurate electrical signature of the karst feature. The sinkhole, at the time of data collection, was retaining water. This observation suggests that some karst areas in the study area may be filled with clay or other soils that may help in retaining water. The FDEM gridded apparent resistivity in the same area (fig. 2) shows a similar conductive area. Other potential karst areas are noticeable throughout the site both from the geophysical profile data (anomalous resistivity values) and the reconnaissance mapping (fig. 6).
Each of the geophysical techniques used contributed to enhancing the understanding of the electrical properties of the members of the Edwards aquifer in the Cibolo Canyon development area and to refining the location of fault zones, such as the Bat Cave fault located on the southern half of the site. The CC resistivity and FDEM methods complemented each other in providing information on the lateral variations of the near surface resistivity relating to the contacts of the various members of the Edwards and Trinity aquifers. Two adjacent 2D-DC resistivity profiles show a vertical conductive feature associated with Bat Cave fault (fig. 5). The highly conductive features along the southwest portions of the 2D-DC resistivity profiles could possibly be clay filled fractures saturated from heavy rains that occurred during much of the data collection effort. TDEM results helped locate the elevation of the base of the Edwards aquifer at depths beyond the shallow penetrating methods used in profiling. TDEM interpretations suggest the amount of displacement associated with Bat Cave fault (fig. 4). Incorporating previous knowledge of faulting in the area with TDEM soundings and hydrostratigraphic characterization of the subsurface structure can help conceptualize the hydrologic system at the Cibolo Canyon development area.
A revised geologic map of the Cibolo Canyon development area (fig. 6) was constructed by utilizing preliminary surface geologic mapping and surface geophysical data collected during the investigation. Previously unknown hydrostratigraphic features such as sinkholes and zones of intense fracturing were mapped using integrated interpretation of all data. Locations of the geologic contacts of the members of the Edwards aquifer (as well as Bat Cave fault) were improved and could alter previous concepts of ground-water flow on the northeast side of the fault.
The results of this geophysical investigation could help water managers to better understand the hydrogeology, ground water flow paths and areas of recharge at the Cibolo Canyon development area. This study could also assist planners in characterizing the subsurface by improving knowledge of what can be expected from integrated geophysical and geological investigations in karstic areas and by suggesting where potential areas of interest may be when evaluating possible locations for monitoring wells.
Abraham, J.D., Deszcz-Pan, M., Fitterman, D.V., and Burton, B.L., 2006, Use of a handheld broadband EM induction system for deriving resistivity depth images: Proceedings 19th Annual Symposium on the Applications for Environmental and Engineering Hazard, Environmental Engineering and Geophysical Society, 10p.
Advanced Geosciences Inc., 2007, EarthImager resistivity inversion software: accessed October 30, 2007 at http://www.agiusa.com/earthimager3d.shtml.
Buszka, P.M., 1987, Relation of water chemistry of the Edwards aquifer to hydrogeology and land use, San Antonio region, Texas: U.S. Geological Survey Water-Resources Investigations Report 87-4116, 100 p.
Clark, A.K., and Journey, C.A., 2006, Flow paths in the Edwards aquifer, northern Medina and northeastern Uvalde Counties, Texas, based on hydrologic identification and geochemical characterization and simulation, U.S. Geological Survey Scientific Investigations Report 2006-5200.
Geometrics, 2007, OhmMapper capacitively coupled resistivity system: accessed October 30, 2007, at http://www.geometrics.com/OhmMapper/ohmmap.html.
Geophex, Ltd., 2007, GEM-2 broadband EMI sensor: accessed October 30, 2007, at http://www.geophex.com/GEM-2/GEM-2%20home.htm.
Geosoft Inc., 2007, Mapping and processing system help topics: Oasis Montaj MAPS version 6.4.
Iris Instruments, 2006, Principles of geophysical methods for groundwater investigations: accessed August 30, 2006, at http://www.iris-instruments.com.
Maclay, R.W., and Small, T.A., 1976, Progress report on geology of the Edwards aquifer, San Antonio area, Texas, and preliminary interpretation of borehole geophysical and laboratory data on carbonate rocks: U.S. Geological Survey Open-File Report 76-627, p 65.
Rose, P.R., 1972, Edwards group, surface and subsurface, central Texas: Austin, University of Texas, Bureau of Economic Geology Report of Investigations 74, 198 p.
Smith, B.D., Irvine, R., Blome, C.D., Clark, A.K., and Smith, D.V., 2003, Preliminary results, helicopter electromagnetic and magnetic survey of the Seco Creek area, Medina and Uvalde Counties, Texas: Proceedings for the Symposium on the Application of Geophysics to Environmental and Engineering Problems, San Antonio, Texas, 13p.
Smith, B. D., Blome, C.D., Clark, A. C., Kress, W., Smith, D.V., 2007, Using geophysics to define hydrostratigraphic units in the Edwards and Trinity aquifers, Texas: Proceedings American Geophysical Union Spring Meeting 2007, 1p.
Stein, W.G., and Ozuna, G.B., 1995, Geologic Framework and Hydrogeologic Characteristics of the Edwards Aquifer Recharge Zone, Bexar County, Texas, United States Geological Survey, Water-Resources Investigations Report 95-4030.
Veni, George, 1988, The caves of Bexar County, 2d ed.: Austin, Tex., University of Texas, Texas Memorial Museum Speleological Society Bulletin, v. 10, p. 199-213.
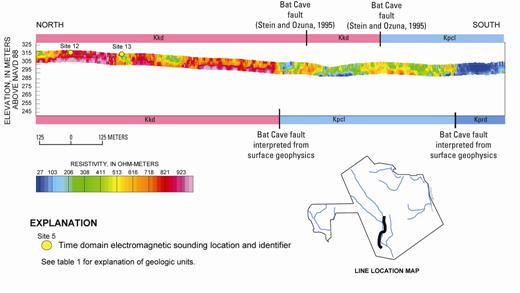
Figure 3. Resistivity depth section for one capacitively-coupled survey line crossing Bat Cave fault, Cibolo Canyon development area, Bexar County, Texas. Geologic units and location of Bat Cave fault adapted from Stein and Ozuna (1995) are shown along the top of the panel. Note that the survey line crossed Bat Cave fault twice as positioned in the older hydrogeologic map. Shown along the bottom of the profile are the location of geologic units and structure as interpreted from the geophysical data and geological reconnaissance from this study.
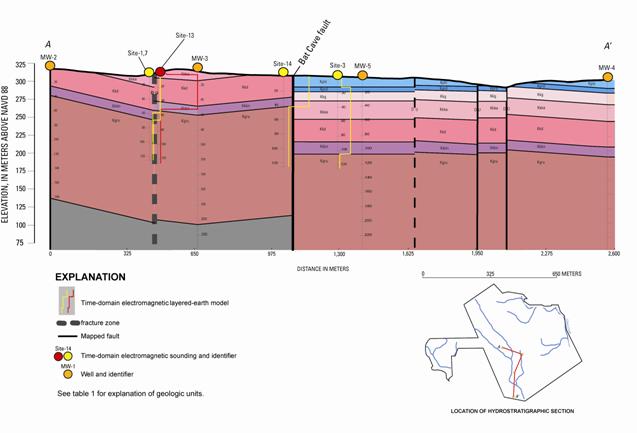
Figure 4. Conceptual hydrostratigraphic section A-A' across Cibolo Canyon development area, Bexar County, Texas. Interpreted resistivity-with-depth profiles for time domain electromagnetic soundings near the section are shown. Note that soundings 1 and 7 are located near each other and yield similar results (lighter lines).
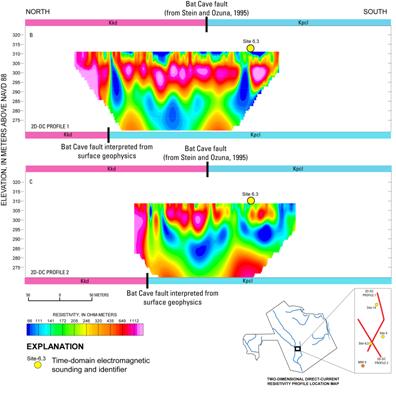
Figure 5. Resistivity depth sections for two-dimensional direct-current (2D–DC) resistivity profiles 1 and 2 with time-domain electromagnetic sounding location, Cibolo Canyon development area, Bexar County, Texas.
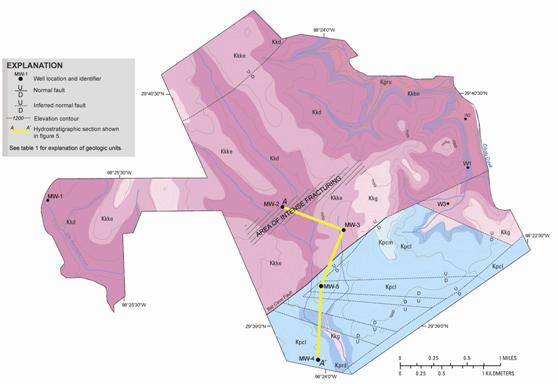
Figure 6. Revised surface geologic map incorporating geologic reconnaissance, well data, and geophysical data of the Cibolo Canyon development area, Bexar County, Texas.

![]() U.S. Department of the Interior |
U.S. Geological Survey
U.S. Department of the Interior |
U.S. Geological Survey
URL: http://pubsdata.usgs.gov/pubs/sir/2008/5023/43shah.htm
Page Contact Information: Eve L. Kuniansky
Page Last Modified: Thursday, 10-Jan-2013 15:23:59 EST