Scientific Investigations Report 2008–5027
U.S. GEOLOGICAL SURVEY
Scientific Investigations Report 2008–5027
Water samples were collected during 2002–2005 over a range of streamflow conditions (fig. 2), although most samples were collected during storms. Some of the low-flow samples were collected from the mainstem Clackamas River in 2001 during winter base-flow conditions in January and during summer low-flow conditions in August (Carpenter, 2004). The three Deep Creek basin sites included in the USGS EUSE study were sampled for pesticides six times each between November 2002 and August 2004, including high- and low-flow conditions, but sampling did not target storm runoff (fig. 2).
Water samples were collected from the Clackamas River during a range of streamflow conditions in 2002–2005 for the SWQA study, including low-flow (summer base flow), moderate, and high-flow conditions, but storms were purposely avoided by design. The SWQA study aimed to characterize the quality of source and finished drinking water supplies during representative conditions, not during periodic episodes of storm runoff. One set of source and finished water samples, however, was collected from the study water-treatment plant on May 18, 2005, during an elevated turbidity event in the mainstem Clackamas River (8.7 FNUs; appendix C, table C4). The mainstem Clackamas River (source water) was sampled during two storm events in May and September 2005, along with finished drinking water from the one treatment plant during the September 2005 storm.
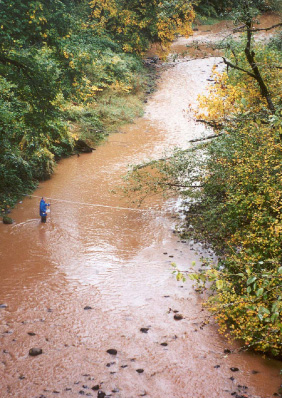 Stormwater runoff produces high turbidity in lower Deep Creek. (Photograph taken October 2000.)
The storm samplings in May and September 2005 were designed to characterize pesticide concentrations during the spring high-use period and during the first major storm in autumn (fig. 3). In May, storm samples were collected from nine tributary sites plus source water from the water-treatment plant in the lower Clackamas River. In September, 24 tributary sites plus source and finished water from the water-treatment plant in the lower Clackamas River were sampled following several hours of heavy rainfall (fig. 4). In September, the storm came in two waves—the first arrived in the morning, when the urban streams—Sieben and Carli Creeks—were sampled, while other streams were sampled in the afternoon after a second front of rain (fig. 4). The turbidity levels in some of the lower Clackamas River tributaries were especially high during these two storms, especially upper Noyer Creek at Highway 212, where the turbidity was 670 NTRUs during the May 2005 storm, and 2,500 NTRUs during the September 2005 storm (appendix C, table C4; also, see cover photograph). Inputs of highly turbid water from the tributaries can produce elevated turbidity levels in the mainstem Clackamas River during or following rainfall (fig. 2). For example, turbidity in the lower Clackamas River increased from less than 1 to greater than 120 FNUs during the September 2005 storm (fig. 3), largely due to inputs from the lower-basin tributaries.
Samples collected from the different tributaries may not be directly comparable because of the patchy distribution of rainfall during storms, variations in the degree to which streams responded to rainfall, and where on the storm hydrograph samples were collected. In some instances, streams were sampled during peak runoff, producing relatively high instantaneous loads of pesticides. At other sites, samples were collected at the beginning of the storm before significant runoff had occurred. Streamflow conditions during the September 2005 storm show, for example, the effects of sample-collection timing at two of the Rock Creek sites. Rock Creek at Stoneybrook Court (the downstream site) was sampled in the morning, prior to the onset of the heavy rains and runoff that occurred later in the day. Although turbidity was elevated (15 NTRUs), this sample contained fewer compounds and had lower pesticide concentrations compared with the next upstream site (Rock Creek at 172nd Avenue). This site was sampled later in the day after heavy rainfall, when turbidity was considerably higher (40 NTRUs). This sample contained some of the highest pesticide concentrations detected during the study. Some of the streams (for example, Tickle, Noyer, Rock, and Sieben Creeks) were sampled during active runoff, and samples were highly turbid (200–2,500 FNUs) (appendix C, table C4).
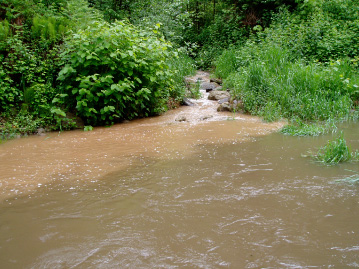 Confluence where Noyer Creek enters lower Deep Creek. (Photograph taken May 2005.)
The water yield—the instantaneous streamflow (discharge) divided by the basin area—provides a measure of the amount of runoff per unit area for a basin or site, and can be used to gauge the response of a stream during periods of storm runoff. For this report, water yields were normalized to a 1,000-acre area. Water yields were highest for the urban-affected streams—Carli, Cow, Sieben, and upper Tickle Creeks (fig. 5A). Some of the small agricultural streams sampled during the September 2005 storm (for example, Dolan Creek, and the tributaries of upper North Fork Deep and Tickle Creeks) had relatively low streamflow (≥0.1–0.2 ft3/s) and correspondingly low water yields (fig. 5A). The water yields calculated for the Rock Creek at Stoneybrook Court site in September 2005 were lower than for the two upstream locations on Rock Creek. The Rock Creek at Stoneybrook Court site was sampled in the morning prior to the onset of heavy rainfall, and may not have contained as much rainfall runoff as the two upstream sites (Rock Creek at 172nd Avenue and Rock Creek at Foster Road), which were sampled later in the day following heavy rainfall (fig. 4).
Sixty-three pesticides and degradates were detected in 119 samples collected from the lower Clackamas River mainstem, tributaries, and source or finished drinking water (table 3). Individual pesticide concentration data from the 2000–2001 study (Carpenter, 2004) are available from the Clackamas River Basin Water-Quality Assessment Web page, http://or.water.usgs.gov/clackamas/. The recent 2003–2005 data are summarized in table 3 and individual concentrations are provided in appendix C grouped into three tables according to each study: appendix table C1 contains the May and September 2005 storm data, appendix table C2 contains the 2003–2004 EUSE study data, and appendix table C3 contains data from the 2002–2005 SWQA study. The data within each table are most comparable to each other because each study analyzed a specific subset of pesticide compounds and targeted either storm conditions (USGS/CWMG studies conducted in 2000 and 2005 only) or were collected routinely (during low, moderate, and high flows [but no targeted storm sampling]). In addition to these tables, the entire dataset from the NAWQA SWQA study, including data on pesticides, volatile organic, and other anthropogenic compounds in source and finished drinking water are provided in Carter and others (2007).
The greatest number of pesticides and the highest total pesticide concentrations were detected during storms, although most samples were collected during storms (nonstorm samples included only those collected for the EUSE urbanization study and the SWQA drinking-water study). Samples collected during storms—which represent most of the tributary samples plus a few of the mainstem samples—contained between 3 and 18 compounds each, averaging 11 pesticides per sample.
Pesticide occurrence was widespread in the tributaries that drain the northwestern area of the lower Clackamas River basin, including Deep, Richardson, Rock, Sieben, Carli, and Cow Creeks (fig. 5B). Pesticides were detected in all of 59 storm samples collected from these streams. Most of the samples containing the highest pesticide concentrations or greatest number of compounds also had relatively high turbidity values (appendix C, table C4).
The two most common pesticides were the triazine herbicides simazine and atrazine, which were detected in about one-half of samples collected during 2000–2005 (table 3). CIAT (deethylatrazine, a degradate of atrazine) was detected along with atrazine in about 30 percent of samples. The common household and forestry herbicides having active ingredients glyphosate, triclopyr, and 2,4-D (the active ingredients in the widely used herbicide products RoundUP™ and Crossbow™) were frequently detected together, often making up most of the total pesticide concentration for an individual sample (fig. 6).
Distribution of the total number of pesticide compounds detected in each of the major tributaries, the Clackamas River (or source water), and in finished drinking water is presented in figure 7. Not all streams were sampled with the same frequency, differing with the individual study objectives. Nevertheless, the greatest numbers of compounds were detected in the Rock Creek and Deep Creek basins, with 34 pesticides or pesticide degradates detected in North Fork Deep Creek alone (fig. 7). The relatively high number of pesticide compounds detected in this stream was due in part to the relatively high number of samples collected from this stream (n = 13).
Twelve compounds, including nine herbicides, two fungicides, and one insecticide, had maximum concentrations exceeding 1 μg/L (fig. 8). The maximum concentrations for most insecticides ranged from about 0.1 to 0.3 μg/L, and many of these higher concentrations exceeded aquatic-life benchmarks. Three samples containing the highest total pesticide concentrations (>15 μg/L) were all collected during the September 2005 storm sampling (fig. 5B). The sample from Rock Creek at 172nd Avenue contained relatively high concentrations of the herbicide glyphosate (45.8 μg/L) and the fungicide benomyl (5.7 μg/L). Rock Creek drains rural residential, agricultural (including nurseries), and forest lands. The total pesticide concentration in Noyer Creek downstream of Highway 212 was about 20 μg/L, mostly glyphosate (12.5 μg/L) and the insecticide imidacloprid (4.5 μg/L). The total pesticide concentration was about 15 μg/L in a small tributary of North Fork Deep Creek at 312th Avenue (site 19 in fig. 1), where three herbicides—glyphosate, 2,4-D, and triclopyr—were detected at concentrations ranging from 4.8 to 6 μg/L each. A wide variety of pesticide compounds (13–15 pesticides each) also were detected in these 3 samples (fig. 5B). The highest instantaneous pesticide loads were found in Rock, Noyer, North Fork Deep Creek, Tickle, and upper Deep Creeks (fig. 5C). Tributaries draining nursery land such as Tickle, Noyer, Rock, and Sieben Creeks contained 24–30 pesticides each, with 17–18 compounds being detected in individual samples from upper Noyer and North Fork Deep Creeks during the May 2005 storm (fig. 5B).
The maximum chlorpyrifos concentrations in North Fork Deep Creek at Boring and Noyer Creek downstream from Highway 212 were 0.17 and 0.14 μg/L, respectively, during the September 2005 storm (appendix C, table C1). Azinphos‑methyl, another organophosphate insecticide, was detected at an estimated concentration of 0.21 μg/L in Doane Creek, a tributary of North Fork Deep Creek that drains the agricultural and nursery land north of Highways 212 and 26 (fig. 1; pl. 1).
Pesticides were detected in all 18 samples collected from the 3 Deep Creek basin streams sampled for the EUSE study, with between 3 and 13 pesticides detected in each sample. Six sets of pesticide samples collected during nonstorm conditions from Deep, Tickle, and North Fork Deep Creeks identified North Fork Deep Creek as a major pesticide contributor to Deep Creek during nonstorm periods (fig. 9). The total pesticide load in North Fork Deep Creek was on average three times greater than Tickle Creek and eight times greater than upper Deep Creek.
Twenty-six pesticides and degradates were detected in 39 samples collected from the mainstem Clackamas River or from the source-water tap at a direct filtration treatment plant on the lower river (fig. 2; table 3). Of the 34 samples of source water analyzed, at least 1 pesticide was detected in 22 samples (65 percent) with an average of 2–3 pesticides per sample. Pesticide concentrations in the mainstem Clackamas River generally were much lower than those in the tributaries owing to dilution from streamflow originating in the forested upper Clackamas River basin.
The most frequently detected pesticides in the mainstem Clackamas River included the herbicides simazine, diuron, and atrazine, which were detected in 8–15 samples, followed by the insecticide diazinon and the herbicide metolachlor, which were each detected 6 times (table 3). Following the pattern observed for tributaries, the greatest number and highest concentrations of pesticides were detected in the mainstem Clackamas River following storms (fig. 10). One sample of the mainstem Clackamas River collected during the September 2005 storm event contained 13 compounds—2,4-D, cycloate, dacthal (DCPA), diazinon, dimethanamid, diuron, ethoprop, glyphosate, metolachlor, prometon, propiconazole, simazine, and triclopyr (appendix C, table C3).
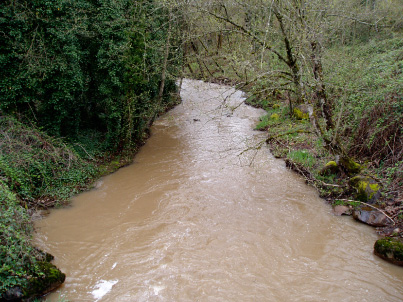 North Fork Deep Creek near Boring, Oregon. (Photograph taken April 2006.)
Fifteen pesticide compounds were detected in at least 1 sample of finished drinking water from the study water-treatment plant in the lower Clackamas River sampled during 2004–2005, including 10 herbicides, 1 insecticide, 1 insect repellent, 1 fungicide, and 2 pesticide degradates (tables 3 and 4; fig. 7). All told, there were 23 individual detections of a pesticide in finished drinking water, with at least 1 pesticide occurring in 9 of 15 (or 60 percent) of samples. About 98 percent of the 1,790 individual pesticide analyses in finished drinking water were below laboratory method detection levels. All of the concentrations for regulated pesticide compounds in finished water were far below their respective USEPA drinking-water standard, and for unregulated compounds, none of the available human Health-Based Screening Level (HBSL) benchmarks were exceeded. About one-half of the finished water detections were “e” coded (table 4), and although relatively low, they appear reliable because nearly all of the individual detections in finished drinking water had corresponding detections in source water.
In most cases, pesticide concentrations in finished water were somewhat lower than those in the source water. In addition to actual removal during treatment, small concentration differences between source and finished drinking water samples could represent variability in the analytical method at these sub-parts-per-billion concentrations. Also, the timing of sample collection can be especially important during storms, when streamflow and pesticide runoff are dynamic (fig. 3). At such times, contaminant concentration may be different in source and finished water if the timing of sample collection of the source and finished water varies significantly from the actual travel time through the treatment plant.
The four most common pesticides detected in finished drinking water were the herbicides diuron, simazine, dacthal (DCPA), and hexazinone, which occurred in two to four samples each. Simazine and diuron were each detected four times (table 3). Pesticide compounds detected once in finished water included the herbicides 2,4-D, atrazine, CIAT (an atrazine degradate), metolachlor, trifluralin, pronamide, and metsulfuron-methyl; the insecticide ethoprop, diazinon-oxon (the degradate of the insecticide diazinon), and DEET (an insect repellent).
The greatest numbers and highest concentrations of pesticides in finished drinking water were detected in samples collected after storms (fig. 10), with finished drinking water results typically following the pattern observed in the mainstem Clackamas River and lower-basin tributaries. The highest concentration of total pesticides in finished drinking water (0.28 μg/L from nine pesticide compounds) occurred in the May 18, 2005, sample collected 9 days following a storm (table 4, figs. 11 and 12). About one-third (or 38 percent) of the finished water samples contained no detectable pesticides, with a maximum of two pesticides being detected in finished water samples minimally affected by storm runoff.
Powdered activated carbon (PAC) appeared to be effective in removing some pesticide compounds present in source water samples such as OIET, cycloate, dacthal, trifluralin, and triclopyr (table 5). In most cases, however, concentrations in the source water were low (often close to the detection level), such that observed reductions during treatment may not be statistically significant for individual compounds. Nevertheless, the overall number and concentrations of pesticides in finished water decreased on the two occasions when PAC was in use. For comparison, 9 of 10 compounds detected in source water also were detected in finished drinking water on May 18, 2005, when PAC was not in use, with a marginal decrease in the total pesticide concentration (fig. 10).
Many of the pesticide concentrations in the lower-basin tributaries exceeded aquatic-life benchmarks on at least one occasion, sometimes for multiple pesticides in one sample. Four insecticides, including azinphos-methyl (AZM), chlorpyrifos, diazinon, and p,p’-DDE were detected at concentrations that exceeded USEPA aquatic-life benchmarks (table 6). AZM was detected once during the study, at a concentration of 0.21 μg/L in Doane Creek, a tributary of North Fork Deep Creek. This AZM detection exceeded the USEPA benchmark concentration for fish (0.18 μg/L for acute exposure), and for benthic invertebrates (0.08 μg/L for acute exposure) and the State of Oregon water-quality criteria (0.01 μg/L for chronic exposure).
The highest chlorpyrifos concentration (0.56 μg/L) was detected in a storm sample collected in October 2000 from Rock Creek near its mouth (Carpenter, 2004). Since then, chlorpyrifos concentrations have been highest in samples from the North Fork Deep Creek basin, where concentrations were 0.17 μg/L in North Fork Deep Creek at Boring (in September 2005) and 0.14 μg/L in Noyer Creek downstream of Highway 212 (in May 2005). These chlorpyrifos detections exceed the USEPA aquatic-life benchmark for benthic invertebrates (0.05 μg/L for acute exposure) and the State of Oregon water-quality criterion (0.043 μg/L for chronic exposure) (table 6). Chlorpyrifos concentrations in several other post-2000 samples were greater than the nonregulatory aquatic-life guideline suggested by the NAS/ NAE of 0.001 μg/L, including those from North Fork Deep Creek (at Barton) and upstream tributaries—Doane Creek and NF Deep Creek tributaries (at 312th Avenue and at Church Road)—Tickle Creek (near Boring), and Trillium Creek (a tributary of Rock Creek), where concentrations ranged from 0.004 to 0.021 μg/L (appendix C table C1). The highest chlorpyrifos concentration detected in the Clackamas River (0.006 μg/L in May 2005) exceeded aquatic-life benchmarks from the NAS/NAE and Canada (table 6). Some of the chlorpyrifos concentrations that were greater than the NAS/NAE benchmarks, however, were only slightly greater than the reporting level of 0.004 μg/L for chlorpyrifos (appendix B, table B1).
Diazinon concentrations exceeded the USEPA aquatic-life benchmark for benthic invertebrates (0.1 μg/L for acute exposure) in three streams—Carli Creek near the mouth (September 2005), Rock Creek at 172nd Avenue (September 2005), and Sieben Creek (May 2000) (Carpenter, 2004)—where the diazinon concentrations ranged from 0.16 to 0.25 μg/L. Although the sale of diazinon has been banned, regulations allow the use of existing supplies. Other streams with diazinon concentrations exceeding the NAS/NAE benchmark of 0.008 μg/L included North Fork Deep, Doane, Tickle, and Trillium Creeks (in May 2005), and the mainstem Clackamas River (source water sample from the study water-treatment plant in September 2005, when the concentration was 0.014 μg/L).
The degradate of the banned pesticide DDT (p,p’-DDE) was detected in Deep Creek at Highway 224 in October 2000 at a concentration of 0.002 μg/L (Carpenter, 2004), which exceeded the USEPA aquatic-life benchmark of 0.001 μg/L. Seven other pesticides (2,4-D, carbaryl, chlorthalonil, dieldrin, diuron, endosulfan, and malathion) exceeded aquatic-life benchmarks established by the State of Oregon, the NAS/NAE or the CCME (table 6). Although concentrations of these pesticides did not exceed benchmarks established by the USEPA, some of the compounds such as the organochlorine insecticide endosulfan have no USEPA aquatic-life benchmark. Endosulfan was detected at a concentration of 0.11 μg/L in Tickle Creek near Boring in September 2005, which is about twice the value of the State of Oregon chronic benchmark for benthic invertebrates (0.056 μg/L) and about one-third the median 96-hour LC50,the lethal concentration dosage for one-half of the test population for fish exposed to endosulfan (0.33 μg/L) (Munn and others, 2006). The malathion concentration in Rock Creek (0.047 μg/L) was well below the USEPA aquatic-life acute exposure benchmark for benthic invertebrates (0.25 μg/L), but exceeded the NAS/NAE aquatic-life benchmark of 0.008 µg/L.
Glyphosate was detected in 71 percent of samples collected during the May and September 2005 storms (table 3), with the highest concentration found in Rock Creek at 172nd Avenue (45.8 μg/L). Although this glyphosate concentration was the highest pesticide concentration detected during the study, it was still less than the USEPA aquatic life benchmark for vascular plants (850 μg/L) or the Canadian aquatic-life benchmark of 65 μg/L (table 6). None of the potentially toxic surfactants commonly included in glyphosate-containing products, however, were analyzed during this study. Some of the pesticides detected do not have benchmarks for evaluation, including benomyl, metalaxyl, imidacloprid, 3,4-dichloroaniline (a diuron degradate) and AMPA (a glyphosate degradate); these pesticides were occasionally detected at maximum concentrations ranging from 1.5 to 5.7 μg/L.
Pesticide Toxicity Index (PTI) values for samples collected in the Clackamas River basin were calculated separately for benthic invertebrates and fish (table 7). The individual toxicity values for each of the pesticide compounds detected are listed in appendix D, table D1, and samples with the highest PTI values are shown in figure 13. With the exception of one sample from Tickle Creek, which had a relatively high PTI value from the insecticide endosulfan, the PTI values generally were higher for benthic invertebrates than for fish, indicating a greater risk to these organisms. Most of the highest PTI values were for samples collected during the September 2005 storm, with the highest PTI values in samples collected from the Deep Creek basin, including North Fork Deep Creek, Tickle Creek, and Noyer Creek. Due to a lack in toxicity values for two compounds, the PTI value for the Rock Creek at 172nd Avenue sample may underestimate the potential toxicity because it did not include the fungicide benomyl and the herbicide glyphosate, which were detected at relatively high concentrations (5.7 and 45.8 μg/L, respectively).
All pesticide concentrations in finished drinking water were far below applicable USEPA Maximum Concentration Level (MCLs) for regulated contaminants and USGS Health-Based Screening Levels (HBSLs) for unregulated contaminants. HBSLs were available for nine of the pesticide compounds detected in finished drinking water (table 8). Three of the unregulated contaminants—diazinon-oxon (a degradate of the insecticide diazinon), deethylatrazine (CIAT, a degradate of the herbicide atrazine), and the insect repellent DEET—do not, however, have human-health benchmarks available for comparison because toxicity data are currently lacking. The maximum Benchmark Quotient (BQ max)—the ratio of the highest measured concentration of a detected compound in finished water to human-health benchmark—ranged from 0.09 for diuron to 0.000003 for metolachlor (table 8; fig. 14). These BQ max values for pesticides detected in finished water were 11 and more than 300,000 times lower than their respective human-health benchmarks.

![]() U.S. Department of the Interior | U.S. Geological Survey
U.S. Department of the Interior | U.S. Geological Survey
URL: http://pubs.usgs.gov/sir/2008/5027
Page Contact Information: Publications Team
Page Last Modified: Thursday, 10-Jan-2013 18:43:06 EST
