Scientific Investigations Report 2008–5135
U.S. GEOLOGICAL SURVEY
Scientific Investigations Report 2008–5135
The chamber consists of a 2.4‑mm thick, 1-m diameter hemispherical dome made of Plexiglass G (Stannard, 1988). A cylindrical 0.305-m high skirt of similar thickness, diameter, and material typically was added to the bottom of the hemisphere to measure taller plants. The combined hemisphere and cylindrical skirt has a total height of 0.805 m, an internal volume of 0.5 m3, and covers a 0.79 m2 land-surface area. Two 12-volt fans were mounted inside the chamber (about 0.3 m above the hemisphere base) andpositioned opposite each other to keep the air and water vapor well mixed. Internal fan speed was adjusted to approximate the average wind speed at the site. External wind speed was measured using a portable wind gage mounted at one-half the combined chamber and skirt height (0.4 m) and a rheostat was used to adjust the internal fan speed to match the external wind speed. Between the fans, a temperature and relative humidity probe was used to measure vapor density.
Chamber measurements at mixed-vegetation sites were collected over approximately 15-min intervals during daylight hours. Bare-soil evaporation was measured from a single site near the eddy-covariance ET station in January and May 2003, and from two replicate sites at location 1 from August 2003 through January 2006 (fig. 1B). Plant transpiration was measured in conjunction with bare-soil evaporation at location 1. Plant transpiration was measured from replicate creosote bush plants (August 2003 through January 2006) and a single shadescale plant (October 2003 through January 2006). Shrubs from the four primary plant species (creosote bush, shadescale, burrobush, and wolfberry) were measured on three separate occasions at location 2 (May 4, 2004, May 2, 2005, August 4, 2005) (fig. 1B).
The chamber was positioned over soil and plant sites while a data logger collected measurements every 2 seconds for about a 2-min interval. Between measurements, the chamber was raised above the land surface for a minimum of 2 min to obtain ambient humidity and air temperature inside the chamber. Datasets consisting of at least one measurement per site typically were collected within 15 min; datasets were repeated at or greater than hourly intervals.
The evapotranspiration rate was estimated at each soil and plant site using (Stannard, 1988):
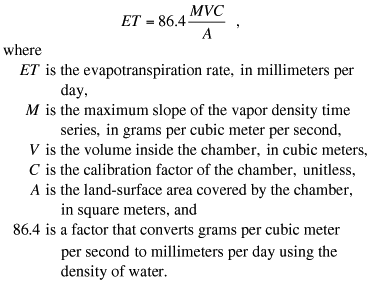 (1)
(1)
Evapotranspiration reported as millimeters per day is an instantaneous rate that occurs at the time of measurement.
The maximum constant-slope section of the vapor density time series was determined using an automated spreadsheet program that applied ordinary least-squares analysis within a 10- to 20-second measurement interval. A typical time series of vapor density inside the chamber during two consecutive measurements (creosote bush and bare soil) is shown in figure 2. Beginning with the first 5–10 points on the vapor density curve, the program stepped through the whole curve calculating the slopes while maintaining the same number of points. The final slope selection then was manually verified or adjusted as necessary to represent the best fit line of the steepest time interval. The maximum vapor density slope for creosote bush was measured between 15 and 25 seconds after chamber emplacement while the maximum slope for the bare soil site was reached between 54 and 64 seconds after emplacement.
The chamber calibration factor, which accounted for the slight hydrophilicity of the chamber material, was determined using methods described by Stannard (1988). The procedure involved evaporating a mass of water from a beaker at a known rate and then placing the chamber over the beaker to determine the chamber-measured rate. This procedure was repeated several times at each of the several known evaporation rates. Chamber and known evaporation rates were plotted against one another and the slope of the best fit line through the origin was the calibration factor used (in this case, C = 1.037).
Plant and soil ET rates computed from eq. (1) were extrapolated to compute ET on a component- and landscape-scale using a one-layer, multi-component model representing a sparse canopy on a planar surface (Stannard, 1988; Stannard and Weltz, 2006):
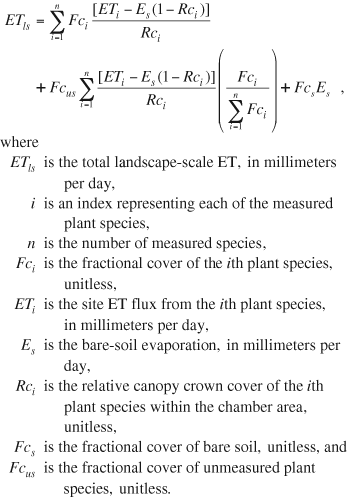 (2)
(2)
The first two terms on the right-hand side of eq. (2) represent landscape-scale transpiration from specific and unmeasured plant species; the last term represents landscape-scale evaporation from bare soil. Unmeasured plant species were assigned the average, weighted plant transpiration of measured species. Component-scale transpiration and evaporation fluxes were computed by dividing eq. (2) terms by representative Fc values. Negligible transpiration was assumed when ETiwas less than or equal to Es.
Fractional cover of bare soil and all individual plant species was measured using the line-transect method (Smith, 1974). Four 200-m transects extending outward in the northwest, northeast, southwest, and southeast directions from the eddy-covariance ET station (fig. 1B) were measured quarterly, representing a 0.16 km2 area. Plant coverage was estimated from additive measurements of the vertical projection of plant canopies overlaying line transects. Bare-soil coverage comprised gaps between plants and within plant canopies. The Fcs was computed as the total coverage of bare soil for all four transects divided by the total transect length (800 m); Fci and Fcus were computed as the total coverage of an individual plant species for all four transects divided by the total transect length; and Fcus was differentiated for species that were excluded from chamber measurements. During the period of study, non-dormant, leafed shrubs covered 4–10 percent of the landscape.
The relative plant crown cover, Rc, was estimated using photographs of the measured plant sites and the following equation (Stannard, 1988):
 (3)
(3)
Measured variables h and Rc' and computed Rc are given in appendix A. Average relative crown cover for creosote bush, shadescale, burrobush, and wolfberry was 0.64, 0.21, 0.27, and 0.68, respectively. Evaporation from canopy shaded soil (excluding gaps within plant canopies) was assumed negligible and was not separated from the plant transpiration component.
Chamber ET measurements at location 2 excluded bare soil on all dates and creosote bush in May 2003. Therefore, component-scale evaporation and transpiration fluxes measured the previous day, during a similar time interval at location 1 were substituted in eq. (2).

![]() U.S. Department of the Interior | U.S. Geological Survey
U.S. Department of the Interior | U.S. Geological Survey
URL: http://pubs.usgs.gov/sir/2008/5135
Page Contact Information: Publications Team
Page Last Modified: Thursday, 10-Jan-2013 18:53:48 EST
