Scientific Investigations Report 2008–5204
U.S. GEOLOGICAL SURVEY
Scientific Investigations Report 2008–5204
Historic and prehistoric debris-flow deposits have been found on all Cascade Range volcanoes, where unconsolidated volcaniclastic and glacial moraine deposits are washed away from the steep slopes (Scott and others, 1995). These unstable volcaniclastic and glacial deposits can be mobilized by any number of causes including an increase in seasonal melt-water discharge or saturation by autumn or spring rainfall. Other less common mechanisms for Cascade debris flows include dam-break floods, volcanic eruptions, or possibly earthquakes; however, these are much more low-frequency, high-consequence type mechanisms. The debris flow on November 6, 2006, appeared to be caused by a combination of mechanisms. Although rainfall influenced the debris flow, noticeable changes in high altitude Milk Creek snowfields, as observed by USFS and USGS, indicated that the debris flow likely mobilized after the collapse of part of a talus-covered stagnant valley snowfield (fig. 7). This type of proglacial collapse and flooding occurred during previous times and at other Cascade volcanoes (for example, Scott and others, 1995; Walder and others, 1999; O’Connor and others, 2001). Although the rainfall may not have initiated the debris flow, it did increase melting of surficial snow, amplified runoff, saturated sediments, and augmented subsnowfield streamflow. Snowfield calving and sediment unloading likely started relatively small, but continued to accumulate and erode more material as it progressed downstream (fig. 8). Because of the presence of older debris flow deposits in the area, much of the loose, previously deposited material was easily remobilized by this recent event.
The fluvial component of the debris flow that formed down the Milk Creek drainage basin was characteristic of a hyperconcentrated flow, or mud slurry. However, streamflow from Pamelia Creek likely diluted much of the mud slurry prior to its entering the North Santiam River. Analyses of water samples collected at the North Santiam monitoring station correlated with estimates of streamflow from Milk and Pamelia Creeks indicate that 3 to 6 percent of the flow volume consisted of entrained sediments (Mark Uhrich, U.S. Geological Survey, written commun., 2008). Streamflow is considered to be hyperconcentrated when 5 percent of the flow volume consists of entrained sediments (Pierson, 2005). Evidence of mud run-up on trees (fig. 9) indicated that the flood stage of this flow reached depths of at least 2.4 m in the confined, high altitude channels (table 2). As the flow spread across the valley floor, tree markings displayed a reduction in stage height to 1 m or less. High flows associated with flooding remobilized boulders and debris along Milk and Pamelia Creeks, as well as deposited sand and silt across the forest floor. Flooding and high flows eroded portions of the initial debris-flow deposit and other older deposits, reworking much of the landscape. As velocities decreased, greater volumes of fine-grained sediment were deposited within distributary channels along the Milk and Pamelia Creek drainage basins. After the debris flow slowed and deposited its coarse material, the sediment-laden streamflow continued to the North Santiam River and Detroit Lake. This type of debris-flow-induced flood surge was consistent with previous events on other Cascade volcanoes (see, for example, Scott and others, 1995; Pierson, 2005; National Park Service, 2007).
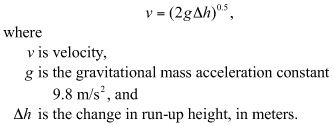
The Mount Jefferson debris flow in November 2006 was not a single flow event, but rather a series of at least three or more surges of debris and flooding (David Halemeier, U.S. Forest Service, written commun., 2008). Evidence of damming and redirection of flow, channel terracing, and deposition then scouring of material all support this hypothesis. Because this event comprised multiple flows, calculating one specific velocity was impossible. Instead, using field measurements of change in height of mud run-up on trees (fig. 10) and observations of material type, an indirect velocity equation (Jakob, 2005) was used to calculate a range of values for this event. For this study, mud run-up markings for 22 trees were measured at different locations in the depositional area (table 2). The deposit material type was initially coarse and boulder-sized before thinning to a mud slurry. Based on these observations, velocity was determined by an equation for “rocky”-type debris flows proposed by Chow (1959). The equation describes debris flow velocity in relation to the change in run-up height multiplied by a multiple of the gravitational constant (Chow, 1959, eq. 1). Two known limitations for this equation are (1) it only applies to impacted objects perpendicular to the flow direction, and (2) it assumes all kinetic energy was converted to potential energy (Jakob, 2005). Theoretical run-up equations, such as equation 1 in Chow (1959), also yield velocities as much as 30 percent lower than large-scale flume experiments (Jakob, 2005). However, given the data available, these velocity calculations offered tangible values for discussion and comparison.
 (1)
(1)
Velocities calculated using this equation reached 3.9 m/s for the different surges of debris and flooding (table 2).
The debris-flow depositional extent was determined based on field indicators, such as distal flow levees, log jams and boulder clusters, mud coatings on trees and boulders, organic debris accumulations, and tree scars (fig. 11; O’Connor and others, 2001; Pierson, 2005). Mapping the depositional extent of the Mount Jefferson debris flow in November 2006 was completed between July 2007 and July 2008. A Global Positioning System (GPS) handheld device was used to record coordinates for the outermost edge of the coarse debris flow boundary, and the coordinates were cross-referenced against aerial photography to verify accuracy.
The debris flow deposited a predominantly rocky debris fan, including large boulders greater than 0.4 m diameter, over a 0.1 km2 area in the drainage basins of Milk and Pamelia Creeks (fig. 12). The material dammed Milk Creek and redirected its flow south to a newly formed channel referred by the USFS as “2 percent Milk Creek.” Most of the coarse material from the debris flow in November 2006 was deposited along 2 percent Milk Creek (fig. 13). As material was deposited, multiple dams and levees were formed, continuously altering the direction and velocity of the debris flow. Surges of debris and flooding further altered the landscape in the drainage basins of Milk and Pamelia Creeks by reworking and depositing fine to coarse-grained material along an additional 0.35 km2 area (fig. 14). High flows in Pamelia Creek also contributed to the damage caused by the debris flow. Increased streamflow and flooding during this period forced Pamelia Creek about 100 m south to an abandon section of its original channel. The combined 0.45-km2 area represented the depositional extent, including subsequent flooding and deposition of fine-grained material along a number of other channels. All coarse material settled out before the original confluence of Milk and Pamelia Creeks, leaving only the mud slurry to pass downstream into the North Santiam River.
The depositional volume of the Mount Jefferson debris flow in November 2006 was estimated using cross-sectional transect measurements (table 3; fig. 14). For this study, cross-sectional areas were surveyed using a laser distance meter and survey staff, and angles and leveling were obtained using a Brunton compass. Using 10 transects (table 3) surveyed along the length of the predominantly coarse debris deposit, deposit values were extrapolated between cross-sectional areas to produce a generalized volume. Because each transect consisted of deposit and scour, volume measurements were based on the net deposit (total deposit – scour = net deposit). Results indicated that at least 80,000 m3 of coarse material was freshly deposited during the November 2006 debris flow. Field measurements of fine-grained sediment deposits extrapolated over the debris-flow area indicate that the hyperconcentrated flow and floodwaters contributed an additional 20,000 to 160,000 m3 of sediment, increasing the total depositional volume to 240,000 m3, not including the suspended sediment that was carried downstream. For comparison, nearly 100 Olympic-sized swimming pools could have been filled with boulders, debris, and sediment from this debris-flow event.
Although water quality was not monitored on Milk or Pamelia Creeks, automatic pumping samples collected at the North Santiam monitoring station were analyzed for turbidity and suspended-sediment concentrations. Using these samples, suspended-sediment load values were calculated for the debris flow and subsequent flooding. Estimates were based on techniques developed by Uhrich and Bragg (2003) and Bragg and others (2007). During the 24-hour period on November 6, 2006, about 15,500 to 21,000 metric tons of suspended sediment traveled downstream past the North Santiam monitoring station. If the dry weight per volume of the suspended sediment was assumed to be sand-sized or less, then the total volume for the suspended-sediment load portion of the debris flow was 9,800 to 13,000 m3. Even though other sources may have contributed minor amounts of sediment, most of the suspended-sediment load was attributed to the Mount Jefferson debris flow. This event was responsible for one of the largest single-day suspended-sediment loads of any major turbidity event in the North Santiam River basin since 1998 (Sobieszczyk and others, 2007).

![]() U.S. Department of the Interior | U.S. Geological Survey
U.S. Department of the Interior | U.S. Geological Survey
URL: http://pubs.usgs.gov/sir/2008/5204
Page Contact Information: Publications Team
Page Last Modified: Thursday, 10-Jan-2013 18:58:11 EST
