Scientific Investigations Report 2009–5108
ABSTRACT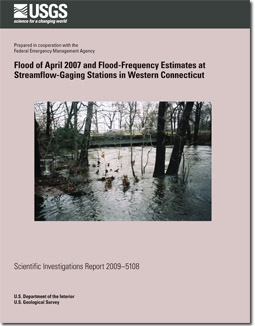
A spring nor’easter affected the East Coast of the United States from April 15 to 18, 2007. In Connecticut, rainfall varied from 3 inches to more than 7 inches. The combined effects of heavy rainfall over a short duration, high winds, and high tides led to widespread flooding, storm damage, power outages, evacuations, and disruptions to traffic and commerce. The storm caused at least 18 fatalities (none in Connecticut). A Presidential Disaster Declaration was issued on May 11, 2007, for two counties in western Connecticut—Fairfield and Litchfield. This report documents hydrologic and meteorologic aspects of the April 2007 flood and includes estimates of the magnitude of the peak discharges and peak stages during the flood at 28 streamflow-gaging stations in western Connecticut. These data were used to perform flood-frequency analyses. Flood-frequency estimates provided in this report are expressed in terms of exceedance probabilities (the probability of a flood reaching or exceeding a particular magnitude in any year). Flood-frequency estimates for the 0.50, 0.20, 0.10, 0.04, 0.02, 0.01, and 0.002 exceedance probabilities (also expressed as 50-, 20-, 10-, 4-, 2-, 1-, and 0.2- percent exceedance probability, respectively) were computed for 24 of the 28 streamflow-gaging stations. Exceedance probabilities can further be expressed in terms of recurrence intervals (2-, 5-, 10-, 25-, 50-, 100-, and 500-year recurrence interval, respectively). Flood-frequency estimates computed in this study were compared to the flood-frequency estimates used to derive the water-surface profiles in previously published Federal Emergency Management Agency (FEMA) Flood Insurance Studies. The estimates in this report update and supersede previously published flood-frequency estimates for streamflowgaging stations in Connecticut by incorporating additional years of annual peak discharges, including the peaks for the April 2007 flood. In the southwest coastal region of Connecticut, the April 2007 peak discharges for streamflow-gaging stations with records extending back to 1955 were the second highest peak discharges on record; the 1955 annual peak discharges are the highest peak discharges in the station records. In the Housatonic and South Central Coast Basins, the April 2007 peak discharges for streamflow-gaging stations with records extending back to 1930 or earlier ranked between the fourth and eighth highest discharges on record, with the 1936, 1938, and 1955 floods as the largest floods in the station records. The peak discharges for the April 2007 flood have exceedance probabilities ranging between 0.10 to 0.02 (a 10- to 2-percent chance of being exceeded in a given year, respectively) with the majority (80 percent) of the stations having exceedance probabilities between 0.10 to 0.04. At three stations—Norwalk River at South Wilton, Pootatuck River at Sandy Hook, and Still River at Robertsville—the April 2007 peak discharges have an exceedance probability of 0.02. Flood-frequency estimates made after the April 2007 flood were compared to flood-frequency estimates used to derive the water-surface profiles (also called flood profiles) in FEMA Flood Insurance Studies developed for communities. In general, the comparison indicated that at the 0.10 exceedance probability (a 10-percent change of being exceeded in a given year), the discharges from the current (2007) flood-frequency analysis are larger than the discharges in the FEMA Flood Insurance Studies, with a median change of about +10 percent. In contrast, at the 0.01 exceedance probability (a 1-percent change of being exceeded in a year), the discharges from the current flood-frequency analysis are smaller than the discharges in the FEMA Flood Insurance Studies, with a median change of about -13 percent. Several stations had more than + 25 percent change in discharges at the 0.10 exceedance probability and are in the following communities: Winchester (Still River at Robertsville, +50 percent change); Hamden (Mill River near Hamden, +46 percent change); Woodbury (Weekeepeemee River at Hotchkissville, +29 percent change); and Newtown (Pootatuck River at Sandy Hook , +28 percent change). Although the majority of the streamflow-gaging stations had discharges at the 0.01 exceedance probability smaller than in the Flood Insurance Studies, the (2007) flood-frequency estimates were larger than in the Flood Insurance Studies for stations in the following communities: Hamden (Mill River near Hamden, +53 percent change); Thomaston (Naugatuck River at Thomaston, +27 percent change); Newtown (Pootatuck River at Sandy Hook, +18 percent change); and Wallingford (Quinnipiac River at Wallingford, +13 percent change). The 1-percent exceedance probability (100-year flood) elevations at streamflow-gaging stations exceeded the FEMA projected 100-year flood elevations by more than +0.5 feet in two Flood Insurance Studies in the communities of Wallingford (Quinnipiac River at Wallingford, +0.6 feet change) and Hamden (Mill River near Hamden, + 2.3 feet change). |
First posted June, 2009 For additional information contact: Part or all of this report is presented in Portable Document Format (PDF); the latest version of Adobe Reader or similar software is required to view it. Download the latest version of Adobe Reader, free of charge. |
Ahearn, E.A., 2009, Flood of April 2007 and flood-frequency estimates at streamflow-gaging stations in western Connecticut: U.S. Geological Survey Scientific Investigations Report 2009-5108, 40 p. Available online only at http://pubs.usgs.gov/sir/2009/5108.
Abstract
Introduction
Previous Flood Investigation Studies
Storm Characteristics
Drainage-Basin Characteristics
Annual Peak-Discharge Data
Peak Discharges Affected by Flood-Control Dams
Flood-Frequency Analyses of the April 2007 Flooding
Flood-Frequency Estimates for Streamflow-Gaging Stations
Record Extension Using Two Methods: MOVE-1 and Two-Station Comparison
Comparison of the April 2007 Flood Data to Flood Insurance Studies
Summary
Acknowledgments
Selected References
Appendix 1. Federal Emergency Management Agency Disaster Declaration Map
Appendix 2. National Climatic Data Center April 2007 Storm Events: Details for Fairfield and Litchfield Counties, Connecticut
Appendix 3. Summary of Maximum Pool Levels for U.S. Army Corps of Engineers Flood-Control Dams

![]() U.S. Department of the Interior |
U.S. Geological Survey
U.S. Department of the Interior |
U.S. Geological Survey
[an error occurred while processing this directive]
URL: http://pubsdata.usgs.gov
Page Contact Information: Contact USGS
Page Last Modified: Thursday, 10-Jan-2013 19:31:50 EST
