Scientific Investigations Report 2009–5178
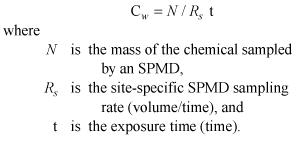
Study MethodsField SamplingAt each of the three sites, POCIS and SPMDs were deployed in triplicate on September 11, 2007. Each sample set included 6 POCIS and 3 SPMDs. A triplicate sample set therefore consisted of 18 POCIS and 9 SPMDs. During the deployment and retrieval of samplers at each site, duplicate sets of field-blank samplers were exposed to the atmosphere to quantify sample contamination resulting from handling and exposure to the atmosphere. The AQUASENSE–P POCIS and standard-configuration SPMDs used in this study were purchased from Environmental Sampling Technologies, Inc. (EST; St. Joseph, Missouri, http://www.est-lab.com/index.php). Two of the three SPMDs from each individual sample set and SPMDs from one of the field-blank sets for each site were fortified with performance reference compounds (PRCs; Huckins and others, 2006) during construction using a solution provided by U.S. Geological Survey’s Columbia Environmental Research Center (CERC; Columbia, Missouri). The PRCs included the polychlorinated biphenyl (PCB) congeners PCB-14 and PCB-50, spiked at rates of 6.53 and 7.93 ng/SPMD, respectively, and the perdeuterated polycyclic aromatic hydrocarbons phenanthrene-d10 and pyrene-d10, spiked at rates of 457 and 524 ng/SPMD, respectively. Huckins and others (2002) provide a discussion of the theory and application of PRCs. POCIS and SPMDs for deployment were premounted on deployment racks by the manufacturer (EST; St. Joseph, Missouri) and shipped under argon in sealed metal cans. POCIS and SPMDs were received 3 days prior to deployment and were refrigerated and then transported to the field on ice. In the field, POCIS and SPMDs were deployed in standard manufactured deployment canisters (EST; St. Joseph, Missouri). At the EWEB drinking-water treatment plant, samplers were deployed inside a flowthrough chamber that received water directly from the plant’s intake stream, prior to treatment. The chamber measured 6 ft in the direction of water flow by 1.5 ft in width by 2.0 ft in depth and was constructed of acrylic. Outflow from the chamber drained to the sewage system. At the Cedar Creek site (Cedar Creek at Saunders Road), samplers were suspended from a foot bridge on cables fitted with anchors. At the Camp Creek site (Camp Creek at Camp Creek Road Bridge), samplers were secured to metal fence posts driven into the streambed. At both stream sites, samplers were placed in the main flow channel. One goal of this deployment was to capture water-quality information during a typical, early autumn storm-runoff period. The use of triplicate samplers and two field blanks at each site allowed for replication and allowed the option of staged retrieval. For example, if a significant rainfall event had occurred early in the deployment period, a subset of samplers could have been retrieved just after the rainfall event and the remainder left in place for the full 35-day deployment period. Alternately, one set of samplers may have been left in place for later retrieval if a significant rainfall event had not occurred during the 35-day deployment period. A moderate rainfall event occurred during the 35-day deployment period and a staged retrieval was not necessary. During deployments, water-temperature sensors (Onset Computer Corp., Pocasset, Massachusetts) were attached to deployment canisters, and water temperature was recorded at 10-min intervals over the entire deployment period to provide evidence that the canisters had remained submerged during the entire deployment period. After the 35-day deployment period, POCIS and SPMDs were retrieved from the three sites on October 16, 2007, and shipped on ice to the laboratory at CERC for processing and analyses. At the laboratory, POCIS and SPMDs were stored at less than –20ºC until processing began. Laboratory Processing and Chemical AnalysesBecause a staged retrieval was not necessary, only two of the three sets of samplers (referred to as A and B in tables) from each site were processed. The third set was archived by storing the passive samplers in the original shipping containers at less than -20ºC. Sequestered compounds were extracted from each POCIS and SPMD individually before designating extracts for specific processing and analysis procedures. Analyses for select agricultural pesticides and wastewater-indicator contaminants were performed on POCIS extracts along with screening for the total estrogenicity of sampled chemicals by the yeast estrogen screen (YES; Rastall and others, 2004; Alvarez and others, 2008a). SPMDs were processed and analyzed for polycyclic aromatic hydrocarbons (PAHs), chlorinated pesticides, total polychlorinated biphenyls (PCBs), the polybrominated diphenyl ether (PBDE) congeners 28, 47, 99, 100, and 153, and select wastewater-indicator chemicals. The POCIS samples were prepared for analysis using published procedures (Alvarez and others, 2004, 2008a, 2008b). Chemicals of interest were recovered from the POCIS sorbent using 40 mL of methanol, with the exception of two POCIS from each deployment canister that were designated for wastewater-indicator chemical analysis. These two POCIS were extracted using 25 mL of an 80:20 volume-to-volume ratio of dichloromethane-to-methyl-tert-butyl ether solution. The liquid volume of each extract was reduced by rotary evaporation and filtered through 0.45 µm filter cartridges. From each deployment canister, the extracts from the two POCIS were composited into a single sample, thereby increasing the amount of chemical present in each sample to aid in detection. This resulted in separate 2-POCIS composite samples from each deployment canister for the agricultural pesticides, wastewater-indicator chemicals, and the YES assay. The procedures used for preparing SPMD samples for analysis were similar to previously published approaches (Petty and others, 2000; Alvarez and others, 2008a, 2008b). Briefly, the target analytes were recovered from the SPMDs by dialysis with hexane, followed by class-specific cleanup and analysis. One of the PRC-spiked SPMDs from each deployment canister was used for the analysis of PAHs; the other was used for chlorinated pesticide and total PCB measurements. The remaining SPMD from each deployment canister, which did not contain PRCs, was used for the analysis of wastewater-indicator chemicals. Agricultural PesticidesDetails for the processing and analysis of POCIS for agricultural pesticides are reported by Alvarez and others (2008a). Briefly, the extracts were fractionated using size exclusion chromatography (SEC), followed by sample cleanup and enrichment by Florisil adsorption chromatography. Analysis was performed using an Agilent 6890 gas chromatograph (GC; Agilent Technologies, Inc., Wilmington, Delaware) coupled to a 5973N mass selective detector (MSD, Agilent Technologies, Inc., Palo Alto, California) with a HP–5MS [30 m × 0.25 mm inner diameter × 0.25 µm film thickness) capillary column (Agilent Technologies, Inc., Wilmington, Delaware). Instrumental parameters are described by Alvarez and others (2008a). Wastewater-Indicator ChemicalsAnalysis of wastewater-indicator chemicals was performed on raw POCIS extracts to maintain the integrity of such a diverse set of chemicals. SPMD dialysates required additional cleanup using SEC prior to analysis to remove matrix interferences such as co-extracted lipids and polyethylene waxes. Analyses were performed on the GC/MSD system previously described using a temperature program of injecting at 40°C, holding for 3 min, ramping up at 9°C/min to 320°C, and holding at 320°C for 3 min. Identification of the targeted chemicals was performed using full-scan mass spectrometry, and quantification was performed by selecting ions unique to each chemical. (Results of wastewater-indicator chemical analyses are presented here for POCIS extracts only. Results from SPMD extracts are available at http://or.water.usgs.gov/proj/EWEB/ww_spmd.pdf, accessed March 5, 2009.) Yeast Estrogen ScreenThe YES assay uses recombinant yeast cells transfected with the human estrogen receptor. Upon binding these cells to an estrogen or estrogen-mimicking chemical, a cascade of biochemical reactions occurs resulting in a color change that can be measured spectrophotometrically (Routledge and Sumpter, 1996; Rastall and others, 2004). POCIS extracts from each site were screened for total estrogenicity in conjunction with a series of negative (solvent) and positive (17β-estradiol) controls (Rastall and others, 2004; Alvarez and others, 2008a). Estradiol equivalent factors (EEQ) for the samples were calculated to provide a relative measure of estrogenicity. The EEQ is an estimate of the amount of 17β-estradiol, a common natural hormone, that would be required to give a response equivalent to that of the complex mixture of chemicals sampled at each site. The measured responses were estimated at an effective concentration dose of 10 percent (EC10); the weak response due to the estrogenicity of sampled chemicals made estimates at a greater dose impossible. Polycyclic Aromatic HydrocarbonsFollowing SEC, samples designated for PRCs and PAHs were processed using a tri-adsorbent column consisting of phosphoric acid silica gel, potassium hydroxide impregnated silica gel, and silica gel (Petty and others, 2000). The GC analyses for selected PAHs and PRCs were performed using the GC/MSD system previously described with the instrumental conditions as reported by Alvarez and others (2008a). Chlorinated Pesticides, Polychlorinated Biphenyls, and Polybrominated Diphenyl EthersSPMD extracts used for the analysis of chlorinated pesticides, PCBs, and PBDEs were further enriched after SEC using a Florisil column followed by fractionation on silica gel (Petty and others, 2000). The first silica-gel fraction (SG1) contained greater than 95 percent of the total PCBs, hexachlorobenzene, heptachlor, mirex, and 40–80 percent of the p,p’-DDE when present in extracts. The second silica-gel fraction (SG2) contained the remaining 28 targeted chlorinated pesticides, less than 5 percent of the total PCBs (largely mono- and dichlorobiphenyl congeners), and the five PBDE congeners. Analysis of the silica-gel fractions were performed using a Hewlett Packard 5890 series GC equipped with an electron capture detector (ECD, Hewlett Packard, Inc., Palo Alto, California) and a DB-35MS (30 m × 0.25 mm inside diameter × 0.25 µm film thickness) capillary column (J&W Scientific, Folsom, California). Instrumental conditions for the analyses are reported in Alvarez and others (2008a). Quality ControlThroughout the passive-sampler processing and procedural steps, a rigorous quality-control plan was used to ensure the reliability of the data obtained. In addition to the field-blank samplers, SPMD fabrication blanks were processed and analyzed to determine the presence of any contamination of the sampler matrix during construction in the laboratory and handling in the field. Matrix (fabrication and field) blanks for the passive samplers were processed and analyzed concurrently with the field deployed samplers. Laboratory controls—such as reagent blanks, matrix blanks, surrogate recovery, and fortified matrix recovery checks—were included in the construction, deployment, and processing of the study samples. Instrument verification checks, reference standards, and positive and negative controls for the YES assay were used throughout the study. Detailed discussions on the benefits of each type of quality-control sample are reported in Huckins and others (2006) and Alvarez and others (2007). Method detection limits (MDLs) and method quantification limits (MQLs) were estimated from low-level calibration standards as determined by the signal-to-noise ratio of the response from the instrumental analyses (Keith, 1991). The MDLs were determined as the mean plus three standard deviations of the response of a coincident peak present during instrumental analyses of laboratory and matrix blanks. The MQLs were determined as the greater of either the coincident peak mean from the analysis of laboratory and matrix blanks plus 10 standard deviations, or the concentration of the lowest-level calibration standard. In cases where no coincident peak was present, the MQL was set at the lowest-level calibration standard and the MDL was estimated to be 20 percent of the MQL. For reporting purposes, the MDLs and MQLs were expressed as the mass of chemical sequestered by a single sampler (ng/POCIS or ng/SPMD). Throughout the passive-sampler processing and analysis steps, matrix spikes, and instrumental verification checks were used to monitor analyte recovery and chemical background contamination. Isotopically labeled surrogates of model compounds were used to allow for a rapid determination of results. A freshly prepared SPMD was fortified with 14C-labeled phenanthrene (a common PAH) and processed concurrently with the remainder of the study SPMDs. A measured recovery following SEC cleanup of the 14C-labeled phenanthrene of 87 percent (5.7 percent relative standard deviation, n=2) indicated acceptable performance of the dialysis and SEC processing steps. Recovery of chemicals processed by the SEC system were monitored using 14C-labeled phenanthrene and averaged 93 percent with 1.3 percent relative standard deviation (n=6). Surrogate spikes of many of the targeted chemicals were added to blank SPMDs and POCIS, in triplicate, which were then processed and analyzed concurrently with the field samples. Recoveries for most of the chemicals were within acceptable ranges and differences between replicates generally were less than 20 percent. Estimation of Water ConcentrationsThe dissolved aquatic concentrations of analytes were estimated from SPMD concentrations using sampling rates and models provided by Huckins and others (2006) and site-specific exposure adjustment factors (EAFs) calculated from PRC data (Huckins and others, 2006; McCarthy, 2006, 2008). Uptake of hydrophobic chemicals into SPMDs follows linear, curvilinear, and equilibrium phases of sampling (Huckins and others, 2006). Integrative (or linear) sampling is the predominant phase for compounds with log Kow values greater than or equal to 5.0 and exposure periods of up to 1 month. During the linear-uptake phase the ambient chemical concentration (Cw) is determined by:
A key feature of the EAF is that it is relatively constant for all chemicals that have the same rate-limiting barrier to uptake, allowing PRC data to be applied to a range of chemicals. Previous data indicate that many chemicals of interest remain in the linear phase of sampling for at least 56 days (Alvarez and others, 2004, 2007); therefore, equation 1 was used to calculate estimates of dissolved aquatic concentrations. |
For additional information contact: Part or all of this report is presented in Portable Document Format (PDF); the latest version of Adobe Reader or similar software is required to view it. Download the latest version of Adobe Reader, free of charge. |

![]() U.S. Department of the Interior | U.S. Geological Survey
U.S. Department of the Interior | U.S. Geological Survey
URL: http://
pubsdata.usgs.gov
/pubs/sir/2009/5178/section4.html
Page Contact Information: Contact USGS
Page Last Modified:
Thursday, 10-Jan-2013 19:34:29 EST

 (1)
(1)