Scientific Investigations Report 2009–5221
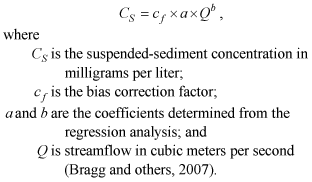
Methods of Data Collection and AnalysisDuring water years 2006 and 2007, suspended-sediment samples were collected from the river over a range of flows either as depth-integrated samples, grab samples, or pumped samples. Depth-integrated samples were collected across the river channel using the Equal Discharge Increment (EDI) method as outlined by Edwards and Glysson (1999). Grab samples were collected at the edge of the river when conditions did not allow for safe depth-integrated measurements. Pumped samples were collected with an automated pump sampler installed on the downstream right bank at the McDonald Bridge gaging station (12045500). For all methods of collection, water samples were analyzed to determine suspended-sediment concentration, reported in milligrams per liter and, when possible, the percent mass of sediment greater than 0.0625 mm in size was reported as the sand fraction. All suspended-sediment sample analyses were performed by the USGS Cascades Volcano Observatory sediment laboratory in Vancouver, Washington. Both USGS gaging stations in the Elwha River basin provided a record of streamflow during the 2006–07 study. Real-time and historical streamflow information for the gaging stations Elwha River above Lake Mills (12044900), and Elwha River at McDonald Bridge (12045500) are available from the USGS National Water Information System website (http://waterdata.usgs.gov/wa/nwis). Elwha River above Lake Mills (12044900)The gaging station upstream of Lake Mills is installed in a bedrock-confined reach 400 m upstream of Lake Mills and 4.3 km upstream of the Glines Canyon Dam at RK 25.7 (fig. 1). The gage measures streamflow that drains an area covering 513 km2 or 62 percent of the total area of the Elwha River basin. Because this gaging station is upstream of both dams, streamflow and sediment data measured at the site are representative of the natural flow regime and provide an important reference for comparison with data collected in the altered reaches downstream of the dams. A daily record of streamflow at this gaging station is available from March 1994 through May 1998, and from February 2004 through September 2008. In 2004, a motorized bank-operated cableway was installed and used for measuring streamflow and collecting suspended-sediment samples (fig. 2). Suspended-Sediment Sample CollectionDuring water years 2006 and 2007, the EDI method was used to collect depth-integrated suspended-sediment samples along a cross section, with sample locations determined by a preceding measurement of streamflow. Depth-integrated samples were collected using a D-74 suspended-sediment sampler and pint-sized glass bottles in accordance with USGS sediment data-collection protocol (Edwards and Glysson, 1999). Measurements of suspended-sediment concentration were made over a range of flows throughout the study period and the data were used with previous measurements to develop a regression model expressing the relation between suspended-sediment concentration and streamflow. Measurements of suspended-sediment concentration were made during water years 1995–98 at the gaging station upstream of Lake Mills and used the Equal Width Increment (EWI) method to collect depth-integrated samples (Edwards and Glysson, 1999). These measurements subsequently were used with samples collected from an automated pump sampler at this site to calculate daily, monthly, and annual suspended-sediment loads for water years 1995–97 (Wiggins and others, 1995, 1996, and 1997). Regression AnalysisFor the regression model, concentration and discharge values were transformed to base-10 logarithmic values, and an ordinary least-squares (OLS) regression was computed. Re-expressing estimates from a log-regression equation into original units can result in a low bias (Helsel and Hirsch, 1992), so a correction factor determined from the mean of the re-transformed residuals expressed in original units was applied to all estimates of suspended-sediment concentration. The resulting regression model expressed as a power equation and corrected for bias takes the form:
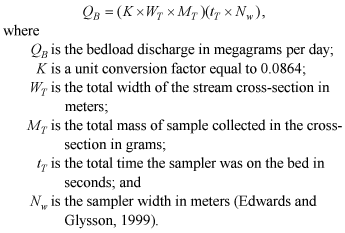
The regression model was used to determine hourly estimates of suspended-sediment concentration based on the corresponding hourly streamflow record of the gaging station. These hourly estimates of suspended-sediment concentration then were used in the Graphical Constituent Loading Analysis Software (GCLAS; Koltun and others, 2006) with the continuous record of streamflow at the gaging station to estimate monthly and annual sediment loads. Bedload Sample CollectionBedload is defined as fluvial sediment that moves by sliding, rolling, or bouncing along on the streambed (Edwards and Glysson, 1999). Following the Lake Mills drawdown study in 1994 (Childers and others, 1999), the USGS continued to collect bedload measurements in anticipation of the imminent removal of the Glines Canyon and Elwha Dams. From November 1994 to October 1997, measurements were made over a range of flows using the EWI method. Measurements of bedload discharge were made using the sampling device, the “Elwha sampler,” that was designed and used for the Lake Mills drawdown study (Childers and others, 1999). The Elwha sampler has a 10.2 × 20.3-cm intake nozzle with an expansion ratio of 1.40. The sampler generally was used from a boat, although a modified hand-held version was used at low flows when the channel could be waded. To obtain a bedload sample, the sampler was placed on the channel bed for a specified period, usually 30 seconds with the intake facing upstream. After 30 seconds, the sampler was raised and emptied of sediment. Thirteen bedload samples generally were collected at evenly spaced stations along the cross section. Samples collected at each cross section were composited prior to analysis. All bedload samples were analyzed for dry weight and grain-size distribution by the USGS Cascades Volcano Observatory sediment laboratory in Vancouver, Washington. Bedload discharges were calculated from the measurements using this equation:
Elwha River at McDonald Bridge (12045500)The gaging station at McDonald Bridge, at RK 13.9, is installed in a bedrock-confined reach 1.7 km upstream of Lake Aldwell and 7.7 km downstream of the Glines Canyon Dam at RK 13.9 (fig. 3). The gage measures streamflow that drains an area covering 697 km2 or 84 percent of the total area of the Elwha River basin. The gaging station has a streamflow record that spans more than a century, from October 1897 to December 1901 and from October 1918 to the present (2007). The Glines Canyon Dam is operated by the Bureau of Reclamation as “run-of-the-river,” a water-management strategy that attempts to minimize regulation and maintain natural flows (Kevin Yancy, Bureau of Reclamation, written commun., 2007). An automatic pump sampler was installed at this gaging station and operated from October to July, the primary months of sediment transport, during water years 2006 and 2007. The automatic sampler collected daily water samples by pumping water from an intake that extended into the river. The sampling frequency was adjusted to 4-hour intervals during a single large flood event on November 6–7, 2006. Because samples collected with a pump sampler may not have been representative of the entire cross section, samples also were collected manually from the cableway using the EDI sampling method. Depth-integrated samples were collected along the cross section using a D-74 suspended-sediment sampler with pint-sized glass bottles. Sediment concentrations determined from the manually-collected samples were used to correct any bias associated with the location of the intake of the automatic pump sampler. Daily, monthly, and annual suspended-sediment loads were calculated using GCLAS based on the continuous record of streamflow and sediment concentrations determined from the automatic pump sampler and manual sampling methods. |
For additional information contact: Part or all of this report is presented in Portable Document Format (PDF); the latest version of Adobe Reader or similar software is required to view it. Download the latest version of Adobe Reader, free of charge. |

![]() U.S. Department of the Interior | U.S. Geological Survey
U.S. Department of the Interior | U.S. Geological Survey
URL: http://
pubsdata.usgs.gov
/pubs/sir/2009/5221/section3.html
Page Contact Information: Contact USGS
Page Last Modified:
Thursday, 10-Jan-2013 19:39:39 EST

 (1)
(1) (2)
(2)