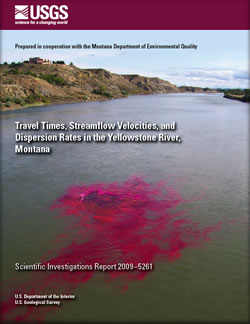
Scientific-Investigations Report 2009–5261
Abstract
The Yellowstone River is a vital natural resource to the residents of southeastern Montana and is a primary source of water for irrigation and recreation and the primary source of municipal water for several cities. The Yellowstone River valley is the primary east–west transportation corridor through southern Montana. This complex of infrastructure makes the Yellowstone River especially vulnerable to accidental spills from various sources such as tanker cars and trucks. In 2008, the U.S. Geological Survey (USGS), in cooperation with the Montana Department of Environmental Quality, initiated a dye-tracer study to determine instream travel times, streamflow velocities, and dispersion rates for the Yellowstone River from Lockwood to Glendive, Montana. The purpose of this report is to describe the results of this study and summarize data collected at each of the measurement sites between Lockwood and Glendive. This report also compares the results of this study to estimated travel times from a transport model developed by the USGS for a previous study. For this study, Rhodamine WT dye was injected at four locations in late September and early October 2008 during reasonably steady streamflow conditions. Streamflows ranged from 3,490 to 3,770 cubic feet per second upstream from the confluence of the Bighorn River and ranged from 6,520 to 7,570 cubic feet per second downstream from the confluence of the Bighorn River. Mean velocities were calculated for each subreach between measurement sites for the leading edge, peak concentration, centroid, and trailing edge at 10 percent of the peak concentration. Calculated velocities for the centroid of the dye plume for subreaches that were completely laterally mixed ranged from 1.83 to 3.18 ft/s within the study reach from Lockwood Bridge to Glendive Bridge. The mean of the completely mixed centroid velocity for the entire study reach, excluding the subreach between Forsyth Bridge and Cartersville Dam, was 2.80 ft/s. Longitudinal dispersion rates of the dye plume for this study ranged from 0.06 ft/s for the subreach upstream from Forsyth Bridge to 2.25 ft/s for the subreach upstream from Calyspo Bridge for subreaches where the dye was completely laterally mixed. A relation was determined between travel time of the peak concentration and time for the dye plume to pass a site (duration). This relation can be used to estimate when the receding concentration of a potential contaminant reaches 10 percent of its peak concentration for accidental spills into the Yellowstone River. Data from this dye-tracer study were used to evaluate velocity and concentration estimates from a transport model developed as part of an earlier USGS study. Comparison of the estimated and calculated velocities for the study reach indicate that the transport model estimates the velocities of the Yellowstone River between Huntley Bridge and Glendive Bridge with reasonable accuracy. Velocities of the peak concentration of the dye plume calculated for this study averaged 10 percent faster than the most probable velocities and averaged 12 percent slower than the maximum probable velocities estimated from the transport model. Peak Rhodamine WT dye concentrations were consistently lower than the transport model estimates except for the most upstream subreach of each dye injection. The most upstream subreach of each dye injection is expected to have a higher concentration because of incomplete lateral mixing. Lower measured peak concentrations for all other sites were expected because Rhodamine WT dye deteriorates when exposed to sunlight and will sorb onto the streambanks and stream bottom. Velocity-streamflow relations developed by using routine streamflow measurements at USGS gaging stations and the transport model can be used to estimate mean streamflow velocities throughout a range of streamflows. The variation in these velocity-streamflow relations emphasizes the uncertainty in estimating the mean streamflow velocity for streamflows outside of the streamflows measured in this study. |
First posted January 7, 2010
For additional information contact: Part or all of this report is presented in Portable Document Format (PDF); the latest version of Adobe Reader or similar software is required to view it. Download the latest version of Adobe Reader, free of charge. |
McCarthy, P.M., 2009, Travel times, streamflow velocities, and dispersion rates in the Yellowstone River, Montana: U.S. Geological Survey Scientific Investigations Report 2009–5261, 25 p.
Abstract
Introduction
Methods for Determining Travel Times, Streamflow Velocities, and Dispersion Rates
Travel Times, Streamflow Velocities, and Dispersion Rates in the Yellowstone River
Summary and Conclusions
Selected References
Appendixes