Scientific Investigations Report 2012–5231
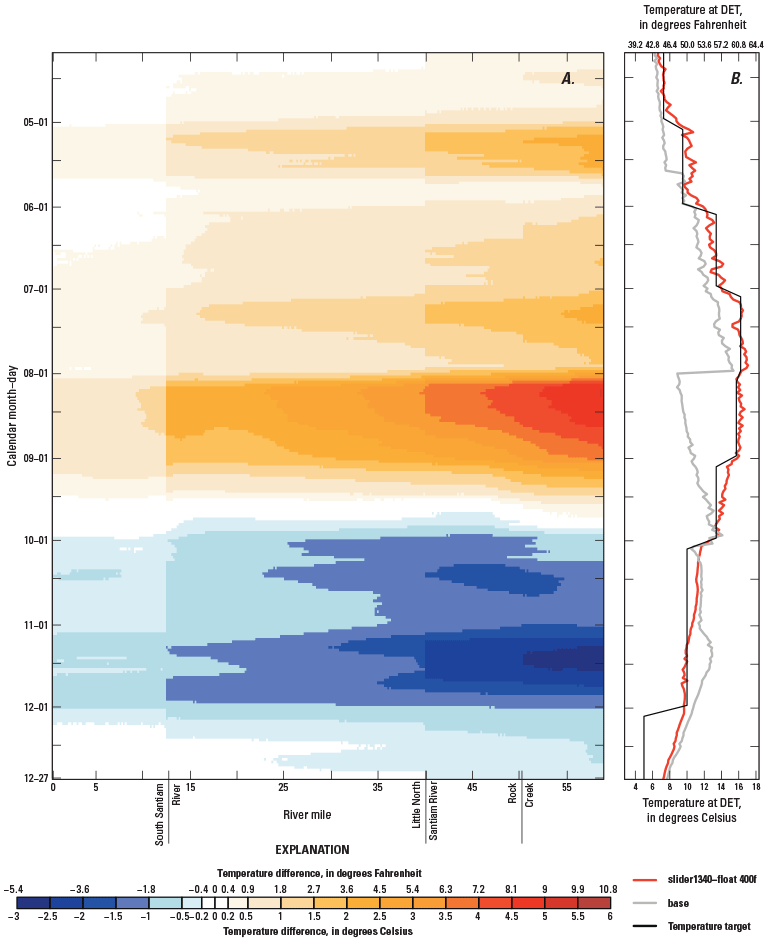
Figure 33. (A) Difference between the 7-day moving average of the daily maximum water temperature from the North Santiam and Santiam River model scenarios h19 (slider1340-float structures, 400f operations, and hot/dry conditions) and h1 (existing structures and base operations). Positive numbers indicate warming in the h19 scenario relative to the h1 scenario; a white color indicates an absolute change of less than 0.2°C. (B) Comparison of the max temperature target and simulated outflow temperatures at Detroit Dam from scenarios h19 (labeled “slider1340-float _400f”) and h1 (labeled “base”). |
First posted October 30, 2012 For additional information contact: Part or all of this report is presented in Portable Document Format (PDF); the latest version of Adobe Reader or similar software is required to view it. Download the latest version of Adobe Reader, free of charge. |

![]() U.S. Department of the Interior |
U.S. Geological Survey
U.S. Department of the Interior |
U.S. Geological Survey
URL: http://pubsdata.usgs.gov/pubs/sir/2012/5231/figure33.html
Page Contact Information: GS Pubs Web Contact
Page Last Modified: Tuesday, 11-Jun-2013 17:19:13 EDT
