Skip Links
Scientific Investigations Report 2014–5061
Prepared in cooperation with the West Virginia Department of Environmental Protection Division of Water and Waste Management, Water Use Section
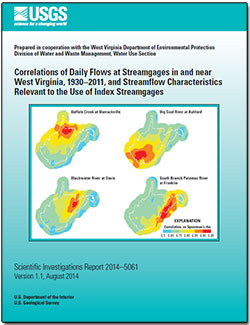
Correlations of Daily Flows at Streamgages in and near West Virginia, 1930–2011, and Streamflow Characteristics Relevant to the Use of Index Streamgages
By Terence Messinger and Katherine S. Paybins
 Abstract Abstract
Correlation of flows at pairs of streamgages were evaluated using a Spearman’s rho correlation coefficient to better identify gages that can be used as index gages to estimate daily flow at ungaged stream sites in West Virginia. Much of West Virginia (77 percent) is within areas where Spearman’s rho for daily streamflow between streamgages on unregulated streams (unregulated streamgages) is greater than 0.9; most withdrawals from ungaged streams for shale gas well hydraulic fracturing are being made in these areas. Most of West Virginia (>99 percent) is within zones where Spearman’s rho between streamgages on unregulated streams is greater than 0.85. Withdrawals for hydraulic fracturing are made from ungaged streams in areas where Spearman’s rho between streamgages on unregulated streams is less than 0.9, but because spatial correlation is partly a function of the density of the streamgaging network, adding or reactivating several streamgages would be likely to result in correlations of 0.90 or higher in these areas.
Seasonal differences in the strength and spatial extent of correlations of daily streamflows are great. The strongest correlations among streamgages are for fall, followed by spring, then winter. One possible explanation for the weak correlations for summer may be that precipitation and runoff associated with convective storms affect one basin and miss nearby basins. A comparison of correlation patterns during previously identified climatic periods shows that the strongest correlations occurred during 1963–69, a period of drought, and the weakest during 1970–79, a wet period. The apparent effect of frequent rain during 1970–79 overshadowed streamgage-network density, which was at its historic maximum in West Virginia at that time, so that the extent of areas with high correlation to at least one streamgage was smaller during 1970–79 than during 1963–69. Correlations for 1992 to 2011 were slightly weaker than those for 1963 to 1969.
The relation between correlation and distance between basin centroids was determined to be stronger for streamgage pairs in the Ohio River Basin than for pairs in the Atlantic Slope River Basins, which in turn was stronger than the relation between pairs of streamgages split between the two major basins. Quantile regression equations were developed for these three comparisons to estimate the Spearman’s rho correlation coefficient for streamgage pairs using distance between basin centroids as a predictor variable. The equations can be used for streamgage network planning. For the Ohio River Basin, the distance between basin centroids at which 50 percent of streamgage pairs would exceed a Spearman’s rho of 0.95 is 9 miles. The distance between basin centroids at which 50 percent of streamgage pairs would exceed a Spearman’s rho of 0.90 is 25 miles, and the distance at which 50 percent of streamgage pairs would exceed a Spearman’s rho of 0.85 is 48 miles. For the Atlantic Slope River Basins, the distance between basin centroids at which 50 percent of streamgage pairs would exceed a Spearman’s rho of 0.95 is 1 mile. The distance between basin centroids at which 50 percent of streamgage pairs would exceed a Spearman’s rho of 0.90 is 13 miles, and the distance at which 50 percent of streamgage pairs would exceed a Spearman’s rho of 0.85 is 41 miles. For pairs of streamgages split between the two major basins, the regression equation gives a value of 0.84 for the correlation coefficient at zero miles. On maps of correlations, the shape of strongly correlated areas for streamgages in the Ohio River Basin is generally round. In the Valley and Ridge Physiographic Province, which generally coincides with the Atlantic Slope River Basins within the study area, areas strongly correlated with streamgages generally coincide with major valleys.
|
Part or all of this report is presented in Portable Document Format (PDF). For best results viewing and printing PDF documents, it is recommended that you download the documents to your computer and open them with Adobe Reader. PDF documents opened from your browser may not display or print as intended. Download the latest version of Adobe Reader, free of charge. More information about viewing, downloading, and printing report files can be found here.
Part of this report is presented in Microsoft Excel format (XLSX); the latest version of Excel Viewer is required to view it. Download the latest version of Excel Viewer, free of charge.
|
Suggested citation:
Messinger, Terence, and Paybins, K.S., 2014, Correlations of daily flows at streamgages in and near West Virginia, 1930–2011, and streamflow characteristics relevant to the use of index streamgages (ver. 1.1, August 2014): U.S. Geological Survey Scientific Investigations Report 2014–5061, 83 p., http://dx.doi.org/10.3133/sir20145061.
ISSN 2328-031X (print)
ISSN 2328-0328 (online)
Contents
Abstract
Introduction
The Streamgaging Network in West Virginia
Streamflow and Basin Characteristics Relevant to the Use of Index Streamgages
Correlation of Daily Flows at Streamgages
Limitations of the Study
Summary and Conclusions
References Cited
Appendix 1. Flow correlation at all unregulated streamgages for full years, 1930–2011
Appendix 2. Flow correlation at all unregulated streamgages for fall months only, 1930–2011
Appendix 3. Flow correlation at all unregulated streamgages for winter months only, 1930–2011
Appendix 4. Flow correlation at all unregulated streamgages for spring months only, 1930–2011
Appendix 5. Flow correlation at all unregulated streamgages for summer months only, 1930–2011
Appendix 6. Flow correlation at all unregulated streamgages for full years, 1963–1969
Appendix 7. Flow correlation at all unregulated streamgages for full years, 1970–1979
Appendix 8. Flow correlation at all unregulated streamgages for full years, 1992–2011

