
By Kathy Muller Ogle and Laura L. Hallberg
Prepared in cooperation with the
CHEYENNE BOARD OF PUBLIC UTILITIES
Contents
|
 |
The Ogallala aquifer and the underlying White River aquifer are important ground-water resources of public and private drinking water in the Cheyenne, Wyoming area. In 1997, as part of a cooperative project between the Cheyenne Board of Public Utilities and the U.S. Geological Survey, a well was installed to develop information for those two aquifers. Information provided for the Ogallala aquifer included core descriptions, geophysical logs, water levels, aquifer transmissivity, water quality, isotopic analysis, and geochemical modeling. Information for the White River aquifer was limited to core descriptions and geophysical logs.
Evaluation of the core obtained from the drill hole showed the sediments to be primarily sands, silts, and clays. The thickness of the Ogallala Formation at the well site was estimated to be 246 feet. Water levels and precipitation from October 1, 1998 to September 30, 1999 indicated that water levels responded to precipitation. During that time, water levels ranged from 6,002.41 feet to 6,004.27 feet above mean sea level. The transmissivity was estimated to be 1.1 feet squared/day. The temperature differences between the municipal water and the Ogallala aquifer water were examined in relation to selected hydraulic conductivities and it was found that the warmer municipal water would slightly increase the hydraulic conductivity if the water were injected into the Ogallala aquifer.
The water quality of a sample from the Ogallala #1 well indicated the predominant major ions were calcium, magnesium, and bicarbonate. Isotopic analyses of hydrogen-2, tritium, chlorine-36, carbon-14, and carbon-13 indicated the water was a mixture of pre- and post-1953 recharge. A simple geochemical mixing model indicated there was the potential for dissolution of anhydrite, calcite, gypsum, and dolomite and precipitation of goethite, hematite, pyrolusite, and amorphous ferric hydroxide if municipal and Ogallala aquifer waters were mixed.
The High Plains aquifer system, which extends from Texas to South Dakota, is an extensive and economically important aquifer that supplies water to agricultural, municipal and industrial users in eight states. Approximately 30 percent of the ground water used for irrigation in the United States is withdrawn from the High Plains aquifer (Weeks and others, 1988). In southeastern Wyoming, three geologic units are included in the High Plains aquifer: the Ogallala Formation (Miocene), the Arikaree Group (Miocene and Oligocene) and the White River Group (Oligocene). The High Plains aquifer has been extensively studied. Weeks and others (1988), Luckey and others (1981), Cooley and Crist (1994), and Lowry and Crist (1967) described various aspects of the High Plains aquifer system related to the Cheyenne, Wyoming area.
In the Cheyenne area, the Ogallala Formation and the White River Group are present, but the Arikaree Group is absent. The Ogallala Formation crops out and is locally called the Ogallala aquifer, a convention followed in this report. The underlying White River Group is also an aquifer and, by the same convention, is referred to as the White River aquifer in this report. These aquifers provide about 25 percent of the public water supply for Cheyenne. The aquifers also provide public water supplies to other communities in Laramie County. They are used extensively as private water supplies for rural subdivisions and ranches in the area. The Cheyenne Board of Public Utilities (BOPU) was interested in obtaining new information on the availability of ground water from the Ogallala and White River aquifers and on the feasibility of injecting municipal water into the aquifers for short-term storage. The U.S. Geological Survey (USGS) was interested in collecting additional data to advance the scientific knowledge of the aquifer system. To gain this information, a cooperative study between BOPU and the USGS was undertaken. This study involved installing an observation well in the Ogallala and White River aquifers, and determining selected geohydrologic and geochemical properties of the aquifers at that site.
The support of Jim Van Dorn, Herman Noe, and Tim Wilson of BOPU is gratefully acknowledged. Jerry Mark and Jack Carroccia were instrumental in initiating the study. Robert Gregory and Alan J. VerPloeg (Wyoming State Geological Survey) offered helpful advice during core examination. Without the support of Stanley N. Davis (University of Arizona) and DeWayne Cecil (USGS) chlorine-36, carbon-13, and carbon-14 analysis and interpretation would not have been possible. The advice of David Parkhurst on the geochemical modeling was most helpful.
| This report describes selected geohydrologic and geochemical properties associated with a single observation well drilled into the Ogallala and White River aquifers. The well is located close to the Prairie View Golf Course in Cheyenne (fig. 1). The borehole was drilled to a depth of 380 feet. Geological core descriptions, geophysical logs, water levels, water quality analysis, isotopic analysis, and geochemical modeling were completed for the Ogallala aquifer. Analysis for the White River aquifer was limited to geologic core description and geophysical logs. Information gathered as part of this study provides detailed information about the High Plains aquifer from a location where such information is lacking. The information will assist the BOPU in evaluation of water-resource management decisions for developing water supplies from the Ogallala and White River aquifers and for evaluating the potential to inject municipal water for short-term storage into the aquifers. | 
Figure 1. Location of the Ogallala #1
well. |
The site was drilled, cored, and the well installed in July 1997. The borehole was drilled using a hydraulic rotary rig. Core was retrieved using a 2-inch diameter core barrel. Following coring, the borehole was reamed to a diameter of 77/8 inches to a total depth of 380 feet. Long-normal electric, short-normal electric gamma, caliper, and neutron geophysical logs were run on the open hole (fig. 2). The borehole was sealed from 380 to 245 feet with bentonite. The well was then completed (fig. 2). Following completion, the well was developed by pumping and surging for about 12 hours. The lower part of the Ogallala aquifer was selected as the monitoring interval for two reasons. First, it is an important water-yielding zone in the area. Second, by limiting the completion to the Ogallala aquifer, the potential problem of multiple aquifer completion is avoided. Single aquifer completion may be particularly important in the Cheyenne area where the Ogallala aquifer may function as a porous media aquifer while the White River aquifer may function as a dual permeability or fracture flow aquifer (Wyoming Water Development Commission, 1994, 1995, 1998).
The core was preserved following American Society for Testing Materials (1997) methods. The core was described based on examination using a field microscope. Core descriptions (fig. 2) follow the classification of sedimentary rocks based on texture and composition (Travis, 1955). Additional analysis using scanning electron microscopy and X-ray diffraction was completed by the Wyoming State Geological Survey to identify clay type and some elements present in dark minerals that could not be identified visually.
Water levels were measured both by manual taping and with an automated water-level recorder. A 7-hour aquifer test was conducted followed by a 24-hour recovery period to estimated aquifer transmissivity. Water samples were collected September 8, 1998, and February 9, 1999 from a municipal water spigot at the golf course and from the well. Water samples were collected after pumping the well until temperature, specific conductance, pH, and dissolved oxygen stabilized and a minimum of 3 well casing volumes had been pumped from the well. Water samples were collected, filtered, and preserved following standard USGS methods (Fishman and Friedman, 1989) and analyzed, except as noted, by the USGS National Water Quality Laboratory.
 |
Figure 2. Well construction, geophysical logs, and core descriptions of Ogallala #1 well, Cheyenne, Wyoming. (Click on image to see a larger version of this sample (65 kb). The entire figure is available only as a PDF file, 2.66 mb, and measures 14 by 38 inches.) |
The sediments in the core (fig. 2) were primarily sands, silts, and clays. Sands less than 1 millimeter in size made up 59 percent of the core. Silts and clays comprised 36 percent of the core. Sediments larger than 1 millimeter were present in only 5 percent of the core. Sands were primarily silica. The clay mineral type present in the samples was randomly interstratified smectite-chlorite. The elements and compounds present in the dark mineral samples were aluminum, silica, oxygen, and magnesium, with minor amounts of sodium, potassium, calcium, manganese, and iron (R. W. Gregory, Wyoming State Geological Survey, personal commun.). Calcium carbonate cementation was observed consistent with data presented by Denson and Bergendahl (1961).
The occurrence of ash layers was used to identify the break between the Ogallala Formation and the underlying White River Group. This is based on previous work by Cooley and Crist (1981), Gutentag and others (1984), and Gutentag and Weeks (1984). The use of the term ash layer in this report refers to layers that were thought to have originated as ash, but which have undergone clay alteration. At the site of this well, the thickness of the Ogallala Formation was estimated to be about 246 feet.
Geophysical logs reflect the contrasts in lithology (fig. 2). The electrical logs are a measure of the electrical resistance of the sediments. Generally, the clays, silts and silty sands, and silty sandstones had a lower electrical resistance reading while sands, sandstones and gravels had a higher reading. The caliper log is a measure of the size of the borehole. Deviations in the caliper log reflected zones where unconsolidated sands and gravels were washed out by the circulation of the drilling fluid. The gamma log is a measure of the natural gamma radiation from the radioactive elements within the formation. Most of the deviations of the gamma log were not large, although an increase in the gamma reading was generally associated with the clay and ash beds. Within the interval from 365 to 368 feet, the gamma reading exceeded 100 counts per minute and correlated to a series of sand and sandstone beds containing re-worked ash. Neutron logs primarily respond to the amount of hydrogen present in the formation and are principally used to delineate changes in porosity. In general, increased counts per second on the neutron log were related to an increase in sand content or sandstone.
|
Water levels in the well were monitored to assess fluctuations over time. The period from October 1, 1998 to September 30, 1999 was selected for analysis because it represents a period when the water levels had stabilized from previous pumping and sampling (fig. 3). The water levels fluctuated 1.86 feet during that period. The lowest water level measured occurred on April 15, 1999 (6,002.41 feet above mean sea level; 39.03 feet below land surface). The highest water level measured occurred on June 18, 1999 (6,004.27 feet above mean sea level; 37.17 feet below land surface). Water levels were generally lower and more stable during the period from November 1998 until mid-April 1999. The water levels were generally higher and fluctuated more during the period from mid-April, 1999 to the end of September 1999. The water levels fluctuated in response to precipitation. The response of the water levels to the precipitation event appears to vary with precipitation amount and antecedent conditions. Complicating effects of evaporation, barometric pressure, antecedent moisture conditions, and loading due to the weight of the water and entrapped air in the soil horizon may affect the response in addition to recharge from the precipitation. Further investigation into the water-level fluctuation and precipitation relation is beyond the scope of this study, but discussion of some of the potential processes are outlined in Freeze and Cherry (1979) and Walton (1970). |

Figure 3. Precipitation for Cheyenne, Wyoming and water-level elevations in the
Ogallala #1 well, October 1, 1998 through September, 1999. |
| The well was tested to provide an estimate of transmissivity. Because no nearby observation wells were available, a single-well recovery test was completed at the well. The simplifying assumptions included a homogenous, isotropic, and confined aquifer with lateral flow and instantaneous release of water from storage. The natural conditions, such as inter-stratified sands and clays, changes within beds with distance from the well, and potential for delayed yield, deviate from these assumptions; however, the results of the test gave a first-order estimate of the transmissivity of the aquifer in the vicinity of the well. The well was pumped 7 hours and 15 minutes, and recovery was monitored for 48 hours February 19-21, 1999. The transmissivity was estimated (fig. 4) to be 1.1 ft2/day. | 
Figure 4. Theis recovery plot and calculations for February 19-21, 1999 recovery test of the
Ogallala #1 well, Cheyenne, Wyoming. |
| The temperature differences between the municipal water and the Ogallala water (fig. 5) could potentially have an effect on the hydraulic conductivity of an intermittently operated injection well. Changes in water temperature have an effect on the viscosity of water. Water viscosity can affect hydraulic conductivity since hydraulic conductivity is a measure of both fluid and matrix properties. Warmer injection water would slightly increase the hydraulic conductivity, whereas cooler water would slightly decrease the hydraulic conductivity. The effect of temperature on hydraulic conductivity (fig. 5) was examined for typical gravels, sands, and clays that might be encountered in the Ogallala Formation. | 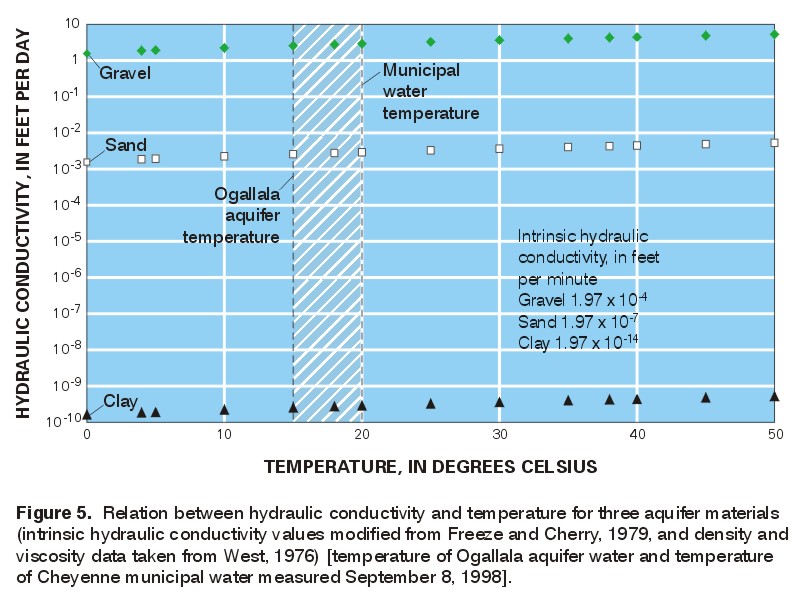
Figure 5. Relation between hydraulic conductivity and temperature for three aquifer materials
(intrinsic hydraulic conductivity values modified from Freeze and Cherry, 1979, and density and
viscosity data taken from West, 1976) [temperature of Ogallala aquifer water and temperature
of Cheyenne municipal water measured September 8, 1998]. |
|
Ground water sampled from the well had a calcium-magnesium bicarbonate type major ion chemistry. Calcium and magnesium were the dominant cations as both were present in similar milliequivalent per liter concentrations (fig. 6). The dominant anion was bicarbonate. Constituents in water from the Ogallala well #1 are shown in table 1. Concentrations of barium, chromium, nitrate, nitrite, and fluoride were below the U.S. Environmental Protection Agency (EPA) maximum contaminant levels (MCL) (U.S.EPA, 1997) established as primary drinking water standards for public water supplies. Concentrations of chloride, copper, dissolved solids, fluoride, iron, sulfate, silver, and zinc were below the EPA secondary maximum contaminant levels (SMCL). The pH of the water was within the range of EPA SMCL. The analytical laboratory-reporting limit for cadmium of less than 8 micrograms per liter (µg/L) was slightly above the EPA MCL of 5 µg/L. Manganese exceeded the EPA SMCL of 50 mg/L. |
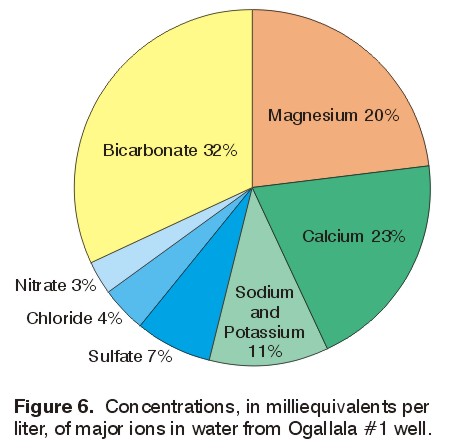
Figure 6. Concentrations, in milliequivalents per liter, of major ions in water from Ogallala #1 well. |
Table 1. Chemical and isotopic water quality from the Cheyenne municipal water system
and the Ogallala #1 well. The municipal water sample was collected from an outside spigot at the
Prairie View Golf Course clubhouse. Samples were collected September 8, 1998 and February 19,
1999.
[* Analysis performed at the University of Arizona Soil, Water, and Plant Analytical Laboratory; ** analysis at PRIME
Lab, Purdue University, *** analysis at Los Alamos National Laboratory; --, no analysis; mg/L, milligrams per liter;
µg/L,
micrograms per liter; 0/00, per mil (parts per thousand); TU, tritium units;
µS/cm, microsiemens per centimeter at 25°C; < followed by a number (i.e.<.01), indicates that the constituent was not detected at the laboratory reporting limit.
The number following the < symbol denotes the reporting limit for that particular analysis.]
| . | Municipal water | Ogallala well #1 water |
|---|---|---|
| Constituent | Concentration | |
| Specific Conductance (field), in µS/cm | 262 | 471 |
| pH, (field) standard units | 7.2 | 7.7 |
| Temperature, in degrees C | 19.5 | 15.3 |
| Oxygen (field), dissolved as O2 in mg/L | 1.8 | 1.7 |
| Calcium, dissolved as Ca in mg/L | 34 | 50 |
| Magnesium, dissolved as Mg in mg/L | 5.4 | 26 |
| Sodium, dissolved as Na in mg/L | 7.3 | 26 |
| Potassium, dissolved as K in mg/L | 2.1 | 3.5 |
| Alkalinity, total as CaCO3 in mg/L | 105 | 174 |
| Carbon Dioxide, dissolved as CO2 in mg/L | 13 | 7.0 |
| Sulfate, dissolved as SO4 in mg/L | 16 | 35 |
| Chloride, dissolved as Cl in mg/L | 5.4 | 17 |
| Fluoride, dissolved as F in mg/L | 0.97 | 0.75 |
| Bromide, dissolved as Br in mg/L*** | -- | 0.189 |
| Silica, dissolved as SiO2 in mg/L | 17 | 18 |
| Dissolved solids, residue at 180°C | 169 | 301 |
| Ammonia, as dissolved NH4, in mg/L | 0.142 | 0.329 |
| Nitrite, as dissolved N, in mg/L | 0.013 | 0.019 |
| Nitrate, as dissolved N in mg/L | 0.562 | 4.18 |
| Nitrite plus Nitrate, as dissolved N, in mg/L | 0.575 | 4.20 |
| Barium, dissolved as Ba in µg/L | 60 | 11 |
| Beryllium, dissolved as Be in µg/L | <1.6 | <1.6 |
| Cadmium, dissolved as Cd in µg/L | <8 | <8 |
| Chromium, as dissolved Cr in µg/L | <1.0 | <1.0 |
| Cobalt, dissolved as Co in µg/L | <7.0 | <7.0 |
| Copper, dissolved as Cu in µg/L | 115 | <10 |
| Iron, dissolved as Fe in µg/L | <10 | 120 |
| Lead, dissolved as Pb in µg/L | <100 | <100 |
| Lithium, dissolved as Li in µg/L | 9 | 16 |
| Manganese, dissolved as Mn in µg/L | <3 | 61 |
| Molybdenum, dissolved as Mo in µg/L | <50 | <50 |
| Nickel, dissolved as Ni in µg/L | <1.0 | 2.9 |
| Silver, dissolved as Ag in µg/L | <1.0 | <1.0 |
| scope="row"Strontium, dissolved as Sr in µg/L | 232 | 570 |
| Vanadium, dissolved as V in µg/L | <10 | <10 |
| Zinc, dissolved as Zn in µg/L | <20 | 222 |
| Cyanide, dissolved as CN in mg/L | <0.01 | <0.01 |
| d2H in 0/00 | -- | -88.8 |
| d18O in 0/00 | -- | -11.31 |
| Cl-36/Cl x 10-15 ** (no units) | -- | 1,210 |
| C-14* percent modern activity | -- | 56.62 |
| dC-13* in 0/00 | -- | -8.590 |
| Tritium, in tritium units | 15.3 ± 1.0 | 7.8 ± 0.5 |
The isotopes of hydrogen, oxygen, chloride, and carbon were examined to determine recharge characteristics of water from the well. Samples were collected for analysis of hydrogen-2, oxygen, and tritium isotopes as part of the USGS sampling of the well. Stan Davis (University of Arizona) and DeWayne Cecil (USGS) sampled the well for chlorine-36, carbon-14, and carbon-13 as part of a project funded by the National Science Foundation.
|
No data on hydrogen and oxygen isotopes in precipitation were available for the Cheyenne, Wyoming area; therefore, the stable isotopes of hydrogen and oxygen in ground water were compared to published values for precipitation to give a perspective on the values reported from this well. Hydrogen-2 (2H) is a heavy isotope of hydrogen containing an extra neutron, and oxygen-18 (18O) is a heavy isotope of oxygen containing two extra neutrons. Isotopic ratios are measured by mass spectrometry and expressed as parts per thousand (per mil) in relation to Vienna Standard Mean Ocean Water (VSMOW). Results are commonly expressed as d2H and d18O, which represents the relative difference in parts per thousand (0/00 ) between the isotopic ratio in the sample and the isotopic ratio in the standard. Craig (1961) developed the global meteoric water line (GMWL) that represents the world-average relation between d2H and d18O for meteoric water (fig.7). Sheppard and others (1969) developed a map of the distribution of d2H and d18O for North America. Secondary fractionation processes such as evaporation, exchange with the aquifer matrix, or recharge that occurred under a different climatic regime cause deviation from the GMWL. |

Figure 7. Hydrogen-2 and oxygen-18 values in Ogallala #1 well as compared to Vienna
Standard Mean Ocean Water (VSMOW), the Global Meteoric Water Line (Craig, 1961), and
meteoric water estimate (Sheppard and others, 1969). |
The values of d2H and d18O for ground water from the well plot close to the GMWL and close to a local meteoric water estimate interpolated from a map in Sheppard and others (1969) (fig. 7). The water from the well plots slightly below the GMWL, but the deviation is probably not large enough to be significant. This indicates that the water is meteoric in origin and has not been significantly affected by evaporation, exchange with the aquifer matrix, or recharge that occurred under a different climatic regime.
Tritium concentrations can be used to differentiate between water that has a recharge component since 1953 and water recharged prior to the 1950's. Tritium (3H) is a heavy isotope of hydrogen that radioactively decays with a half-life of 12.3 years (Drever, 1988). Beta particles, which are given off during the radioactive decay, are measured in the laboratory and the results are commonly reported in tritium units (TU) (Mazor, 1991). Aboveground testing of hydrogen bombs in the period from 1952 through 1969 added a large amount of tritium to the atmosphere, with a peak of nearly 10,000 TU in 1963 (Drever, 1988). A small amount of natural tritium is produced when cosmic ray neutrons interact in the upper atmosphere with nitrogen, but that process introduces only about 5 to 10 TU into precipitation and surface water (Clark and Fritz, 1997). The tritium concentration in the water sample collected from the Ogallala #1 well of 7.8 TU indicates that the water could either be precipitation since 1953 or a mixture of pre- and post-1953 recharge. The water could not have all been recharged pre-1953, assuming 5-10 TU in pre-testing precipitation, because concentrations in that range would have decayed to less than 1 TU by 1994. This indicates that recharge from precipitation has been an important component of recharge for the portion of the Ogallala aquifer monitored by this well in the period between 1953 and 1998.
The same aboveground testing of hydrogen bombs also generated a peak concentration of another radioactive isotope, chlorine-36 (36Cl). The long half-life of 301,000 years for 36Cl limits its use as a tool to date modern water. Two natural processes also produce low levels of 36Cl. Natural atmospheric production of 36Cl occurs as a result of argon being activated by cosmic radiation. It is also produced epigenetically by activation of chloride, potassium and calcium due to cosmic radiation. Some equilibrium 36Cl/Cl values were calculated to range from 30.1 x 10⁻¹⁵ for granite down to 4.68 x 10⁻¹⁵ for sandstone (Clark and Fritz, 1997). The concentration of 1,210 x 10-15 36Cl /Cl in the ground water from the well was much higher than naturally produced 36Cl /Cl ratios and indicates that at least some modern (post 1950's) water has recharged the aquifer near the Ogallala #1 well (Stan Davis, University of Arizona, written commun., 1999).
Carbon-14 (14C) is a radioactive isotope of carbon with a half-life of 5,730 years (Drever, 1988). It is reported as a percent of the modern activity (pmc) of 14C. Carbon-13 (d13C) is a stable isotope of carbon and is expressed as a ratio (d13C) in parts per thousand (per mil) in the water sample from that found in Belemnitella americana fossil in the Cretaceous Pee Dee Formation of South Carolina (PDB). Using simplifying and limiting assumptions of a known 14C input and a closed system, the 14C value (56.62 percent modern) suggests that the ground water may be more than 1,000 years old (Stan Davis, University of Arizona, written commun., 1999). However, the d13C value suggests that the dissolution of old carbonates from the geologic materials, which are much older, is contributing part of the old carbon in the water sample. A possible source of the carbon would be from carbonate clasts (Stan Davis, University of Arizona, written commun., 1999) or calcium carbonate cementing in the Ogallala Formation. An interesting dichotomous result is post-1953 tritium concentration (7.8 TU) and 14C values below 100 percent modern carbon (pmc). These results are assumed to indicate that the carbon system is not a closed system. When dissolved CO2, with 100 pmc, reacts with carbon from the carbonate clast or calcium carbonate cementing, that have 0 pmc, a decrease in the 14C of the ground water is produced. Such results have previously been observed in other locations, and documented by Mazor (1991) in wells in the Kalahari. This mixing of the two carbon sources is a possible explanation for observed tritium and 14C values in this well.
When the isotopes of hydrogen, oxygen, chloride, and carbon are synthesized, they indicate the possibility that the water sampled from the well was a mixture of older and younger meteoric water that had reacted with the rock matrix of the aquifer.
Because BOPU was considering using the Ogallala aquifer for temporary storage of municipal water, the effects of injecting municipal water into the Ogallala #1 well were examined using a simple geochemical model. The reactions were modeled to determine if there was a potential to precipitate or dissolve minerals in the formation that might affect the aquifer permeability. Using the geochemical model PHREEQCi (Charlton and others, 1997; Parkhurst, 1995), three mixtures of Ogallala #1 well and municipal waters were examined to simulate injection of municipal water into the Ogallala aquifer. As a simplifying model assumption, the minerals calcite and goethite were considered in the mixing reactions as well as variation in reaction temperature. It was assumed that the water would be injected into the aquifer directly from the municipal pipeline, thus limiting its exposure to the atmosphere.
| Three mixtures were examined: (1) 80% Ogallala well water and 20% municipal water, (2) 50% Ogallala well water and 50% municipal water, and (3) 20% Ogallala well water and 80% municipal water. Changing the mixing percentage of the two waters only slightly changed the predicted saturation indices for individual minerals. The potential for geochemical changes was limited because both waters had somewhat similar chemical characteristics. Before mixing, the Ogallala water was slightly over-saturated with respect to calcite and the municipal water was slightly under-saturated with respect to calcite. Therefore, as the percentage of municipal water was increased in the mixture, the potential existed for the dissolution of calcite (fig. 8). All mixtures were over-saturated with respect to goethite, hematite, pyrolusite and amorphous ferric hydroxide and had the potential for precipitation of those minerals. As an example, the slight decrease in the saturation index for goethite is shown in figure 8. Precipitation of a silica phase might be possible, based on the saturation index of chalcedony depending on favorable thermodynamics and time of contact. As the percentage of municipal water was increased, the saturation indices decreased slightly for the over-saturated minerals since the iron and manganese concentrations were higher in the Ogallala water. All mixtures were under-saturated with respect to anhydrite, gypsum, and dolomite. | 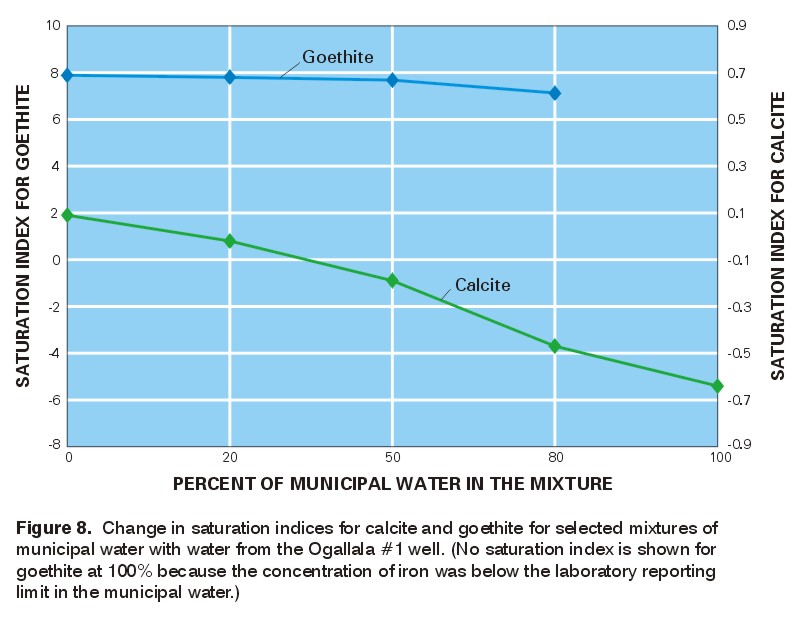
Figure 8. Change in saturation indices for calcite and goethite for selected mixtures of
municipal water with water from the Ogallala #1 well. (No saturation indices is shown for |
Reaction temperature was modeled at 15, 20, and 25 degrees Celsius for the 50% mixtures to examine the effect of temperature on the geochemical reactions. Calcite dissolved at all three temperatures, but dissolved less as the temperature increased. Goethite precipitated at all three temperatures, but the changes in temperature did not change the amount precipitated.
Data and analysis of the lithology, water levels, aquifer properties, water quality, isotopes, and geochemistry at Ogallala #1 well revealed some characteristics of the Ogallala aquifer and the White River aquifer. The sediments were fine grained with sands less than 1 millimeter in size comprising 59 percent, and silts and clays comprising 36 percent of the core from the site. The Ogallala Formation was estimated to be 246 feet thick at the well site. The water level appeared to respond to precipitation events and varied between 6,002.41 and 6,004.27 feet in elevation. The transmissivity was estimated to be about 1.1 ft2/day. The higher temperature of the municipal water, as compared to the Ogallala water, would slightly increase the hydraulic conductivity if municipal water were injected into the well.
The water quality of a sample from the well indicated the major ions were calcium, magnesium, and bicarbonate. Isotopic analysis of hydrogen-2, oxygen-18, tritium, chlorine-36, carbon-14 and carbon-13 indicated the water might be a mixture of pre- and post-1950's water. Geochemical modeling of different mixtures of municipal and Ogallala aquifer water indicated the potential for calcite dissolution as the percentage of municipal water in the mixture increased. The three mixtures modeled were slightly over-saturated with respect to goethite, hematite, pyrolusite, and amorphous ferric hydroxide; these minerals had the potential to precipitate if municipal water were injected into the Ogallala aquifer. All mixtures were under-saturated with respect to anhydrite, gypsum, and dolomite and likewise had the potential for dissolution of those minerals if the thermodynamics and time of contact were favorable.
American Society for Testing Materials, 1997, ASTM Standards on environmental sampling, (second edition), 1,008 p.
Charlton S.R., Macklin, C.L., and Parkhurst, D.L., 1997, PHREEQCi--A graphical user interface for the geochemical computer program PHREEQCi: U.S. Geological Survey Water-Resources Investigations Report 97-4222, 9 p.
Clark, I.D. and Fritz, P., 1997, Environmental Isotopes in Hydrogeology: New York, Lewis Publishing, 328 p.
Craig, H., 1961, Isotopic variations in meteoric waters: Science; 133, p. 1702-1703.
Cooley, M. E. and Crist, M. A., 1994, Geohydrology of the High Plains Aquifer System, Cheyenne urban area, Wyoming: U.S. Geological Survey Water-Resource Investigations Report 92-4047, 4 sheets, scale 1:24,000.
Cooley, M.E. and Crist, M.A., 1981, Generalized fence diagram showing stratigraphy and potentiometric surface of the tertiary formations in southeastern Wyoming and an adjacent part of Colorado: U.S. Geological Survey Miscellaneous Investigations Map I-1308, 1 sheet.
Denson, N.M. and Bergendahl, 1961, Middle and upper tertiary rocks of southeastern Wyoming and adjoining areas, in Short Papers in the Geologic and Hydrologic Sciences: Articles 147-292: U.S. Geological Survey Professional Paper 424-C, p. 168-172.
Drever, J.I., 1988, The geochemistry of natural waters (second edition): Englewood Cliffs, New Jersey, Prentice Hall, 437 p.
Fishman, M.J. and Friedman, L.C., eds., 1989, Methods for determination of inorganic substances in water and fluvial sediments (third edition): Techniques of Water-Resources Investigations of the U.S. Geological Survey, Book 5 Chapter 1A, 545 p.
Freeze, R. A. and Cherry, J. A., 1979, Groundwater: Engelwood Cliffs, New Jersey, Prentice-Hall, 604 p.
Gutentag, J.B., Heimes, F.J., Krothe, N.C., Luckey, R.R., and Weeks, J.B., 1984, Geohydrology of the High Plains Aquifer in parts of Colorado, Kansas, Nebraska, New Mexico, Oklahoma, South Dakota, Texas, and Wyoming: U.S. Geological Survey Professional Paper 1400-B, 63 p.
Gutentag, J.B. and Weeks, J.B., 1984, Water table in the High Plains Aquifer in 1978 in parts of Colorado, Kansas, Nebraska, New Mexico, Oklahoma, South Dakota, Texas, and Wyoming: U.S. Geological Survey Hydrologic Investigations Atlas HA-642, 1 sheet, scale 1:2,500,000.
Lowry, M.E. and Crist, M.A., 1967, Geology and Ground-Water Resources of Laramie County Wyoming: U.S. Geological Survey Water-Supply Paper 1834, 71 p, 2 plates.
Luckey, R.R., Gutentag, E.D. and Weeks, J.B., 1981, Water-level and saturated-thickness changes, predevelopment to 1980 in the High Plains aquifer in parts of Colorado, Kansas, Nebraska, New Mexico, Oklahoma, South Dakota, Texas, and Wyoming: U.S. Geological Survey Hydrologic Investigations Atlas HA-652, 2 sheets, scale 1:2,500,000.
Mazor, E., 1991, Applied chemical and isotopic groundwater hydrology: New York, John Wiley, 274 p.
Parkhurst, D.L., 1995, User's Guide to PHREEQC--a Computer Program for Speciation, Reaction-Path, Advective-Transport, and Inverse Geochemical Calculations: U.S. Geological Survey Water-Resources Investigation 95-4227, 6 p.
Sheppard, S. F. M., R. L. Nielsen, and H. P. Taylor, 1969, Oxygen and hydrogen isotope ratios of clay minerals from porphyry copper deposits: Economic Geology, 64, p. 755-777.
Travis, R.B., 1955, Classification of rocks: Quarterly of the Colorado School of Mines, v. 50, no. 1 (Jan. 1955), 98 p.
U.S. Environmental Protection Agency, 1997, Summary of EPA Finalized National Primary Drinking Water Regulations: U.S. Code of Federal Regulations, Title 40, Parts 141-143, summary prepared by U.S. EPA Region VIII-March, 1997, 8 p.
Walton, W. C., 1970, Groundwater Resource Evaluation, McGraw-Hill Book Company, New York, 664 p.
Weeks, J.B., Gutentag, E.D., Heimes, F.J., and Luckey, R.R., 1988, Summary of the High Plains Regional Aquifer-System Analysis in parts of Colorado, Kansas, Nebraska, New Mexico, Oklahoma, South Dakota, Texas, and Wyoming: U.S. Geological Survey Professional Paper 1400-A, 30 p.
West, R.C. ed., 1976, Handbook of Chemistry and Physics (57th edition): Cleveland, Ohio, CRC Press. Wyoming Water Development Commission, 1998, Cheyenne aquifer storage recovery test project final report, June 1998, pages numbered by chapter.
Wyoming Water Development Commission, 1995, Final report for Pine Bluffs water supply investigation, Level II, November 8, 1995, 78 p.
Wyoming Water Development Commission, 1994, Cheyenne water supply master plan, Level I, v. 2, Chapters 2-6, pages numbered by chapter.