The discussion of trace elements is focused on selected elements, as determined from comparison with historical concentrations and criteria, and potential adverse effects to either aquatic life or human health.
|
Trace elements are normally present in fish tissue, and many are required micronutrients such as copper and selenium (Sorenson, 1991). In excessive concentrations, however, trace elements can negatively affect growth, reproduction, and other biological functions. Concentrations of trace elements in fish tissue vary between fish species because of physiological, environmental, and other factors (Sorenson, 1991). All of the trace element concentrations discussed below are expressed in µg/g dry weight in liver-tissue samples unless noted otherwise. The highest concentrations of copper and selenium were in trout samples from forested and mineralized indicator sites (fig. 7), and integrator sites located in forested areas. The maximum concentrations of copper, selenium, and arsenic occurred in the brown-trout sample from a forested indicator site on the Little Bighorn River (site 15, table 6). |
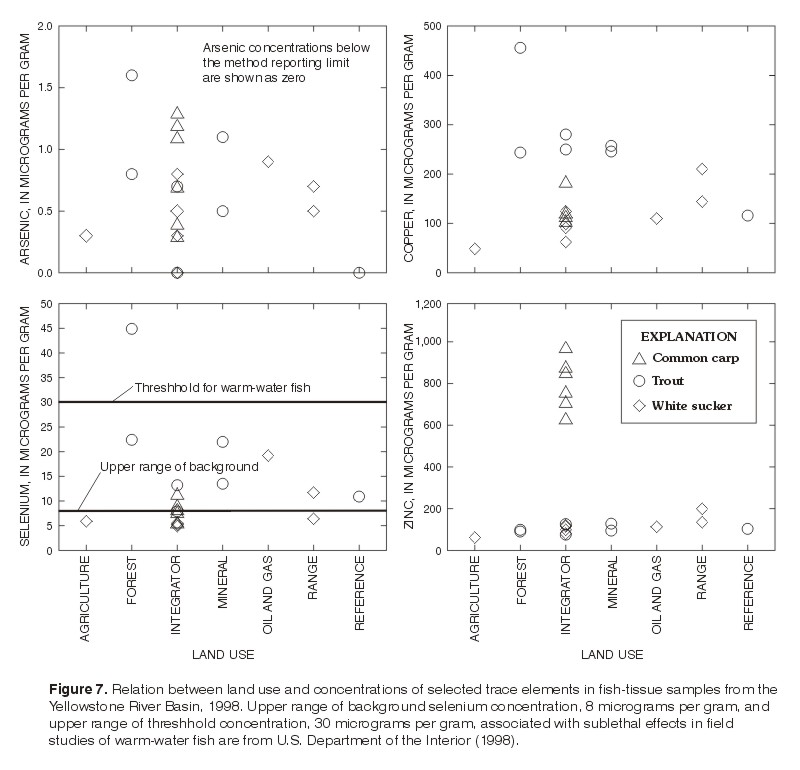
Figure 7. Relation between land use and concentrations of selected trace elements in fish-tissue samples from the
Yellowstone River Basin, 1998. Upper range of background selenium concentration, 8 micrograms per gram, and
upper range of threshhold concentration, 30 micrograms per gram, associated with sublethal effects in field
studies of warm-water fish are from U.S. Department of the Interior (1998). |
Concentrations of cadmium, chromium, manganese, molybdenum, selenium, and vanadium were higher in the sample from the mineralized area indicator site on Soda Butte Creek (site 2) than concentrations from the other two sites where cutthroat trout were sampled, including the mineralized area indicator site on West Fork Mill Creek (site 4, table 6). Mining in the Soda Butte Creek drainage has caused elevated concentrations of copper in cutthroat trout collected upstream of site 2 (Nimmo and others, 1998). The concentration of copper in the sample of cutthroat trout from site 2 on Soda Butte Creek, 207 µg/g, was below the range of copper concentrations of 265-605 µg/g dry weight in cutthroat trout livers reported by Nimmo and others (1998).
Volcanic and geothermal areas are generally known as sources of mercury (Eisler, 1987, p. 4-6), which might be responsible for the relatively high mercury concentration in the cutthroat-trout sample from the Yellowstone River at the outlet of Yellowstone Lake (site 1). The mercury concentration was 0.54 µg/g and notably higher than in any other trout samples. Yellowstone Lake lies within an ancient caldera with numerous geothermal features, and the drainage upstream of and surrounding the lake is underlain by volcanic rocks of Quaternary, Tertiary, and Cretaceous age.
The selenium concentration in many of the fish samples was higher than the background range of 2 to 8 µg/g in liver cited by the U.S. Department of the Interior (1998) (fig. 7). None of the white sucker or carp samples from the YELL exceeded the 25-30 µg/g threshold selenium concentration associated with sublethal effects in field studies of warm-water fish (U.S. Department of the Interior, 1998). None of the YELL trout samples exceeded the 51 µg/g selenium concentration in rainbow trout liver associated with substantial changes in blood chemistry (Lemly, 1996). Potentially seleniferous areas are widespread in Wyoming (Case and Cannia, 1988), and elevated concentrations of selenium in water, the aquatic food chain, and other media also have been described (See and others, 1992; Peterson and others, 1991).
Comparison of white sucker to common carp sampled on the same date from Goose Creek indicated concentrations of arsenic, cadmium, cobalt, mercury, molybdenum, selenium, vanadium, and zinc were higher in the common carp than in the white sucker (table 6). Elevated concentrations of cadmium and zinc in common carp relative to other fish species have been noted by Schmitt and Brumbaugh (1990) and Heiny and Tate (1997).
Whole-body composite samples of brook trout were collected from the Wood River (site 9) and Crow Creek (site 12) (table 7). Concentrations of arsenic, copper, mercury and zinc in samples from the two sites are less than no-effect levels or within the range of background concentrations for whole-body fish, but selenium concentrations are within the level of concern of 2 to 4 µg/g described by the U.S. Department of the Interior (1998). The concentrations of arsenic, cadmium, copper, lead, mercury, selenium, and zinc in the whole-body trout from sites 9 and 12 were near or less than the NCBP 85th percentile concentrations for the United States (Schmitt and Brumbaugh, 1990) and also were within the range of concentrations in whole-body fish from the Bighorn River and Wind River (Ramirez and Armstrong, 1992).
The concentrations of trace elements in natural waters are often much lower than would be expected on the basis of either equilibrium solubility calculations or of supply to the water from various sources. The most common reason for the low concentrations is adsorption of the element onto a solid phase (Drever, 1997) because bed sediment can serve as a sink for trace elements. Organic matter generally interacts strongly with trace metals; however, statistical analysis of selected trace elements indicated the concentrations were not correlated with the organic carbon concentration in the YELL samples.
Forty-four trace elements were analyzed in streambed sediment (table 8) at sites in the Yellowstone River Basin. Concentrations of four of these elements potentially exceeded criteria for the protection of aquatic biota. Because of their elevated concentrations and their toxicity in the aquatic ecosystem, arsenic, chromium, copper, and lead were selected for detailed presentation in this section. The concentrations of the four selected trace elements at sites representing the different land-use categories in the YELL study unit are shown in figure 8. Median copper and lead concentrations were highest at mineralized sites. Median arsenic concentration was highest at the single agriculture site. Median chromium concentration was highest at the single reference site. The concentrations of the four selected trace elements in relation to the different geologic units on which sites are located in the YELL study unit are shown in figure 9. Median concentrations of chromium, copper, and lead were highest at the sites located in Tertiary and Cretaceous volcanic rocks. Median arsenic concentration was highest at the sites located in the Cretaceous sedimentary rocks. |
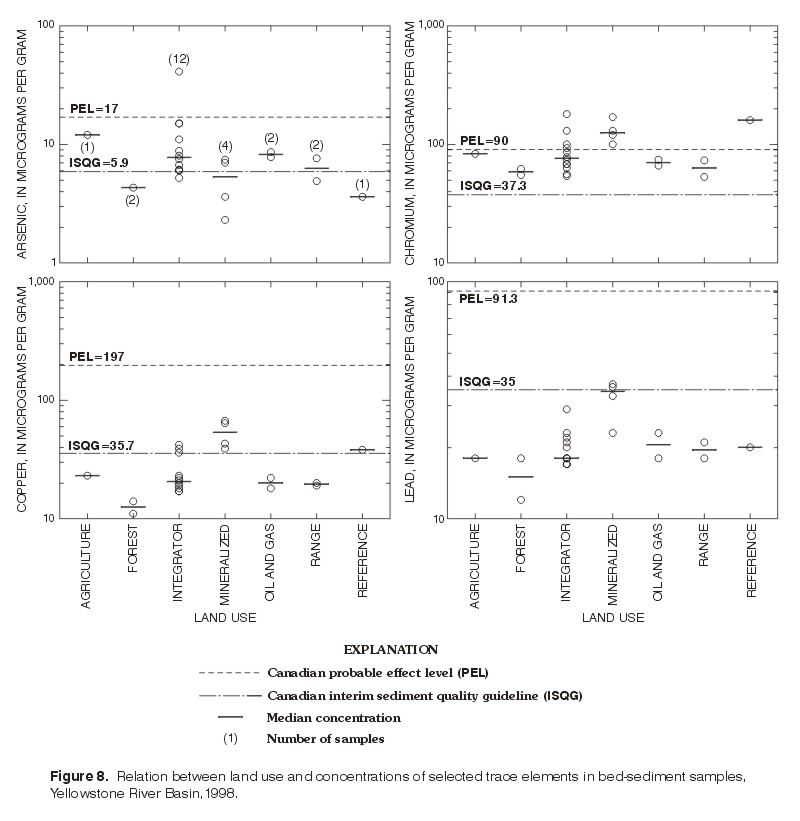
Figure 8. Relation between land use and concentrations of selected trace elements in bed-sediment samples,
Yellowstone River Basin,1998. |
| For comparative purposes, sediment criteria for protection of aquatic life are shown in figure 8 and historical concentrations for the YELL are shown in figure 9. There are no State guidelines for evaluating trace elements in sediment in Wyoming or Montana. The sediment quality guidelines for trace elements considered most toxic to aquatic life from the Canadian Council of Ministers of the Environment (2000) are used for reference with the YELL data. The Canadian guidelines have two levels: a lower value, referred to as an interim sediment quality guideline (ISQG), and an upper value, referred to as the probable effect level (PEL). Concentrations below the ISQGs are not expected to be associated with any adverse biological effects, whereas concentrations above the PELs are expected to be frequently associated with adverse biological effects. Concentrations between ISQGs and PELs represent the range in which effects are occasionally observed. Historical concentrations for trace elements in sediment for the YELL were calculated by Peterson and Zelt (1999), from data collected for the National Uranium Resource Evaluation (NURE) program. The NURE data consisted of about 13,000 samples collected in the YELL study unit area during 1974-79 as part of a nationwide, systematic study of uranium resources. Summary statistics for NURE trace element data from eight geologic units were compiled by Peterson and Zelt (1999); the 50th and 95th percentile data are used as historical data for this report. The NURE samples were sieved through 150 mm mesh, whereas the Canadian guidelines are based on the concentrations of elements in bulk sediment, and the YELL samples were sieved through 62 mm mesh. The differences in size fraction might cause the YELL samples to be biased high relative to the NURE data and the bulk sediment guidelines, because trace metal concentrations commonly are inversely related to sediment grain size (Horowitz, 1991, p. 16-22). | 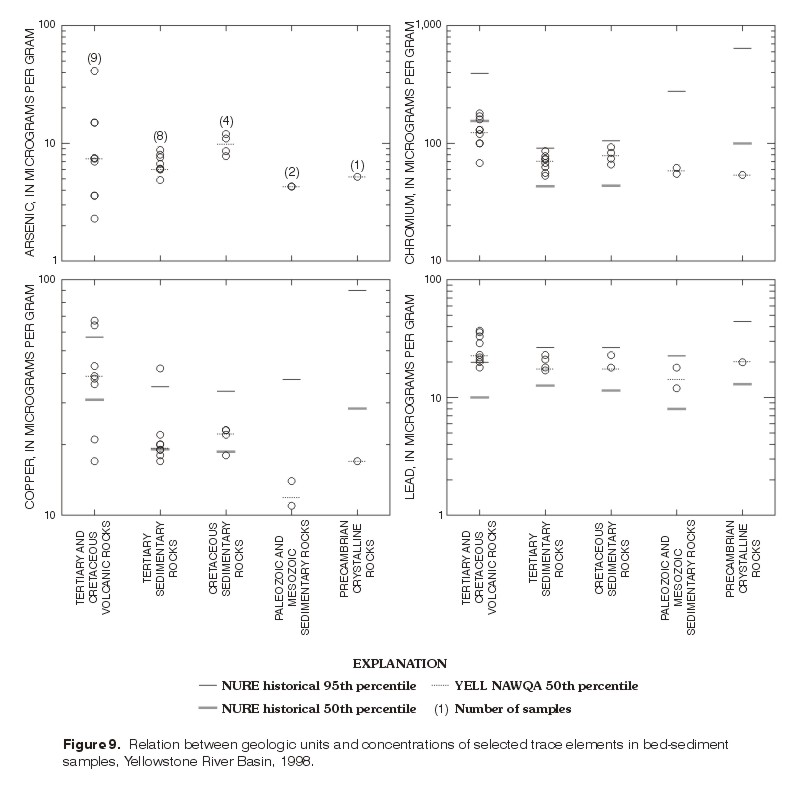
Figure 9. Relation between geologic units and concentrations of selected trace elements in bed-sediment
samples, Yellowstone River Basin, 1998. |
Arsenic exceeded the ISQG of 5.9 µg/g at 17 sites. The highest concentration (41 µg/g) occurred at Yellowstone River at Corwin Springs (site 3), which was the only site that exceeded the PEL of 17 µg/g. Historical arsenic concentrations for the YELL were not available from the NURE data.
Chromium exceeded the ISQG of 37.3 µg/g at all 24 sites. The PEL of 90 µg/g was exceeded at nine sites with a maximum concentration of 180 µg/g at Yellowstone River at Corwin Springs (site 3). None of the chromium concentrations exceeded the 95th percentile historical concentration (fig. 9).
Copper exceeded the ISQG of 35.7 µg/g at eight sites, with a maximum concentration of 67 µg/g at Arrow Creek near Worden (site 7). None of the samples approached the PEL of 197 µg/g (fig. 8). The copper concentration in two samples exceeded the 95th percentile YELL historical concentration for Tertiary and Cretaceous volcanic rocks; and one copper concentration exceeded the 95th percentile historical concentration for Tertiary sedimentary rocks (fig. 9).
Lead exceeded the ISQG of 35 µg/g at two sites: West Fork Mill Creek, site 4 (37 µg/g) and Wood River, site 8 (36 µg/g). The PEL of lead is 91.3 µg/g (fig. 8). Several of the lead concentrations also exceeded the 95th percentile NURE historical concentration (fig. 9).
| Selected trace-element concentrations in bed sediment from the YELL were compared to those from the South Platte (SPLT) and Upper Colorado (UCOL) NAWQA study units (fig. 10). These three study units are all located in the Rocky Mountains with similar land uses and geology. The Kruskall-Wallis rank sum statistical test (Helsel and Hirsch, 1992) was performed on the streambed sediment data to determine if the differences in the trace element concentrations among the three study units were significant. Significant differences (p<0.05) exist among the study units for all four selected trace elements. The data were then analyzed by the Wilcoxon rank sum statistical test to determine which groups were significantly different at the 0.05 level. The letters A, B, and C were assigned to each boxplot (fig. 10) to denote significant statistical differences in the data sets. Boxplots that have the same letter indicate the data sets were not significantly different from each other, and boxplots that have different letters indicate significant differences. Arsenic concentrations in the YELL were similar to those in the SPLT but significantly lower than those in the UCOL. Chromium concentrations were significantly higher in the YELL than in the other basins. Copper concentrations in the YELL were similar to those in the UCOL but significantly lower than those in the SPLT. Lead concentrations were significantly lower in the YELL than in the other study units. | 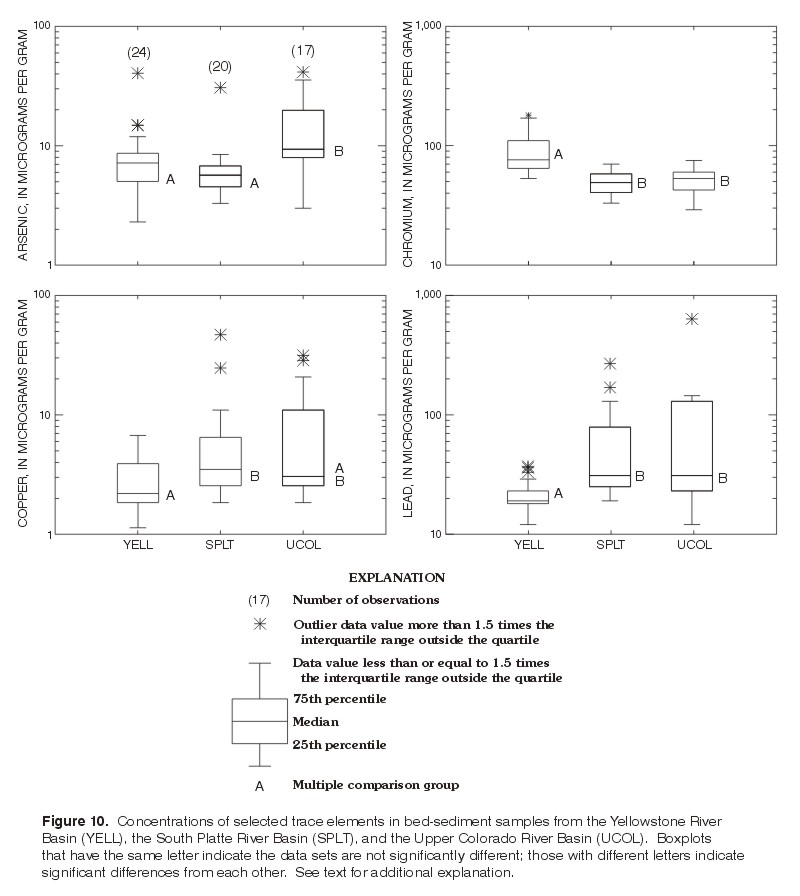
Figure 10. Relation between geologic units and concentrations of selected trace elements in bed-sediment
samples, Yellowstone River Basin, 1998. |
Samples were collected at five sites for analysis of mercury in fish muscle and bed sediment, in coordination with the USGS National Mercury Project (Krabbenhoft and others, 1999). Concentrations of mercury in muscle tissue from predatory game fish ranged from 0.743 to 3.45 µg/g dry weight (table 9). The higher mercury concentrations were in walleye from the Bighorn River (site 10), Bighorn Lake (site 11), and the Shoshone River (site 14). The walleye sample from Bighorn Lake (site 11) contained a higher concentration of mercury than the mercury concentrations in carp from Bighorn Lake reported by McDowell (1973). Higher concentrations of mercury in predatory walleye compared with the omnivorous carp are expected because of bioaccumulation and biomagnification (Eisler, 1987, Phillips and others, 1980). The mercury concentrations in walleye from sites 10, 11, and 14 are within the range of mercury concentrations in walleye from Bighorn Lake collected by the Montana Department of Fish, Wildlife and Parks (MFWP). The Montana Department of Public Health and Human Services (1995) issued a fish consumption advisory for Bighorn Lake, Tongue River Reservoir, and Cooney Reservoir in the Yellowstone River Basin on the basis of the MFWP samples. Additional information on fish consumption advisories is available from the State and a website at: http://www.epa.gov/OST/fish/mercury.html.
The smallmouth bass sampled at site 19 on the Tongue River had the smallest concentration of mercury of the fish sampled. Nonpoint sources accounted for more than 80 percent of the mercury inputs to Tongue River Reservoir, which is located a few miles downstream of site 19 (Phillips and others, 1987). The mercury concentrations in the smallmouth bass from the Tongue River and sauger from the Yellowstone River near Sidney (site 24) were similar to the median and mean concentrations of mercury from a national study of chemical residues in fish (U.S. Environmental Protection Agency, 1992).
Only a small fraction of the mercury present in the bed sediment was in the form of methyl mercury (table 9). Methyl mercury is of interest because it is the most toxic form of mercury (Eisler, 1987). The percentage of total mercury in the methyl form in the sediment samples ranged from 1.8 percent at Bighorn Lake to 11 percent in the Tongue River. The concentration of methyl mercury in the sediment from the Tongue River was 3.05 nanograms per gram (ng/g) dry weight, considerably higher than the other samples that contained 0.53 to 0.60 ng/g (table 9).
| AccessibilityFOIAPrivacyPolicies and Notices | |
 |
|