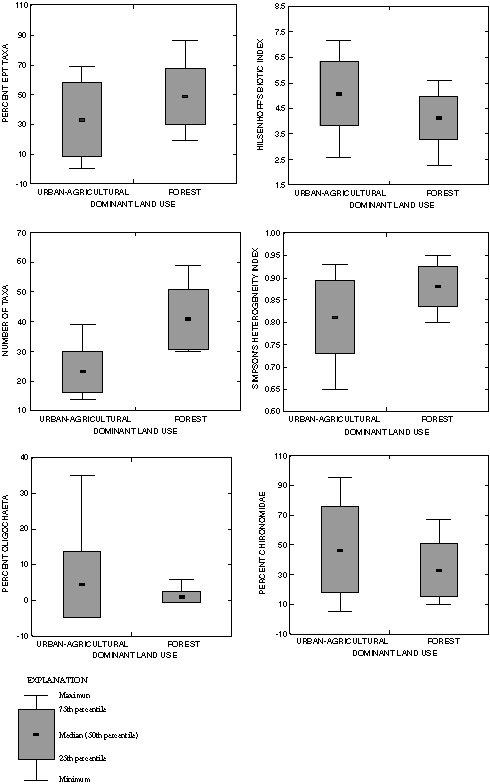
Figure 4. Distribution of selected benthic aquatic insect variables for reaches grouped by dominant land use.
Back to Contents | Back to text | Figure 5