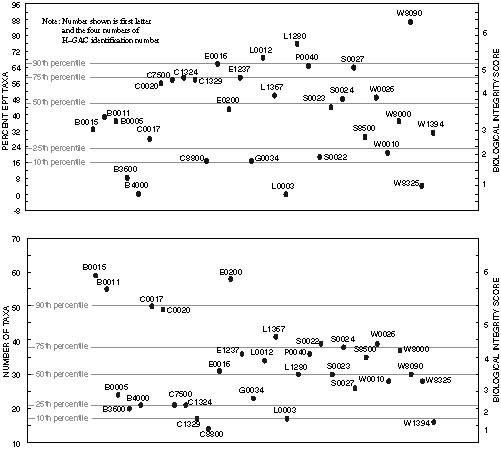
Figure 7. Percent EPT taxa and number of taxa for selected reaches classified by percentile and biological integrity score.
Back to Contents | Back to text | Figure 8