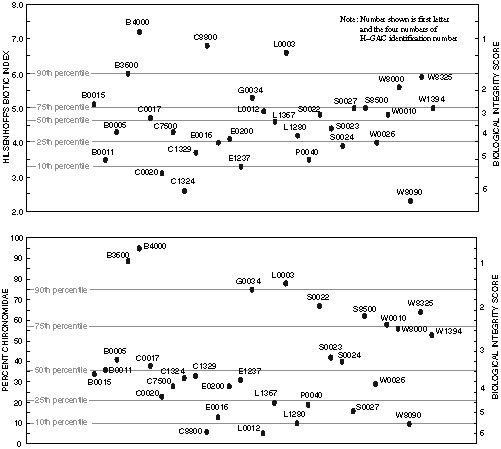
Figure 8. Hilsenhoffs biotic index and percent Chironomidae for selected reaches classified by percentile and biological integrity score.
Back to Contents | Back to text | Figure 9