Water-Resources Investigations Report 01-4279 (modified format)
Cheyenne, Wyoming, 2001
By Melanie L. Clark, Kirk A. Miller, and Myron H. Brooks
| Ranchers, water managers, and others are concerned about the quality of coalbed methane
(CBM) discharge waters and the effect they may have on stream-water quality in the Powder River Basin. During the production of
CBM, water is pumped from wells, lowering hydrostatic pressure in the coal beds and allowing the previously confined methane that is stored within the internal surfaces and voids of the coal to flow
(DeBruin and others, 2000). Currently, most water produced during CBM production in the Powder River Basin is discharged into constructed reservoirs or into surface drainages, where it may become part of the streamflow or infiltrate into the ground. Proposed uses of
CBM-produced water include agriculture, domestic, industrial, and public-water supply.
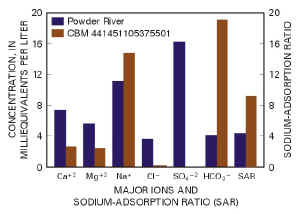
Understanding and predicting the effect of CBM-produced water on stream-water quality is complicated by many factors including local hydrology and geology, stream chemistry, land use, and climate. The U.S. Geological Survey (USGS) has been monitoring streamflow and stream-water quality at sites in the Powder River Basin since 1900. The data can be used to help understand water-quality conditions in the basin and to provide a useful baseline against which future changes can be compared. This report summarizes some of the available monitoring data and data relations that may be useful for assessing water-quality changes, if any, that CBM discharges may have on stream-water quality. All natural waters contain dissolved chemicals. These are introduced into the water from the atmosphere, soil, and rocks that have come in contact with the water, and by human activities. Water from different geologic settings commonly will have distinctly different chemical signatures that can be used to infer the source of water. This is the case when water from streams in the Powder River Basin is compared to water from CBM discharges. A comparison of the major chemical constituents dissolved in a sample from the Powder River and a sample of water obtained from a subsurface coal bed is shown in figure 1. Although these samples are not representative of all surface- and ground-water samples in the basin, they do illustrate some of the possible chemical differences. Water from the Powder River is higher in dissolved calcium (Ca+2), magnesium (Mg+2), chloride (Cl-) and sulfate (SO4-2), whereas water from the coal bed is higher in dissolved sodium (Na+) and bicarbonate (HCO3-). |
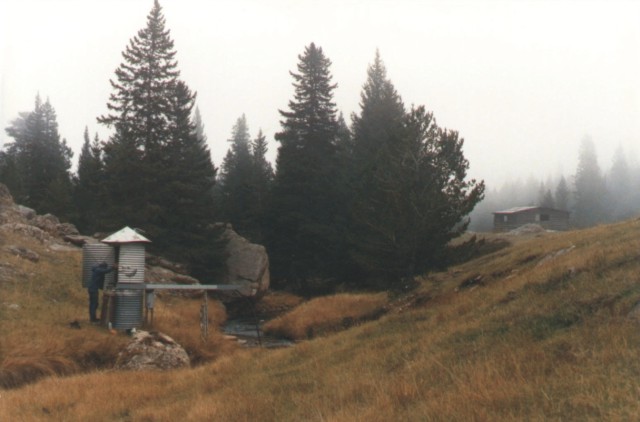
Streamflow-gaging station 06317000, Powder River at Arvada, Wyo. (site 32)
Figure 1. Major-ion chemistry for samples from the
Powder River at Arvada, Wyo., July 21, 1999 (Swanson and others, 2000b)
and CBM well 441451105375501,
June 18, 1999 (Swanson and others, 2000a). |
| Chemical differences can be important when waters from the different sources are mixed. For example, the ratio of sodium ions to calcium and magnesium ions present in water, in part, dictates the suitability of that water for crop irrigation. This ratio is known as the sodium-adsorption ratio (SAR). The higher the SAR value for a given water, the less suitable it is for irrigation. SAR values for the sample from the Powder River and a sample of water obtained from a subsurface coal bed are shown at the far right in figure 1. Elevated SAR values have been reported for some coalbed waters (Rice and others, 2000). Introduction of higher SAR water from CBM discharges into the Powder River has the potential to affect the use of water by irrigators downstream of those CBM discharges. | |
|
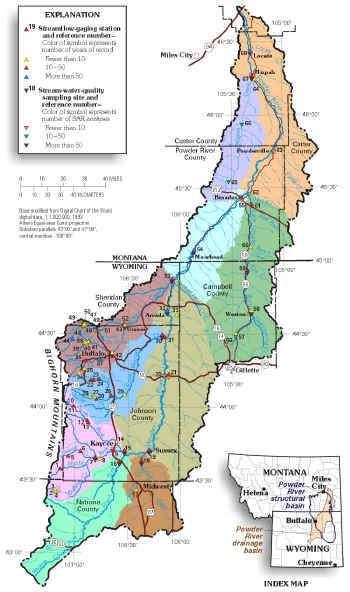
The USGS, in cooperation with Federal, State, and local agencies, has been monitoring streamflow and stream-water quality in the Powder River Basin for more than a century. The number and location of sites where streamflow and water quality have been monitored have changed over time as various study objectives, land-use patterns, and available funding have varied. A summary of the historical period of record for streamflow-gaging stations and the number of historical SAR analyses for water-quality sites in the Powder River Basin through water year 2000 is shown in figure 2 and table 1. Readers should be aware that there could be gaps in the records at streamflow-gaging stations. Therefore, an entry in table 1 that indicates operation from 1921-1950 may or may not correspond to a continuous 30-year record of streamflow at that site. The streamflow-gaging station with the longest continuous record (78 years) is Piney Creek at Kearny, Wyo. (site 51). The water-quality monitoring site with the greatest number of SAR values measured (498) is Powder River near Locate, Mont. (site 68). Because monitoring needs are changing quickly as CBM production proceeds, there are additional monitoring sites in the Powder River Basin that have been added since water year 2000 that may not be shown in figure 2 and table 1. Readers interested in examining the available data for any of the sites listed in table 1 are referred to the USGS Internet database. This database, which houses data from about 21,200 streamflow-gaging stations and water-quality data from about 338,000 sites nationwide, can be accessed at URL http://waterdata.usgs.gov/nwis/. |
Figure 2. Location of streamflow-gaging stations and stream-water-quality sites in the Powder River Basin, Wyoming and Montana. |
Table 1. Streamflow-gaging stations and stream-water-quality sampling sites in the Powder River Basin, Wyoming
and Montana, 1900-2000
[SAR, sodium-adsorption ratio; --, no data]
| Reference number (fig. 2) |
Site number | Site name | Period of record for streamflow1 | Number of SAR analyses |
|---|---|---|---|---|
| 1 | 06309200 | Middle Fork Powder River near Barnum, Wyo. | 1961-2000 | -- |
| 2 | 06309260 | Buffalo Creek above North Fork Buffalo Creek near Arminto, Wyo. | 1975-79 | -- |
| 3 | 06309270 | North Fork Buffalo Creek near Arminto, Wyo. | 1975-79 | -- |
| 4 | 06309280 | Buffalo Creek below North Fork Buffalo Creek near Arminto, Wyo. | 1975-79 | -- |
| 5 | 06309450 | Beaver Creek below Bayer Creek near Barnum, Wyo. | 1975-89 | -- |
| 6 | 06309460 | Beaver Creek above White Panther Ditch near Barnum, Wyo. | 1975-89 | -- |
| 7 | 06309500 | Middle Fork Powder River above Kaycee, Wyo. | 1949-92 | 62 |
| 8 | 06310000 | Red Fork near Barnum, Wyo. | 1929-53 | -- |
| 9 | 06310500 | Middle Fork Powder River at Kaycee, Wyo. | 1911-32 | -- |
| 10 | 06311000 | North Fork Powder River near Hazelton, Wyo. | 1946-2000 | -- |
| 11 | 06311060 | North Fork Powder River below Bull Creek near Hazelton, Wyo. | 1975-92 | -- |
| 12 | 06311400 | North Fork Powder River below Pass Creek near Mayoworth, Wyo. | 1974-2000 | -- |
| 13 | 06311500 | North Fork Powder River near Mayoworth, Wyo. | 1941-73 | -- |
| 14 | 06312000 | North Fork Powder River near Kaycee, Wyo. | 1929-32 | -- |
| 15 | 06312500 | Powder River near Kaycee, Wyo. | 1939-80 | 217 |
| 16 | 06313000 | South Fork Powder River near Kaycee, Wyo. | 1939-84 | 196 |
| 17 | 06313180 | Dugout Creek tributary near Midwest, Wyo. | 1975-83 | -- |
| 18 | 06313400 | Salt Creek near Sussex, Wyo. | 1976-93 | 170 |
| 19 | 06313500 | Powder River at Sussex, Wyo. | 1938-98 | 83 |
| 20 | 06313665 | Powder River above Dead Horse Creek near Buffalo, Wyo. | -- | 2 |
| 21 | 06313700 | Dead Horse Creek near Buffalo, Wyo. | 1972-90 | 1 |
| 22 | 06313950 | North Fork Crazy Woman Creek below Pole Creek near Buffalo, Wyo. | 1974-84 | -- |
| 23 | 06314000 | North Fork Crazy Woman Creek near Buffalo, Wyo. | 1944-84 | -- |
| 24 | 06314500 | North Fork Crazy Woman Creek below Spring Draw near Buffalo, Wyo. | 1949-72 | -- |
| 25 | 06315000 | North Fork Crazy Woman Creek near Greub, Wyo. | 1950-68 | -- |
| 26 | 06315480 | Poison Creek below Tetley Spring near Mayoworth, Wyo. | 1975-77 | -- |
| 27 | 06315490 | Poison Creek near Mayoworth, Wyo. | 1975-76 | -- |
| 28 | 06315500 | Middle Fork Crazy Woman Creek near Greub, Wyo. | 1942-72 | -- |
| 29 | 06316000 | Crazy Woman Creek near Buffalo, Wyo. | 1929-32 | -- |
| 30 | 06316400 | Crazy Woman Creek at upper station near Arvada, Wyo. | 1963-81 | 172 |
| 31 | 06316500 | Crazy Woman Creek near Arvada, Wyo. | 1940-64 | -- |
| 32 | 06317000 | Powder River at Arvada, Wyo. | 1931-2000 | 242 |
| 33 | 06317020 | Wildhorse Creek near Arvada, Wyo. | 2000 | -- |
| 34 | 06317300 | Sourdough Creek near Buffalo, Wyo. | 1985-90 | -- |
| 35 | 06317340 | Little Sourdough Creek near Buffalo, Wyo. | 1985-88 | -- |
| 36 | 06317500 | North Fork Clear Creek near Buffalo, Wyo. | 1950-68 | -- |
| 37 | 06318500 | Clear Creek near Buffalo, Wyo. | 1917-92 | -- |
| 38 | 06319470 | South Rock Creek at forest boundary near Buffalo, Wyo. | 1975-76 | -- |
| 39 | 06319480 | South Rock Creek above Red Canyon Creek near Buffalo, Wyo. | 1975-76 | -- |
| 40 | 06319500 | South Fork Rock Creek near Buffalo, Wyo. | 1951-54 | -- |
| 41 | 06320000 | Rock Creek near Buffalo, Wyo. | 1945-2000 | -- |
| 42 | 06320200 | Clear Creek below Rock Creek near Buffalo, Wyo. | 1976-81 | 74 |
| 43 | 06320400 | Clear Creek at Ucross, Wyo. | 1976-81 | 65 |
| 44 | 06320500 | South Piney Creek at Willow Park, Wyo. | 1947-2000 | -- |
| 45 | 06321000 | South Piney Creek near Story, Wyo. | 1951-80 | -- |
| 46 | 06321020 | Mead-Coffeen Ditch above fish hatchery near Story, Wyo. | 1975-79 | -- |
| 47 | 06321040 | Mead-Coffeen Ditch below fish hatchery near Story, Wyo. | 1975-79 | -- |
| 48 | 06321100 | South Piney Creek below Mead-Coffeen Ditch near Story, Wyo. | 1975-79 | -- |
| 49 | 06321500 | North Piney Creek near Story, Wyo. | 1952-82 | -- |
| 50 | 06321800 | Spring Creek near Story, Wyo. | 1975-79 | -- |
| 51 | 06323000 | Piney Creek at Kearny, Wyo. | 1903-2000 | 3 |
| 52 | 06323500 | Piney Creek at Ucross, Wyo. | 1900-1982 | 64 |
| 53 | 06324000 | Clear Creek near Arvada, Wyo. | 1915-82 | 177 |
| 54 | 06324500 | Powder River at Moorhead, Mont. | 1929-2000 | 111 |
| 55 | 06324710 | Powder River at Broadus, Mont. | 1976-92 | 2 |
| 56 | 06324830 | Rawhide Creek at US Highway 14-16 near Gillette, Wyo. | -- | 5 |
| 57 | 06324890 | Little Powder River below Corral Creek near Weston, Wyo. | 1977-83 | 41 |
| 58 | 06324925 | Little Powder River near Weston, Wyo. | 1977-81 | 52 |
| 59 | 06324970 | Little Powder River above Dry Creek near Weston, Wyo. | 1973-2000 | 129 |
| 60 | 06325000 | Little Powder River at Biddle, Mont. | 1938-43 | -- |
| 61 | 06325500 | Little Powder River near Broadus, Mont. | 1947-72 | -- |
| 62 | 06325550 | Little Powder River at mouth near Broadus, Mont. | -- | 2 |
| 63 | 06325650 | Powder River near Powderville, Mont. | -- | 2 |
| 64 | 06326000 | Powder River near Mizpah, Mont. | 1928-33 | -- |
| 65 | 06326050 | Mizpah Creek at Olive, Mont. | -- | 28 |
| 66 | 06326200 | Mizpah Creek near Volberg, Mont. | -- | 19 |
| 67 | 06326300 | Mizpah Creek near Mizpah, Mont. | 1975-86 | 54 |
| 68 | 06326500 | Powder River near Locate, Mont. | 1938-2000 | 498 |
1Period of record is based on water year. A water year runs from October 1 of the previous year to September 30 of the indicated year. Streamflow record may or may not be continuous for the period of record shown.
| Perhaps the single most important factor in determining the effect of CBM discharges into Powder River Basin streams is the amount of water flowing in the stream at the time the discharge occurs. The amount of water flowing in streams in the Powder River Basin varies by geographic location, climatic conditions, time of year, and degree of human influence. For example, precipitation is higher and evapotranspiration is lower in the mountainous parts of the basin than in the plains (Marston, 1990).
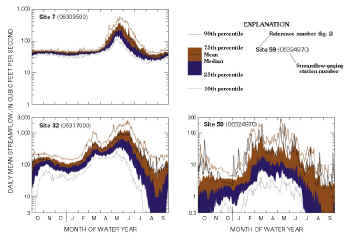
Statistical summaries of daily mean streamflow measured at selected streamflow-gaging stations illustrate these variations in hydrologic settings (fig. 3). The graph for the Middle Fork Powder River above Kaycee, Wyo., (site 7) is representative of streams that originate in the mountainous areas of the basin. Flows in these streams are perennial and dominated by a single snowmelt peak of moderate duration in the late spring or early summer. Low variability in streamflow exists during the rest of the year as streamflow is generally sustained by discharge from ground water. The graph for the Little Powder River above Dry Creek near Weston, Wyo. (site 59) is representative of streams that originate in the plains. Flows throughout the year in these streams are much more variable than in mountain streams. These plains streams may exhibit peak flows resulting from lowland snowmelt during late winter or early spring as well as from rainstorms throughout the remainder of the summer and fall. More importantly, these streams are very likely to have little or no flow for several months during the late summer through early winter. The Powder River has tributaries that are of both mountain and plains origin. Consequently, the record from a gaging station on the Powder River at Arvada, Wyo. (site 32) exhibits patterns that are characteristic of both types of streams. Peaks in streamflow occur from lowland snowmelt during late winter or early spring and from mountain snowmelt during late spring or early summer. Flow is more variable throughout the year than in mountain streams, and periods of little or no flow still occur but with less frequency than for plains streams. In addition to the different hydrologic settings, irrigation withdrawals may affect flows in some of the basins. In general, most of the water withdrawn for irrigation in Wyoming is from the headwater and tributary drainages, which may reduce flows to the Powder River. In contrast, most of the water withdrawn for irrigation in Montana is directly from the mainstem of the Powder River (Lindner-Lunsford and others, 1992). |
Figure 3. Statistical summary of daily mean streamflow for period of record at selected streamflow-gaging
stations, Powder River Basin, Wyoming and Montana.
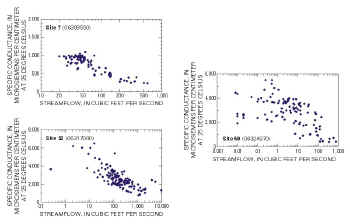
Figure 4. Streamflow and specific-conductance relations at selected sites in the Powder River Basin, Wyoming
and Montana. |
|
Water quality in streams is commonly a function of streamflow. Consequently, the variations in streamflow that are shown in figure 3 can influence water quality throughout the year. One general indicator of water quality is specific conductance. Specific conductance is a measure of the ability of water to conduct an electrical current. Because this ability is related to the quantity of chemical ions dissolved in water, specific conductance can be used to estimate the salinity or dissolved solids present in the stream (Hem, 1985). Streamflow and specific conductance generally show an inverse relation, where specific conductance decreases as flow increases (fig. 4). A typical relation is shown for the Middle Fork Powder River above Kaycee, Wyo. (site 7). High flows in the Middle Fork Powder River occur during snowmelt runoff, which is characterized by low dissolved-solids concentrations and a correspondingly low specific conductance. A similar relation also exists for the Powder River at Arvada, Wyo. (site 32), although the variance is somewhat greater. A relation, if it exists, is much less evident for the Little Powder River above Dry Creek near Weston, Wyo. (site 59). Possible explanations for the lack of a strong relation include the influence of coal-mine discharges in the basin and the evaporative accumulation of surface salts in plains watersheds that can be flushed to the stream during rainfall events. Such short-lived pulses of increased specific conductance during periods of increasing flow can complicate the overall relation and result in a wider scatter of data for a given flow. |
|
|
Powder River near Locate, Mont. near site 68 |
Eight sites, which are a subset of the monitoring sites shown in figure 2 and table 1, were selected for further examination. These sites were selected because of their hydrologic significance or regulatory interest in relation to CBM development. Data examined from these sites were restricted to those collected during water years 1981-2000. This 20-year period was selected as being representative of the water-quality conditions prior to CBM development because little, if any, CBM discharge waters entered streams in the basin during this time period. As was mentioned earlier, the sampling frequency and period of record varies at each site. In addition, the data have not been adjusted to account for natural climatic variability. |
| The Middle Fork Powder River above Kaycee, Wyo. (site 7) originates from mountainous sources and is upstream from the oil and methane development in the basin. Salt Creek near Sussex, Wyo. (site 18) is a plains tributary of the Powder River that receives saline oil-production water from older, established oil fields and contributes to the salinity of the Powder River (Lindner-Lunsford and others, 1992). The Powder River at Sussex, Wyo. (site 19) is below Salt Creek but above reaches of the Powder River where CBM development is occurring. Powder River at Arvada, Wyo. (site 32) is the downstream-most site in Wyoming and is below areas of CBM development. Powder River at Moorhead, Mont. (site 54) is near the Wyoming-Montana State line and will serve as a point of compliance for the States. CBM development is also occurring in the Arvada-Moorhead reach of the Powder River (J. Smith, Wyoming Department of Environmental Quality, oral commun., 2001). Clear Creek near Arvada, Wyo. (site 53) contributes water from mountainous and plains sources, and changes the water quality of the mainstem Powder River between Arvada, Wyo. and Moorhead, Mont. The Little Powder River above Dry Creek near Weston, Wyo. (site 59) originates as a plains stream that has received coal-mine discharges and is downstream of CBM development. Powder River near Locate, Mont. (site 68) is below inputs from the Little Powder River and represents the cumulative effects on water quality from all hydrologic sources and land uses within the watershed. | |
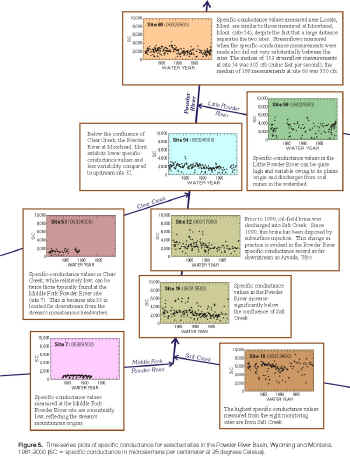
| Constituents of concern in CBM discharge waters include the major ions (sodium, for example), which comprise most of the dissolved-solids concentration (salinity). Increases in the major-ion concentrations in streams can be indirectly measured as increases in stream specific conductance. Comparing patterns of specific conductance among sites and over a common period of time, such as that shown in figure 5, is one strategy that regulators can use to detect changes in water chemistry. These changes can then be examined relative to climatic patterns and CBM or other activities in the basin to evaluate whether any cause-and-effect linkages can be established. General observations on patterns in specific conductance are provided with each graph in figure 5 and listed below. | |
| Specific-conductance values measured near Locate, Mont. are similar to those measured at Moorhead, Mont. (site 54), despite the fact that a large distance separates the two sites. Streamflows measured when the specific-conductance measurements were made also did not vary substantially between the sites. The median of 153 streamflow measurements at site 54 was 305 cfs (cubic feet per second); the median of 199 measurements at site 68 was 350 cfs. |
Figure 5. Time-series plots of specific conductance for selected sites in the Powder River Basin, Wyoming and Montana,
1981-2000 (SC = specific conductance in microsiemens per centimeter at 25 degrees Celsius). |
| Specific-conductance values in the Little Powder River can be quite high and variable owing to its plains origin and discharges from coal mines in the watershed. | |
| Below the confluence of Clear Creek, the Powder River at Moorhead, Mont. exhibits lower specific-conductance values and less variability compared to upstream site 32. | |
| Specific-conductance values in Clear Creek, while relatively low, can be twice those typically found at the Middle Fork Powder River site (site 7). This is because site 53 is located far downstream from the stream's mountainous headwaters. | |
| Prior to 1990, oil-field brine was discharged into Salt Creek. Since 1990, this brine has been disposed by subsurface injection. This change in practice is evident in the Powder River specific-conductance record as far downstream as Arvada, Wyo. | |
| Specific conductance values in the Powder River increase significantly below the confluence of Salt Creek. | |
| The highest specific-conductance values measured from the eight monitoring sites are from Salt Creek. | |
| Specific-conductance values measured at the Middle Fork Powder River site are consistently low, reflecting the stream's mountainous origins. | |
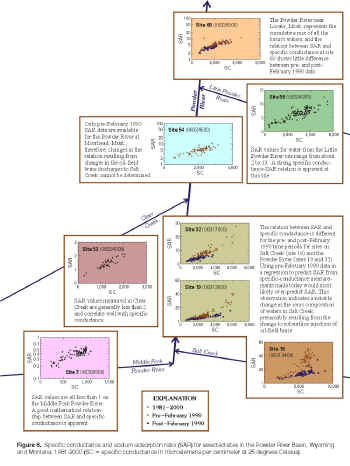
| The combination of specific conductance and SAR is used to determine the suitability of water for irrigation. The suit-ability is not a single number but rather a dynamic relation. For general reference, a specific conductance near 2,000 microsiemens per centimeter at 25 degrees Celsius, and an SAR greater than 10 would represent a high sodium hazard (Hem, 1985). Graphs shown in figure 6 depict the relations between specific conductance and SAR at the eight selected monitoring sites. Sites potentially affected by oil-field brine discharged into Salt Creek are plotted with two time periods: pre- and post-February, 1990. The linear patterns in the data indicate that regression equations can be established for specific conductance and SAR. A regression equation is a mathematical relation between two constituents where one measured constituent is used to predict another unmeasured constituent. This relation generally is site specific and can change over time if stream chemistry changes. Because specific conductance can be monitored remotely and instantaneously, regulators looking for changes in stream SAR values have the option of monitoring specific conductance as a surrogate for SAR and having nearly instantaneous, continuous records of this calculated SAR approximation. | |
| The Powder River near Locate, Mont. represents the cumulative mix of all the basin's waters, and the relation between SAR and specific conductance at site 68 shows little difference between pre- and post-February 1990 data. |
Figure 6. Specific conductance and sodium-adsorption ratio (SAR) for selected sites in the Powder River Basin, Wyoming
and Montana, 1981-2000 (SC = specific conductance in microsiemens per centimeter at 25 degrees Celsius). |
| SAR values for water from the Little Powder River site range from about 2 to 13. A strong specific conductance-SAR relation is apparent at this site. | |
| Only pre-February 1990 SAR data are available for the Powder River at Moorhead, Mont.; therefore, changes in the relation resulting from changes in the oil-field brine discharges to Salt Creek cannot be determined. | |
| SAR values measured in Clear Creek are generally less than 2 and correlate well with specific conductance. | |
| The relation between SAR and specific conductance is different for the pre- and post-February 1990 time periods for sites on Salt Creek (site 18) and the Powder River (sites 19 and 32). Using pre-February 1990 data in a regression to predict SAR from specific-conductance measurements made today would most likely over-predict SAR. | |
| This observation indicates a notable change in the ionic composition of waters in Salt Creek, presumably resulting from the change to subsurface injection of oil-field brine. | |
| SAR values are all less than 1 on the Middle Fork Powder River. A good mathematical relationship between SAR and specific conductance is apparent. | |
| The effect of CBM discharge waters on stream-water quality in the Powder River Basin is still unknown. CBM waters, which have a different ionic composition, could alter the specific conductance and SAR relations in the drainages. Specific conductance can be measured continuously with in-stream sensors, and the measurements can be transmitted via satellite and displayed in near real time on the worldwide web. This technology allows regulators the option of monitoring changes in stream chemistry as they occur, as indicated by surrogate measures of stream chemistry, rather than waiting weeks to months for the results from analytical laboratories. Site characteristics and seasonal variations in streamflow, like ice cover, can affect accuracy of real-time data, and routine visits are still required to check for sensor accuracy. Other constituents of interest with regard to CBM waters in the Powder River Basin include complete ion analyses, particularly sodium and alkalinity, selected nutrients, and trace metals (Montana Department of Environmental Quality, written commun., 2001). Continued monitoring at tributary and mainstem sites in the Powder River Basin is important during the period of CBM production to characterize the effects, if any, CBM discharges have on water resources. |
Streamflow-gaging station 06324970, Little Powder River above Dry Creek
near Weston, Wyo. (site 59) |
|
DeBruin, R.H., Lyman, R.M., Jones, R.W., and Cook, L.W., 2000, Coalbed methane in Wyoming: Wyoming State Geological Survey Information Pamphlet 7, 15 p. Hem, J.D., 1985, Study and interpretation of the chemical characteristics of natural water, 3d ed.: U.S. Geological Survey Water-Supply Paper 2254, 263 p. Lindner-Lunsford, J.B., Parrett, Charles, Wilson, J.F., Jr., and Eddy-Miller, C.A., 1992, Chemical quality of surface water and mathematical simulation of the surface-water system, Powder River drainage basin, northeastern Wyoming and southeastern Montana: U.S. Geological Survey Water-Resources Investigations Report 91-4199, 85 p. Marston, R.A., 1990, Wyoming water atlas: Wyoming Water Development Commission and University of Wyoming, 124 p. Swanson, R.B., Mason, J.P., and Miller, D.T., 2000a, Water resources data, Wyoming, Water Year 1999; volume 2, ground water: U.S. Geological Survey Water-Data Report WY-99-2, 125 p. Swanson, R.B., Smalley, M.L., Woodruff, R.E., and Clark, M.L., 2000b, Water resources data, Wyoming, Water Year 1999; volume 1, surface water: U.S. Geological Survey Water-Data Report WY-99-1, 484 p. |
Streamflow-gaging station 06315480 (discontinued), Poison Creek below
Tetley Spring near Mayoworth, Wyo. (site 26)
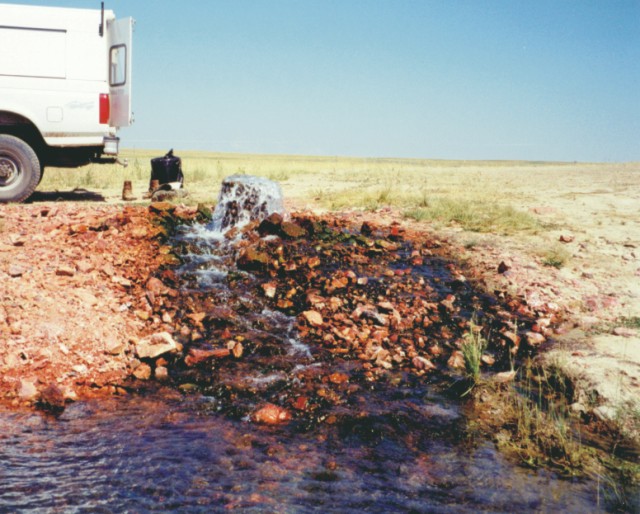
Coalbed methane discharge point in the Powder River Basin |
For copies of this report or additional information, contact:
District Chief
U.S. Geological Survey, WRD
2617 E. Lincolnway, Suite B
Cheyenne, Wyoming 82001-5662
Email: state_rep_wy@usgs.gov
Internet: http://wy.water.usgs.gov/