
In cooperation with the AIR FORCE CENTER FOR ENVIRONMENTAL EXCELLENCE
By John P. Masterson, Kathryn M. Hess, Donald A. Walter, and Denis R. LeBlanc
U.S. Department of the Interior Water-Resources Investigations Report 02-4143
This report is also available in pdf.
|
Continued land development and population growth on western Cape Cod, Massachusetts, and activities related to the operation of the Massachusetts Military Reservation, have created concerns regarding the supply of potable water on western Cape Cod and the quality and quantity of water discharging to ponds, streams, and coastal areas. A three-dimensional ground-water-flow model was developed to simulate the sources of water to these hydrologic features for changing pumping and recharge conditions. |
The only source of freshwater for the communities on western Cape Cod, Massachusetts, is the ground water in the unconfined sand and gravel aquifer under those communities. Freshwater enters the aquifer as recharge at a rate of about 26 inches per year, which is about 55 percent of the total precipitation. This recharge rate yields a total flow through the aquifer of about 180 million gallons per day (Mgal/d) (table 1). Ground water flows radially from the highest point of the water table toward the coast (fig. 1). Water entering near the center of the water-table mound travels deeper through the aquifer than water that recharges near the coast (fig. 2).
|
Table 1. Model-calculated steady-state hydrologic budget for the ground-water-flow system of western Cape Cod, MA, under current (1994–96) pumping conditions [Mgal/d, million gallons per day] |
||
|
|
||
|---|---|---|
| Budget component | Volumetric rate(Mgal/d) | |
|
|
||
| Inflow | ||
| Recharge, precipitation............................................ | 180 | .4 |
| Recharge, wastewater returnflow............................. | 7 | .0 |
| Inflow across eastern boundary ............................... | 4 | .1 |
| Inflow from streams................................................. | 1 | .1 |
| Remediation reinjection........................................... | .2 | |
| Total inflow ......................................................... | 192 | .8 |
| Outflow | ||
| Public-supply withdrawals....................................... | 10 | .0 |
| Remediation extraction............................................ | .2 | |
| Streams .................................................................... | 63 | .0 |
| Coastal discharge..................................................... | 107 | .2 |
| Outflow across eastern boundary............................. | 12 | .4 |
| Total outflow ....................................................... | 192 | .8 |
|
|
||
|
| Figure 1. The water table in the unconfined, shallow, sand and gravel aquifer underlying western Cape Cod, MA, forms a mound that rises more than 60 feet above sea level. Ground water flows radially from the top of the mound to the coast. |
 |
| Figure 2. Recharge from precipitation enters the ground-water-flow system of western Cape Cod, MA, at the water table. Ground-water-flow paths originating near the center travel deeper than those originating closer to the coast. All water entering the flow system that does not discharge to pumping wells will discharge to streams or directly to the coast. |
All of the water that enters the aquifer as recharge ultimately discharges to pumped wells, streams, or coastal areas. Some of this water may flow through kettle-hole ponds on its way to these discharge areas. Understanding the evolution of sources of the water that flows to these discharge areas under changing hydrologic conditions and stresses is needed to help water- resource managers protect the quality of the drinking water and the natural water resources of western Cape Cod.
The U.S. Geological Survey, in cooperation with the Air Force Center for Environmental Excellence, developed a three-dimensional ground-water-flow model to simulate sources of water to public-supply wells, ponds, streams, and coastal areas for average and changing pumping and recharge conditions. This report summarizes the major results; Masterson and others (1998) and Masterson and Walter (2000) contain more detailed information on the model development and analysis.
All water that discharges to pumped wells on western Cape Cod originates as precipitation that recharges the aquifer at the water table. The area at the water table that contributes water to a pumped well is designated as the recharge area for that well. This area is delineated such that the amount of water entering the aquifer through this area equals the amount of ground water discharging to the well when the flow system is in equilibrium. This equilibrium is known as the steady-state condition (fig. 3). This same concept can be applied to any hydrologic feature that receives ground-water discharge, such as kettle-hole ponds, streams, and coastal areas. The discharge location of all water that enters the aquifer can be determined once the recharge areas to all hydrologic features are delineated (fig. 4).
 |
| Figure 3. The area at the water table contributing recharge to the pumped well can be delineated (modified from Reilly and Pollock, 1993). The area can be disconnected from the well site in map view. The location and appearance of the recharge area depend on the pumping rate, slope of the water table, and depth of the well screen below the water table. |
 |
| Figure 4. All water in the ground-water-flow system of western Cape Cod, MA, can be tracked from where it enters as recharge across the water table to its discharge location at a pumped well, stream, pond, or coastal area. These recharge areas were delineated by use of a steady-state ground-water-flow model (Masterson and Walter, 2000). |
Many factors, including the proximity of other pumped wells, affect the location, size, and shape of a recharge area to a public-supply well. For example, two potential well sites northeast of the Massachusetts Military Reservation Impact Area are along a ground- water flow line; Well A is downgradient of Well B (fig. 1). If only Well A is pumped, the simulated recharge area to the well has an elliptical shape aligned in the direction of flow (fig. 5A). If Well B also is pumped, then the recharge area to Well A splits around the recharge area to Well B (fig. 5B). This example illustrates that if a new well is pumped upgradient of an existing well, then the recharge area to the existing well will change so that enough water is provided at the water table to satisfy its pumping rate. Under steady-state conditions, recharge areas to two different pumped wells cannot overlap.
 |
| Figure 5. Recharge areas to proposed public-supply wells are delineated for two scenarios by use of a steady-state ground-water-flow model: (A) Well A pumping at 600 gallons per minute, and (B) Wells A and B both pumping at 600 gallons per minute. In scenario B, the recharge area to Well A splits around the recharge area to Well B and includes the eastern part of the Impact Area on the MMR, Cape Cod, MA. |
The sources of water to surface-water bodies, such as ponds, streams, and coastal areas, differ from that of pumped wells. Natural discharge areas do not have a fixed rate that must be met by corresponding recharge at the water table; therefore, changes in the hydrologic system may result in changes in the discharge rate to these areas and subsequent changes to the source of water to these areas.
Kettle-hole ponds are a unique hydrologic feature in this ground-water-flow system because they receive ground-water discharge and are a source of ground-water recharge. Ground water flows into the upgradient side of kettle-hole ponds. This water, however, is not removed from the flow system. It mixes within the pond and either re-enters the aquifer through the downgradient side of the pond or flows into streams that drain the pond. The pond water that re-enters the aquifer ultimately discharges to public-supply wells, streams, or coastal areas down- gradient of the kettle-hole ponds. Kettle-hole ponds represent about 5 percent of the surface area of western Cape Cod, yet about 21 percent of the total flow in the ground- water system moves through the ponds (fig. 4; Masterson and Walter, 2000).
In the town of Sandwich (fig. 1), about 0.6 Mgal/d of water currently (1996) is pumped from five public-supply wells near three large kettle-hole ponds (fig. 6A). If pumping rates increase and two additional wells are added, such that the total withdrawal is about 3.9 Mgal/d (as was proposed for the year 2020), water that otherwise would have discharged to the ponds (fig. 7A) will be captured by the wells (fig. 7B). Consequently, the pond levels will decline 2 to 3 feet (ft), recharge areas to the ponds will shrink (fig. 6B), and the flow through the ponds will proportionally decrease by the increased amount of pumping.
 |
| Figure 6. Increased pumping for public water supply proposed for the year 2020 in Sandwich, MA, could reduce the recharge area to three nearby ponds and lower pond levels 2 to 3 feet according to results from a steady-state ground-water-flow model: (A) current pumping conditions (1994–96) and (B) future pumping conditions (2020). |
 |
| Figure 7. Pumping from ground water can affect discharge to nearby surface-water bodies. In the pre-pumping condition (A), water flows to the surface-water body. Pumping at a specified rate (B), reduces discharge to the surface-water body. When the pumping rate is increased (C), the flow direction reverses and water from the surface-water body is pumped directly from the well (Modified from Alley and others, 1999). |
If the amount of pumping from wells upgradient of discharge areas becomes large enough, the additional pumping can reverse the ground-water-flow direction and draw water directly from the surface-water bodies to the pumped well (fig. 7C), which typically results in a reduction in streamflow and pond levels. Pumping upgradient of coastal areas can change the salinity in coastal estuaries by reducing the flow of fresh ground water to the estuary, and can affect the position of the interface between freshwater and saltwater in the aquifer, resulting in saltwater encroachment. These potential hydrologic effects of pumping on ponds, streams, and coastal areas are mitigated in some situations by returning the pumped water to the aquifer after use and disposal through septic, infiltration, and other engineered systems.
A ground-water-flow model was used to delineate how the source of water to a pumped well changes after pumping begins, ultimately reaching a steady-state configuration. Typically, sources of water to pumped wells are delineated for steady-state conditions, which assume that the ground-water-flow system is in equilibrium with respect to the pumping stress and that the delineated recharge area does not change over time. The steady-state recharge area will represent the actual source of water to the well only after all of the water pumped from the well consists of water that entered the aquifer after the pumping starts.
The time from when pumping begins until the final steady-state configuration is reached is referred to as the transient-flow condition. The transient recharge area, which is determined for a specified pumping time, consists of two parts—the area that contributed water that entered the aquifer before pumping started, and the area that contributed water that entered the aquifer after pumping started.
Initially, the water that discharges to a pumped well over a specified period of time consists of a blend of waters that entered the aquifer over time. When pumping begins, a deep well initially may capture water that entered the aquifer many years earlier at a great distance from the well. For example, the water that discharged to Well A after 1 day of pumping entered the aquifer some distance from the pumping well (fig. 8), and included a blend of water that entered the aquifer between 30 and 61 years before pumping started. During the first year of pumping, the well captured water that entered the aquifer between 2 and 100 years before pumping started (fig. 8); none of the water pumped from the well during this first year entered the aquifer after pumping already had started.
 |
| Figure 8. Extent of steady-state recharge area and the transient recharge areas to Well A in the northern part of the MMR, Cape Cod, MA, after 1 day and 1 year of pumping at 600 gallons per minute. During the first day of pumping the water that discharged to Well A entered the aquifer some distance from the well and included a blend of water that entered the aquifer between 30 and 61 years before pumping started. As pumping time increased to 1 year, the transient recharge area became larger and included a blend of water that entered the aquifer between 2 and 100 years before pumping started. |
After 10 years of pumping, about 30 percent of the water pumped from the well (fig. 9) had entered the aquifer since pumping started. The remaining 70 percent of the water pumped from the well had entered the aquifer and flowed toward the well before pumping started (fig. 9). It is not until about 270 years of pumping before all of the water pumped from the well is derived from recharge that entered the aquifer since pumping started. Once this occurs, the transient and steady-state recharge areas are the same, and the steady-state time-of-travel zones shown in figure 10 represent the time for ground- water recharge to reach the pumping well from specified areas within the two-dimensional recharge area delineated at the water table.
 |
| Figure 9. Total transient recharge to Well A in the northern part of the MMR, Cape Cod, MA, after 10 years of pumping and the portion of that area that contributes recharge since the start of pumping. After 10 years of pumping, only 30 percent of the water that discharged to the well had entered the aquifer after pumping started. The remaining 70 percent of the water that discharged to the well had entered the aquifer and flowed toward the well before pumping started. |
 |
| Figure 10. Steady-state recharge area and time-of-travel zones for Well A in the northern part of the MMR, Cape Cod, MA, pumping at 600 gallons per minute. After 270 years of pumping, all of the water that discharges to the well entered the aquifer after pumping started. The time-of-travel zones represent the travel times from the water table to the pumping well for steady-state conditions. |
Recharge areas were determined for Well A and Well B for 10, 20, and 30 years of pumping (fig. 11). The source of water to Well A with both wells pumping for 10 years (fig. 11A) is similar to the recharge area determined for Well A without Well B pumping (fig. 9). The area through which recharge water entered the aquifer before pumping started and then discharged to Well A overlaps the portion of the recharge area to Well B that contributed water since pumping began 10 years ago (fig. 11A). This overlap indicates that the same area has contributed water to both wells, but the water entered the aquifer at different times. Simulated travel times for water originating in the overlapping area show that water pumped from Well A entered the aquifer between 20 and 40 years ago, whereas water pumped from Well B entered the aquifer less than 10 years ago.
 |
| Figure 11. Total transient recharge areas to Wells A and B in the northern part of the MMR, Cape Cod, MA, and the areas that contribute recharge since pumping began after (A) 10, (B) 20, and (C) 30 years of pumping. The areas that contribute recharge since pumping started cannot overlap. Over time the portion of each transient recharge area that contributed water to the well since pumping started will approach the steady-state recharge area shown in figure 5. |
In the model simulation, the portion of the transient recharge area to Well A that contributed water to the well since pumping started approached the location of Well B after 20 years of pumping, and the total transient recharge area (fig. 11B) became wider than that determined for steady-state conditions (fig. 5A). After 30 years, the total transient recharge area to Well A split around the portion of the transient recharge area to Well B that contributed water to the well since pumping started (fig. 11C). As previously noted, the same area at the water table can provide water to both pumping wells but for different time periods. The portions of these transient recharge areas that contributed water to the wells since pumping started (shaded areas shown in fig. 11) cannot overlap because they represent the areas that contributed water to the wells for the same period after pumping began.
The split that developed after 30 years of pumping in the portion of the transient recharge area that contributed water to Well A since pumping began indicates that all of the water that entered the aquifer near Well B before pumping started reached Well A within 30 years of pumping (fig. 11C). After 30 years of pumping, all new recharge water that enters the aquifer in this area will discharge only to Well B. Over time, the portion of the transient recharge areas that contributed water to the wells since pumping started will approach the steady-state recharge areas shown in figure 5B. It is not until the flow system has reached equilibrium in response to the new pumping stress that the source of water to the wells is equal to the recharge areas shown in figure 5B.
Determining the sources of water to pumped wells,ponds, streams, and coastal areas is complicated by the interconnection of these hydrologic features through the ground-water-flow system. Any changes in the flow system that affect the area at the water table from which recharge water flows to a discharge point also may affect the source of water to other discharge points. For example, a change in the pumping rate in a well may affect the recharge area of a nearby pond. This change in the recharge to a pond could result in a decline in the pond level, which in turn could result in reduced outflow to an adjoining stream. This reduction in streamflow then may increase the salinity of a coastal estuary, which relies on streamflow as a major source of freshwater inflow.
Numerical models can be useful tools for delineating ground-water-recharge areas in complex, three-dimensional flow systems. Steady-state recharge areas, such as those shown in figure 4, are valid only for the specific pumping and recharge conditions used in the analysis. When pumping and recharge conditions change, the numerical model can be used to evaluate changes in the recharge areas to pumped wells, ponds, streams, and coastal areas because of the new hydrologic conditions.
In hydrologic settings, such as the shallow unconfined sand and gravel aquifer of western Cape Cod, contaminants can be transported over great distances for many years without appreciable decreases in contaminant concentrations (LeBlanc, 1984). It is necessary, therefore, to understand how the recharge areas to pumped wells change with time, and to know the location and loading history of suspected contaminant source to determine how ground-water contamination potentially affects the water quality in pumping wells. The single deep pumping well example (fig. 8) illustrates that when pumping begins, a deep well initially may capture water that entered the aquifer many years earlier at a large distance from the well. It is possible that if contamination began flowing far upgradient of this pumping well, and many years before pumping started, the water quality in the well could be affected shortly after pumping started from an area at the water table that under steady-state conditions would take many years to reach the well. Because of this possibility, determining the source of water discharging to a well for specified pumping times may be more important for protecting public-water supplies than determining only the steady-state recharge area and time-of-travel zones to the well.
The U.S. Geological Survey, in cooperation with the Air Force Center for Environmental Excellence, developed a three-dimensional ground-water-flow model to simulate sources of water to public-supply wells, ponds, streams, and coastal areas for average and changing pumping and recharge conditions on western Cape Cod, Massachusetts. Understanding the changing sources of water that flows to these discharge areas under changing hydrologic conditions and stresses is needed to help water-resource managers protect the quality of the drinking water and the water resources of western Cape Cod.
The interconnection of hydrologic features through the ground-water-flow system on Cape Cod complicates the determination of the sources of water for changing pumping and recharge conditions. When pumping and recharge conditions change, the numerical model can help evaluate changes in the recharge areas to pumped wells, ponds, streams, and coastal areas.
The steady-state recharge area and time-of-travel zones to a pumping well represent the source of water and time of travel from the water table to the well once all of the water discharging to the well entered the aquifer after pumping began. Initially, the water that discharges to a pumped well over a specified period consists of a blend of waters that entered the aquifer over time. When pumping begins, a deep well may capture water that entered the aquifer many years earlier at a great distance from the well; therefore, determining the source of water discharging to a well for specified pumping times may be more important for protecting public-water supplies than determining only the steady-state recharge area and time-of-travel zones to the well.
Alley, W.M., Reilly, T.E., and Franke, O.L., 1999, Sustainability of ground-water resources: U.S. Geological Survey Circular 1186, 79 p.
LeBlanc, D.R., 1984, Sewage plume in a sand and gravel aquifer, Cape Cod, Massachusetts: U.S. Geological Survey Water-Supply Paper 2218, 28 p.
Masterson, J.P., and Walter, D.A., 2000, Delineation of ground-water recharge areas, western Cape Cod, Massachusetts: U.S. Geological Survey Water- Resources Investigations Report 00-4000, 1 pl.
Masterson, J.P., Walter, D.A., and LeBlanc, D.R., 1998, Delineation of contributing areas to selected public- supply wells, western Cape Cod, Massachusetts: U.S. Geological Survey Water-Resources Investigations Report 98-4237, 45 p.
Reilly, T.E., and Pollock, D.W., 1993, Factors affecting areas contributing recharge in shallow aquifers: U.S. Geological Survey Water-Supply Paper 2412, 21 p.
Savoie, Jennifer, 1995, Altitude and configuration of the water table, western Cape Cod aquifer, Massachusetts, March 1993: U.S. Geological Survey Open-File Report 94-462, 1 pl.
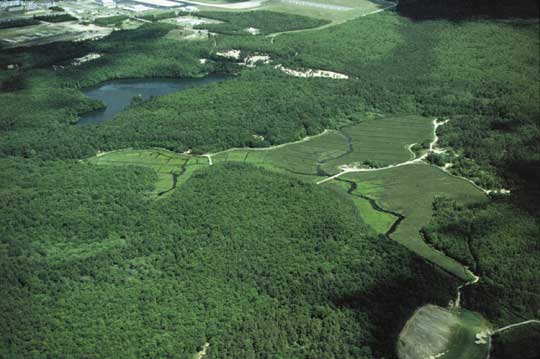 |
| Surface-water bodies, such as ponds and streams, are interconnected through the ground-water-flow system on western Cape Cod. Aerial view northward of Quashnet River surrounded by cranberry bogs near Moody Pond and the airfield of the Massachusetts Military Reservation. Photo by Denis LeBlanc. |
|
U.S. DEPARTMENT OF THE INTERIOR GALE A. NORTON, Secretary U.S. GEOLOGICAL SURVEY Charles G. Groat, Director |
|
|
For addtional information write to:
Chief, Massachusetts-Rhode Island District U.S. Geological Survey Water Resources Discipline 10 Bearfoot Road Northborough, MA 01532
or visit our Web site at:
|
Copies of this report can be purchased from:
U.S. Geological Survey Branch of Information Services Box 25286 Denver CO 80225-0286
or though the Web at
|
Front cover banner art modified from digital image accessed September 27, 2002,
at http://spaceflight.nasa.gov/history/shuttle-mir/multimedia/sts-71-photos/71p-050.htm
The text and graphics are presented here in pdf format (print quality):
If you have Adobe Acrobat Reader installed on your computer, you may view and/or print the PDF version of this report. If you do not have Acrobat Reader, you may download it here.
| AccessibilityFOIAPrivacyPolicies and Notices | |
 |
|