Figures
|
| Click image for a larger version. The
figures are also presented in PDF (pdf) or JPEG (jpg) format. If you have Adobe Acrobat Reader installed on your computer,
you may view and/or print the PDF version of these tables. If
you do not have Acrobat Reader, you may download it here.
|
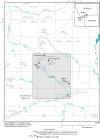 |
Figure 1. Location of study area, Montana. (click
here for pdf file) |
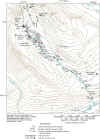 |
Figure 2. Location of sampling sites in the Miller
Creek watershed, Montana. (click
here for pdf file) |
|
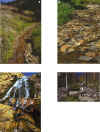
Figure 3. The diverse character of the streambed in the
Miller Creek watershed, Montana: A.
Upper study reach (site 190) where the channel is composed of
gravel and cobbles. B. Near mid-basin (site 7,120) where the channel is composed
mostly of large cobbles and scattered boulders.
C. Near the downstream
end of the lower study reach (site 14,505) where a small waterfall exists
on exposed bedrock.
D. At the downstream
end of the study reach (site 14,930) where the channel is composed of
cobbles, boulders, and woody debris. Photographs A and D by D.A. Nimick; photographs B and C by
J.H. Lambing, U.S. Geological Survey. (click
here for jpg file) |
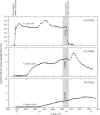 |
Figure 4.
Temporal profiles of chloride concentration at tracer-monitoring sites
on Miller Creek, Montana, August 28-31, 2000. (click
here for pdf file) |
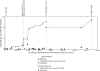 |
Figure 5. Downstream profile of streamflow at synoptic-sampling sites in
the Miller Creek watershed, Montana, August 30, 2000. (click
here for pdf file) |
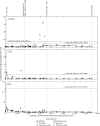 |
Figure 6.
Concentration profiles of dissolved and total-recoverable copper,
total-recoverable lead, and dissolved and total-recoverable zinc in water
samples collected in the Miller Creek watershed, Montana, August 30, 2000.
Aquatic-life standards from Montana Department of Environmental
Quality (1999) are applicable to total-recoverable concentrations. Standards
have been adjusted for a hardness of 100 mg/L CaCO3.
(click here for pdf file) |
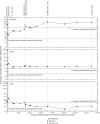 |
Figure 7. Concentration
profiles of leachable copper, lead, and zinc in streambed-sediment samples
collected in the Miller Creek watershed, Montana, August 28-31, 2000.
Canadian interim sediment quality guidelines (ISQG) and probable
effect levels (PEL) typically are used to compare concentrations of
elements in bulk sediment (Canadian Council of Ministers of the
Environment, 1998) and are shown here for general comparison only; samples
in this study were sieved to 2 millimeters and the fine fraction analyzed.
(click here for pdf file) |
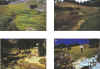 |
Figure 8. Possible
sources of metals to Miller Creek, Montana:
A. The Black Warrior Mine located in the upper study reach.
B. A natural
ferricrete deposit adjacent to Miller Creek, near site 1,850.
C. Mine waste at
Miller Creek dump 1. D.
Left-bank inflow (site 6,465), with aluminum staining near the
middle of the study reach. This
inflow had the highest total-recoverable copper concentration of any site
sampled in the Miller Creek watershed during this study.
Photographs by D.A. Nimick. (click
here for jpg file) |
Previous: Summary
Next: Tables
|