|
|
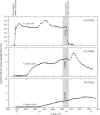
StreamflowStreamflow is an important component to determine for surface-water-quality studies because it gives insight to hydrologic processes that influence geochemical reactions and is necessary to accurately quantify the transport of constituent loads through the watershed. Tracer-injection methods, which use the principle of conservation of mass to calculate streamflow at synoptic sampling sites, represent an alternative to traditional current-meter methods for determining streamflow in mountain streams, particularly where traditional methods are hampered by irregular channel cross sections and turbulent flow (Kimball, 1997). Tracer-injection methods also account for the portion of flow that moves through the gravels and cobbles (hyporheic flow). This hyporheic flow cannot be measured by current-meter methods; therefore, loads would be underestimated using streamflow values obtained by current-meter measuring techniques if hyporheic flow were a substantial portion of the total streamflow. Another advantage of the tracer-injection method is that synoptic samples for determination of streamflow can be collected at numerous sites more quickly than streamflow can be measured with a current-meter. Thus, streamflow can be characterized at many sites in a stream reach in less time using the tracer-injection method, thereby minimizing the potential effect of temporal changes in streamflow that could complicate comparisons of concentrations or loads between sites. Chloride is a commonly used constituent for tracer studies because it is chemically conservative, inexpensive, and relatively benign to aquatic biota. Information on the movement of the chloride tracer was gained by constructing temporal concentration profiles that show the change in chloride concentration with time at each tracer-monitoring site (fig. 4). Ideal temporal concentration profiles of an injected tracer have three distinct regions that show the arrival, plateau (or equilibrium) conditions, and departure of the tracer. If equilibrium has been established, then a steady-state plateau will be evident at each tracer-monitoring site. When the stream is at equilibrium with the injected tracer, synoptic samples are collected at many points along the stream resulting from inflows. If equilibrium has been achieved, downstream changes in chloride concentration will be due to changes in streamflow.
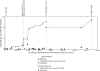
The first tracer-monitoring site (T-1) was at site 190 (fig. 2), just downstream from the tracer injection. Chloride concentrations rapidly increased at T-1 as the injected tracer arrived and most likely established equilibrium with streamflow shortly after the injection began. The chloride concentrations at T-1 increased during the day (0900 to 1700 hours) as streamflow decreased, presumably due to evapotranspiration along the valley floor. Chloride concentrations then decreased through the evening to the following morning (1700 to 0800). After 0800 on August 30, chloride concentrations were generally stable for several hours, which corresponded to the period of synoptic sampling in the upper reach. The second tracer-monitoring site (T-2) was located at site 7,120 (or historical site SW-2, fig. 2) near the middle of the study reach. Arrival of the tracer at T-2 was not evident until about 10 hours after the tracer was started (fig. 4). After the tracer reached T-2 on August 29, chloride concentrations increased for about 16 hours from 0000 to 1600 hours. Around 1600 hours the tracer concentrations at T-2 started to decrease slightly. This decrease coincided with the decrease at T-1 and was likely caused by an increase in streamflow associated with a diel cycle. Tracer concentrations at T-2 did not decrease as sharply as at T-1, likely because the tracer had not reached plateau conditions and concentrations were still increasing from the injection. From about 0100 to 0800 on August 30, tracer concentrations again increased at T-2, indicating that the tracer concentration at T-2 had not reached equilibrium. At around 0800 hours on August 30, a plateau apparently was established at T-2, and tracer concentrations were relatively stable during the entire synoptic sampling period, from 0835 to 1400 hours. Shortly after the synoptic sampling was completed, the tracer concentrations at T-2 significantly increased at about 1800 hours. This increase may possibly be due to a decrease in streamflow during the warm part of the day, but the magnitude of the increase may also be anomalously large. The third tracer-monitoring site (T-3) at site 14,930 was at the downstream end of the study reach (fig. 2). Arrival of the tracer at T-3 was not evident until about 22 hours after the tracer was started (fig. 4). After the 22-hour time lag, tracer concentrations at T-3 steadily increased for the remainder of the study, indicating that equilibrium at T-3 was not reached during the synoptic-sampling period. Since equilibrium was not established at T-3, streamflow could not be calculated using tracer-injection methods between T-2 and T-3. However, streamflow on the mainstem was physically measured at T-2 and at two sites downstream from T-2 (table 2, fig. 5). In addition, inflows throughout the study reach were measured using either traditional current-meter methods or volumetrically. Streamflow values calculated by the tracer-injection method from site 0 to 7,120 (T-2) are shown in figure 5 and presented in table 2. Surface inflows to Miller Creek were assumed to be equal to the difference in tracer-calculated streamflow between the mainstem sites immediately downstream and upstream from the inflow.
Where both methods were used, tracer-calculated flows were greater than the physically measured flows at each surface-inflow site, except for site 4,680. The differences between these values may represent the amount of subsurface (hyporheic) flow that is moving through the streambed substrate and, therefore, is not measurable by traditional current-meter methods. However, some differences, particularly the large differences at sites 3,205 and 3,915, may represent the uncertainty of streamflow calculated by the tracer-injection method in the reach between tracer-monitoring sites T-1 and T-2. In the lower part of the study reach, current-meter measurements were conducted at two stream sites during the tracer injection (fig. 5). Because streamflow was determined using both methods at site 7,120, the relative difference in results can serve as an estimate of hyporheic flow at the lower two sites. Comparing the two values at site 7,120 indicates that about 20 percent of the total streamflow may be hyporheic flow. This difference is comparable in magnitude to values reported in similar studies (Kimball, 1997; Kimball and others, 1999; and Cleasby and others, 2000). By comparing the results for this and other tracer-injection studies, the total streamflow (surface plus hyporheic) at mainstem sites 13,165 and 14,930 (also measured using current meters) was likely in the range of 20 percent greater than the current-meter measurement values shown on figure 5. Streamflow values in the East Fork watershed were measured by current meter or volumetrically (table 2). Water from a spring entered the East Fork about 1,100 upstream from its confluence with Miller Creek (site E0, table 1). Upstream from the spring the channel was dry. An increase in streamflow of about 2.8 L/s was measured from site E0 (immediately below the spring) to the mouth of East Fork Miller Creek, site 3,205. |
|
Home page for USGS Water Resources Investigations Report 02-4148
|
| AccessibilityFOIAPrivacyPolicies and Notices | |
 |
|