
Figure 1. The Fraser River Basin.
Figure 2. Spatial distribution and magnitude of median concentrations of se...
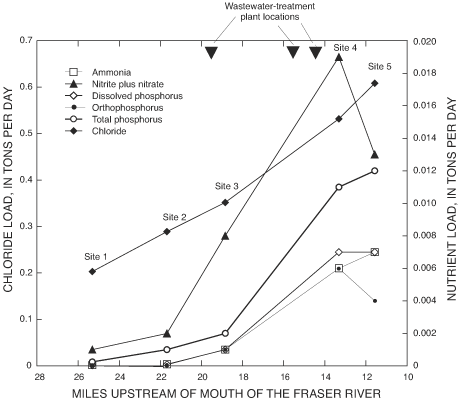
Figure 3. Downstream median instantaneous load of selected constituents in ...
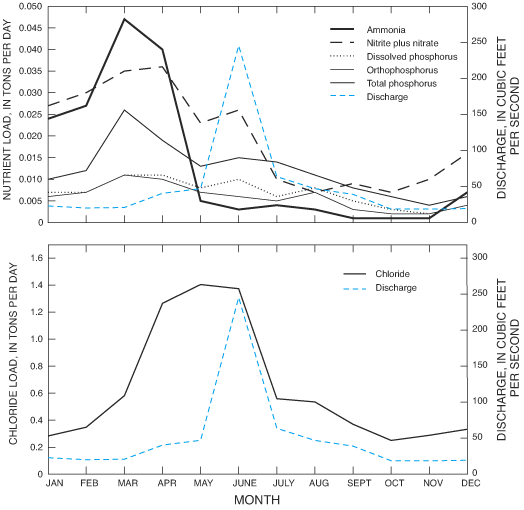
Figure 4. Median instantaneous load for each month of selected constituents...
Table 1. Characteristics of selected streamwater-quality sites in the Frase...
Table 2. Summary of median values of field-determined constituents at 13 si...
Table 3. Summary of median concentrations of selected water-quality constit...
Table 4. Results of the seasonal Kendall test for trends on selected nutrie...
To determine the effect of population growth on streamwater quality in the Fraser River Basin, the U.S. Geological Survey did a study in cooperation with the Grand County Commissioners and the East Grand County Water Quality Board. During water years 1991 through 2000, the study determined that concentrations of un-ionized ammonia and nitrite plus nitrate in the streamwater of the basin are within Colorado State streamwater–quality standards. The study also found that concentrations of chloride are largest at the headwaters and decrease downstream; however, chloride loading in the stream has the opposite relation. Most nutrient loading to the Fraser River happens January through May. Concentrations of ammonia at Fraser River downstream from Vasquez Creek at Winter Park had a downward trend through the period of the study. Nitrite plus nitrate had upward and downward trends at different sites and over different time spans. Orthophosphorus concentrations had upward trends at two sites. In general, the streamwater quality in the Fraser River Basin is good and is not out of compliance with State standards.
The Fraser River Basin in the southeastern part of Grand County, Colorado, encompasses about 287 square miles (fig. 1). The Fraser River originates at the Continental Divide in the Arapaho National Forest, flows about 29 miles in a northerly direction through the towns of Winter Park, Fraser, Tabernash, and Granby, and joins the Colorado River 2 miles downstream from Granby. A more detailed discussion of the characteristics of the Fraser River Basin is found in Apodaca and Bails (1999). The population of Grand County increased more than 56 percent between 1990 and 2000 (2000 census population of 12,442) and increased more than 300 percent since 1970 (U.S. Census Bureau, 2001). These population statistics do not include the thousands of people that visit the Fraser River Basin each year to enjoy the many year-round recreational activities and place demands on the water resources of the basin. The Fraser River upstream from the town of Tabernash is currently the recipient of wastewater discharges from three wastewater-treatment plants that serve the Winter Park ski area, the town of Winter Park, and the town of Fraser (fig. 1). Local water managers are concerned about the effects of population growth on streamwater quality. To address this need, the U.S. Geological Survey, in cooperation with the Grand County Commissioners and the East Grand County Water Quality Board, conducted a study of streamwater quality in the Fraser River Basin.
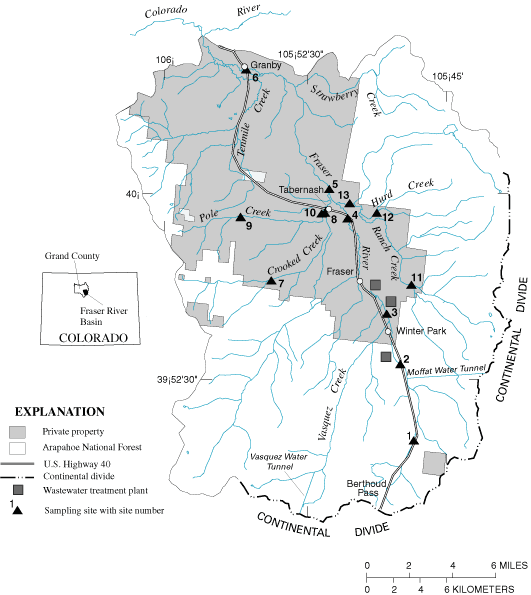
Figure 1. The Fraser River Basin.
The land-surface elevation of the Fraser River Basin ranges from about 12,500 feet at Berthoud Pass to about 7,860 feet at the mouth of the Fraser River. The major tributaries to the Fraser River are Vasquez, St. Louis, Crooked, Ranch, Strawberry, and Tenmile Creeks. In the upper reaches of the Fraser River, three hydrologic modifications divert water from St. Louis Creek, Vasquez Creek, and the main stem of the Fraser River to the Moffat Water Tunnel system. According to the Colorado Water Quality Control Division (1989), these diversions have the potential to reduce streamflow substantially and compound water-quality problems in the Fraser River Basin.
Climatic data for Fraser from 1989 through the end of 2000 indicate that the average monthly maximum and minimum temperatures are 75.7 degrees Fahrenheit in July and –3.9 degrees Fahrenheit in December. Average annual precipitation for Fraser is 19.2 inches, which includes an average annual snowfall of 154 inches. At Berthoud Pass, the headwaters of the Fraser River, the average annual precipitation from 1950 through 1985 is 37.5 inches, which includes an average annual snowfall of 391 inches (Western Regional Climate Center, 2001).
This report presents an overview of the general streamwater quality at 13 sites in the Fraser River Basin during water years 1991–2000, and focuses primarily on chloride, nutrient, pH, dissolved oxygen, and fecal coliform bacteria data (a water year is defined as the 12-month period from October 1 through September 30 of the named year). Data from these sites were compared to Colorado's current State stream-segment water-quality standards (hereinafter referred to as "State standards") for the Fraser River established by the Colorado Water Quality Control Commission (2001). Under these guidelines, the Fraser River and its tributaries are under the designations of the Upper Colorado River segments 9 and 10. The data were compared spatially in downstream order and assessed for trends at selected sites that had at least 5 years of monthly data.
Water-quality data were collected between October 1, 1990, and September 30, 2000, at 13 stream sites (fig. 1, tables 1, 2, and 3). These sites include six sites on the main stem of the Fraser River, four sites on Crooked and Pole Creeks, and three sites on Ranch and Hurd Creeks. Three sites have data spanning the entire period of record while the other sites have partial records (table 1). All data for this report were collected and analyzed by the U.S. Geological Survey using methods described in Fishman (1993) and Fishman and Friedman (1989). Water-quality samples were collected using the equal-width increment (EWI) method and processed using steps outlined in the U.S. Geological Survey National Field Manual (U.S. Geological Survey, 1999).
Table 1. Characteristics of selected streamwater-quality sites in the Fraser River Basin.
[USGS, U.S. Geological Survey]
| Site number (fig. 1) | Site name | USGS station identification number | Period of record in water years1 | Elevation, in feet above sea level |
|---|---|---|---|---|
| Fraser River | ||||
| 1 | Fraser River at Upper Station, near Winter Park, CO | 09022000 | 1994–2000 | 9,520 |
| 2 | Fraser River below Buck Creek at Winter Park, CO | 09023750 | 1991–2000 | 9,020 |
| 3 | Fraser River below Vasquez Creek at Winter Park, CO | 09025010 | 1991–2000 | 8,710 |
| 4 | Fraser River at Tabernash, CO | 09027100 | 1991–2000 | 8,350 |
| 5 | Fraser River below Crooked Creek at Tabernash, CO | 09033300 | 1991–1994 1999–2000 | 8,270 |
| 6 | Fraser River at Highway 40 at Granby, CO | 400453105554200 | 2000 | 7,920 |
| Crooked and Pole Creeks | ||||
| 7 | Crooked Creek below Tipperary Creek near Tabernash, CO | 395634105532401 | 1997–2000 | 8,690 |
| 8 | Crooked Creek above Pole Creek at Tabernash, CO | 395927105505700 | 2000 | 8,360 |
| 9 | Pole Creek at Upper Station near Tabernash, CO | 395901105550800 | 1997–2000 | 8,640 |
| 10 | Pole Creek at mouth near Tabernash, CO | 395930105510700 | 1997–2000 | 8,320 |
| Ranch and Hurd Creeks | ||||
| 11 | Ranch Creek near Fraser, CO | 09032000 | 1997–2000 | 8,660 |
| 12 | Hurd Creek below Trail Creek near Tabernash, CO | 395947105481000 | 1999–2000 | 8,860 |
| 13 | Ranch Creek below Meadow Creek near Tabernash, CO | 09033100 | 1997–2000 | 8,350 |
1A water year is the 12-month period from October 1 until September 30 of the named year.
[ft3/s, cubic feet per second; mg/L, milligrams per liter; cols/100ml, colonies per 100 milliliters; μS/cm, microsiemens per centimeter at 25 degrees Celsius; <1, not detected; --, no data]
| Site number (fig. 1) | Site name | Discharge (ft3/s) | pH | Dissolved oxygen (mg/L) | Fecal coliform bacteria (cols/100ml) | Specific conductance (μS/cm) |
|---|---|---|---|---|---|---|
| 1 | Fraser River at Upper Station, near Winter Park, CO | 6.2 | 8.1 | 10.0 | -- | 84 |
| 2 | Fraser River below Buck Creek at Winter Park, CO | 7.6 | 8.0 | 9.9 | -- | 91 |
| 3 | Fraser River below Vasquez Creek at Winter Park, CO | 19 | 7.9 | 10.0 | -- | 78 |
| 4 | Fraser River at Tabernash, CO | 28 | 8.0 | 9.9 | -- | 97 |
| 5 | Fraser River below Crooked Creek at Tabernash, CO | 48 | 8.2 | 9.8 | 17 | 119 |
| 6 | Fraser River at Highway 40 at Granby, CO | 47 | 8.1 | 10.3 | <1 | 120 |
| 7 | Crooked Creek below Tipperary Creek near Tabernash, CO | 2.2 | 8.1 | 9.8 | <1 | 174 |
| 8 | Crooked Creek above Pole Creek at Tabernash, CO | 4.3 | 8.1 | 10.1 | 5 | 218 |
| 9 | Pole Creek at Upper Station near Tabernash, CO | 0.9 | 8.0 | 9.2 | 3 | 125 |
| 10 | Pole Creek at mouth near Tabernash, CO | 2.3 | 8.1 | 9.6 | <1 | 274 |
| 11 | Ranch Creek near Fraser, CO | 4.2 | 8.0 | 10.4 | <1 | 48 |
| 12 | Hurd Creek below Trail Creek near Tabernash, CO | 3.4 | 7.8 | 10.5 | <1 | 43 |
| 13 | Ranch Creek below Meadow Creek near Tabernash, CO | 14.2 | 8.0 | 9.8 | 2 | 76 |
[mg/L, milligrams per liter]
| Site number (fig. 1) | Site name | Chloride (mg/L) | Ammonia (mg/L) | Nitrite plus nitrate (mg/L) | Dissolved phosphorus (mg/L) | Orthophosphorus (mg/L) | Total phosphorus (mg/L) |
|---|---|---|---|---|---|---|---|
| 1 | Fraser River at Upper Station, near Winter Park, CO | 9.782 | 0.002 | 0.084 | 0.003 | 0.001 | 0.050 |
| 2 | Fraser River below Buck Creek at Winter Park, CO | 8.370 | 0.003 | 0.075 | 0.004 | 0.002 | 0.050 |
| 3 | Fraser River below Vasquez Creek at Winter Park, CO | 5.40 | 0.018 | 0.127 | 0.012 | 0.009 | 0.050 |
| 4 | Fraser River at Tabernash, CO | 4.835 | 0.065 | 0.169 | 0.062 | 0.051 | 0.102 |
| 5 | Fraser River below Crooked Creek at Tabernash, CO | 3.48 | 0.034 | 0.085 | 0.031 | 0.027 | 0.059 |
| 6 | Fraser River at Highway 40 at Granby, CO | 4.010 | 0.030 | 0.140 | 0.040 | 0.040 | 0.060 |
| 7 | Crooked Creek below Tipperary Creek near Tabernash, CO | 0.280 | 0.004 | 0.006 | 0.007 | 0.005 | 0.041 |
| 8 | Crooked Creek above Pole Creek at Tabernash, CO | 2.915 | 0.007 | 0.005 | 0.015 | 0.010 | 0.041 |
| 9 | Pole Creek at Upper Station near Tabernash, CO | 0.380 | 0.005 | 0.008 | 0.017 | 0.013 | 0.050 |
| 10 | Pole Creek at mouth near Tabernash, CO | 2.04 | 0.008 | 0.025 | 0.021 | 0.017 | 0.051 |
| 11 | Ranch Creek near Fraser, CO | 0.251 | 0.002 | 0.033 | 0.004 | 0.003 | 0.030 |
| 12 | Hurd Creek below Trail Creek near Tabernash, CO | 0.405 | 0.004 | 0.005 | 0.004 | 0.002 | 0.050 |
| 13 | Ranch Creek below Meadow Creek near Tabernash, CO | 0.515 | 0.003 | 0.035 | 0.012 | 0.007 | 0.050 |
Water samples were analyzed for dissolved chloride, dissolved or total ammonia, dissolved or total nitrite plus nitrate, dissolved and total phosphorus, dissolved orthophosphorus, and fecal coliform bacteria. Properties measured at the time of sample collection include water temperature, pH, specific conductance, and dissolved oxygen. The dissolved phase of water-quality constituents was obtained by filtering sampled water through a 0.45-μm (micrometer) filter; total concentrations are from unfiltered samples. Nutrient samples (ammonia, nitrite plus nitrate, phosphorus, and orthophosphorus) collected in the Fraser River Basin from October 1991 through September 2000 were analyzed for either total or dissolved concentrations. In general, most samples collected before calendar year 1992 were analyzed for total nutrients. From water year 1993 through 2000, water-quality samples were analyzed for dissolved nutrients. Total and dissolved concentrations only were determined for phosphorus from samples collected for the same sampling event. At sites where total and dissolved nutrient samples were collected over time, the data were aggregated for statistical analysis using the methods outlined in Mueller and others (1995). Unless otherwise specified, concentrations in this report represent aggregated concentrations.
Specific properties and constituents compared to applicable State standards include pH, dissolved oxygen, fecal coliform bacteria, un-ionized ammonia, nitrite plus nitrate, and chloride. A summary of water-quality data for selected constituents is in tables 2 and 3. Analysis of the data for this report indicates that water quality in the Fraser River Basin is generally very good and compares favorably to State standards.
In general, pH measurements from the study sites were within the State standard range of 6.5–9. At site 4, the pH measurements were greater than the maximum State standard for less than 10 percent (29) of the total number (307) of measurements taken. Compliance with State standards, however, is determined by comparing the 15th and 85th percentiles of the representative water-quality data with the associated water-quality standard. For site 4, the 15th and 85th percentile values for pH were equal to 7.6 and 8.8, respectively, which is within the range of 6.5–9. Dissolved-oxygen concentrations for all sites and samples exceeded the State standard for the Fraser River Basin set at a minimum of 6.0 mg/L (milligrams per liter). This is an indication that there were no detrimental processes taking place in the streamwater that would consume oxygen beyond a threshold that would make the water toxic to many aquatic species.
Fecal coliform bacteria samples were collected at 9 of the 13 study sites. The State standard for fecal coliform in the Fraser River Basin is 200 cols/100 mL (colonies per 100 milliliters), with compliance defined as when the geometric mean of all representative water samples at a site does not exceed the standard. The geometric mean for all nine sites ranged from 1.6 to 10.5 cols/100 mL. A few samples exceeded the State standard at sites 7, 8, and 9 during the summer. The larger concentrations may be attributed to reduced streamflows and increased recreational use, or the presence of livestock near the headwaters of these tributaries, or both.
Un-ionized ammonia (NH3) concentrations were calculated from ammonium (NH4+) concentrations for all sites where dissolved ammonia, temperature, and pH data were collected. The percentage of ammonium ion concentration that is in the un-ionized form is a function of the pH and water temperature at the time of sample collection. Because the un-ionized form of ammonia is the most toxic to aquatic life, it is the one on which stream standards are based. The chronic State standard for un-ionized ammonia for the Fraser River Basin is set at 0.2 mg/L. The acute State standard for un-ionized ammonia is defined as a table value standard (TVS) (Colorado Water Quality Control Commission, 2001) and is a function of the pH and temperature of the water. The acute TVS concentration for un-ionized ammonia was calculated for each sample and compared to the calculated un-ionized ammonia concentration. Un-ionized ammonia concentrations in all streamwater samples did not exceed the calculated acute TVS or chronic standard.
State standards for nitrite plus nitrate (as nitrogen) and chloride in the Fraser River Basin are 10 mg/L and 250 mg/L, respectively, and concentrations did not exceed the standards at any site. The maximum concentration for nitrite plus nitrate for all samples was 0.88 mg/L at site 4. The maximum concentration of chloride for all samples was 75 mg/L at site 1. The highest concentrations for chloride were at site 1 for samples collected during the early spring. The high concentrations at site 1 may result from spring runoff flushing salts from the accumulated road gravel/salt applications on Berthoud Pass during the winter.
National or local standards for total phosphorus or orthophosphorus concentrations in streamwater have not been established, although the U.S. Environmental Protection Agency (USEPA) has set a recommended maximum concentration of 0.1 mg/L of total phosphorus for flowing water that does not directly discharge into a lake or reservoir (U.S. Environmental Protection Agency, 1986). Total phosphorus concentrations exceeded the guideline at three sites (sites 5, 10, and 12) during the period of record for this study in one or two samples per site. At site 4, 58 percent (18 of 31 samples) of the samples collected exceeded the guideline. These large concentrations primarily happened during February through March, before spring runoff.
Currently (2002), the USEPA is revising its guidelines on nutrient concentrations in streams and rivers to focus on more regionally dependent recommendations for the prevention of eutrophication, or the excessive growth of aquatic plants.
To spatially represent the condition of the streamwater quality in the Fraser River Basin, rankings of median concentrations for the nutrient constituents (ammonia, nitrite plus nitrate, dissolved phosphorus, orthophosphorus, and total phosphorus) and chloride were plotted in map form (fig. 2). The median concentrations at each site were compared to the 25th, 50th, and 75th percentiles of all data collected during the study in order to assess the spatial variance for each constituent.
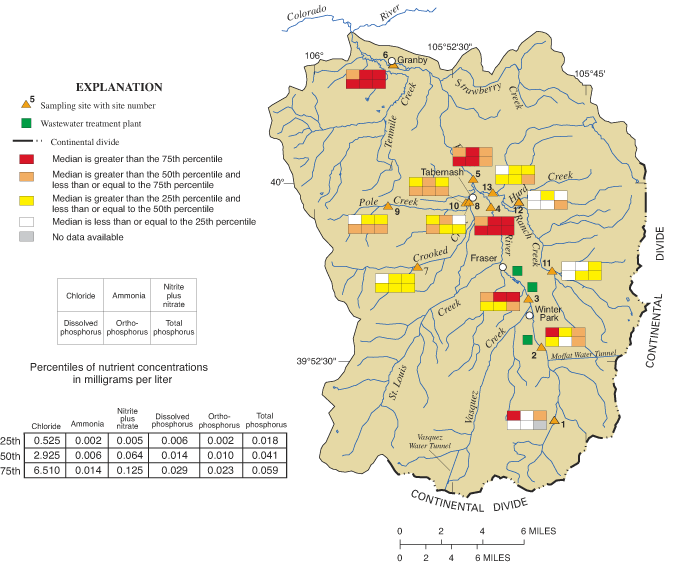
Nutrient concentrations in the Fraser River increased downstream as water flowed through the towns of Winter Park and Fraser. The most likely sources of these nutrients are the three wastewater-treatment plants that discharge effluent into the Fraser River. Some dilution and possible uptake by biological processes of nitrite plus nitrate and dilution of total phosphorus occurred downstream from the mouths of Ranch and Crooked Creeks where nutrient concentrations were lower than the Fraser River. At the most downstream site near Granby (site 6), concentrations of nitrite plus nitrate and total phosphorus were large, indicating that nutrient input exceeded the physical, chemical, and biological processes that tend to decrease nutrient concentrations and may be influenced by the agricultural land use that is prevalent in the lower part of the basin.
Chloride concentrations were highest in the upper reaches of the Fraser River and tended to decrease downstream. Tributaries to the Fraser River had the lowest chloride concentrations and contributed to the dilution of chloride as water traveled downstream. A likely source for the chloride in the upper reaches of the Fraser River is road salts applied with gravel for traffic safety.
In addition to concentrations, chemical loading also was evaluated for selected water-quality constituents. Although concentration data are useful for comparison to water-quality standards, loading data indicate the mass of a chemical transported past a site. Loading information is necessary for the State Total Maximum Daily Load (TMDL) process and can be useful in understanding chemical deposition in downstream surface-water storage features. Loads only were calculated at sites 1 through 5 on the main stem of the Fraser River. Many possible irrigation diversions exist between sites 5 and 6 and could give rise to erroneous loading values. Values for constituent loading were calculated by multiplying the instantaneous chemical concentration by the instantaneous discharge. Loading values then were multiplied by a conversion factor to yield values in tons per day. Median instantaneous loads were calculated for samples at each site from all data for the period of record.
Analysis of the instantaneous load data on the main stem of the Fraser River showed similar results to the concentration data: the majority of the inputs of nutrients in the streamwater was between sites 3 and 4 (fig. 3). The reduction of nitrite plus nitrate and orthophosphorus loads downstream from site 4 indicated that physical, chemical, or biological processes that remove nutrients from the streamwater were greater than input sources. The continual increase in total phosphorus load may be a result of increased sediment loads in the river, which are commonly high in insoluble phosphorus. Data collected for chloride show that about one-third of the total load of chloride in the entire Fraser River is present by the time the water reaches site 1. The gradual increase in loads may be an indication of ground-water discharge to the stream, inputs from the wastewater-treatment plants, and inputs from tributaries.
In order to assess the monthly loading of nutrients and chloride in the Fraser River, median instantaneous loads for all monthly data from site 4 are shown in figure 4. This site is used because monthly samples are available for the entire period of study, and the site is located downstream from the wastewater-treatment plants. Monthly median stream discharge is included in figure 4 to show the relation between loads and streamflow conditions. Peak nutrient loads began in early spring before the onset of spring runoff, and loadings to the Fraser River were largest between January and May. The large loads in the Fraser River between January and May most likely resulted from the increased seasonal population and associated inputs to the wastewater-treatment plants during the ski season. With the onset of high flow at the end of the ski season, loads decreased significantly. Chloride loading, however, seems to more closely reflect streamflow conditions. This scenario supports the concept that the source of chloride in the river is a combination of a nonpoint source, possibly from the salt and gravel applications on the roadways in the basin and discharges from the wastewater-treatment plants. The reduction in loads during early spring runoff is an indication that either most of the road salts are removed during initial runoff or runoff from near the highway is reduced.
The seasonal Kendall test (Helsel and Hirsh, 1992) was used to test for trends in water quality (table 4). Trend analysis was completed on sites 1–4 on the main stem of the Fraser River. These sites had at least 5 years of monthly data. Trend analysis was performed on ammonia, nitrite plus nitrate, and orthophosphorus because these constituents are directly related to biological responses in the river. The null hypothesis for trend testing in this report is no change in concentration over time when compared seasonally. The null hypothesis is rejected, indicating that there is a trend, if the p-value (or probability value) of the test is less than the alpha level, which for this report is set at 0.05. This alpha level (or acceptable error) requirement means that there is a 5-percent chance that a trend is mistakenly identified and the null hypothesis is true (Helsel and Hirsch, 1992). Trend analysis was done on the raw, or unadjusted, concentrations to assess trends in ambient stream conditions, which is desirable in relation to human or aquatic organism water use. Where applicable, a LOcally WEighted Scatterplot Smoothing (LOWESS) procedure (Cleveland, 1979) was used to flow-adjust concentrations before trend analysis. This procedure will account for variability of chemical concentrations due to streamflow (flow) and provide greater insight about the sources of nutrients to the Fraser River. The LOWESS smoothing procedure and recalculation of trends were performed only on data sets that contained less than 10 percent censored (less than the laboratory minimum reporting level) concentrations. If a trend was calculated on the flow-adjusted concentrations, the trend slope (the magnitude of the trend expressed in units per year) was listed only to indicate relative magnitude because the trend analyses for these sites were computed on flow-adjusted concentrations and not the raw concentrations. Where some of the concentrations were censored (below the laboratory reporting level), trend analyses on the raw data were performed twice at each site, once with the censored data set at the minimum reporting level and again with the censored data set to zero. In all cases, the two trend slopes were almost identical, indicating little sensitivity to the trend analysis because of the censored data.
[mg/L, milligrams per liter; (mg/L)/yr, milligrams per liter per year; <, less than; --, no data]
| Site number (fig. 1) | Site name | Span of trend analysis | Number of analyses | Number of censored analyses | Minimum reporting level (mg/L) | Data used in trend analysis | p-value of tau test | Trend direction | Slope [(mg/L)/yr] | Median concentration (mg/L) |
|---|---|---|---|---|---|---|---|---|---|---|
| Ammonia | ||||||||||
| 3 | Fraser River below Vasquez Creek at Winter Park, CO | 1991–2000 | 108 | 22 | < 0.002 | Raw | 0.0001 | Down | –0.002 | 0.018 |
| 4 | Fraser River at Tabernash, CO | 1991–2000 | 108 | 10 | < 0.002 | Raw Flow-adjusted |
0.1137 0.4003 |
None None |
-- -- |
0.058 |
| Nitrite plus nitrate | ||||||||||
| 1 | Fraser River at Upper Station, near Winter Park, CO | 1995–2000 | 61 | 2 | <0.005 | Raw Flow-adjusted |
0.0032 0.0238 |
Up Up |
0.0057 0.007 |
0.084 |
| 2 | Fraser River below Buck Creek at Winter Park, CO | 1991–2000 | 100 | 2 | <0.005 | Raw Flow-adjusted |
0.0341 0.1335 |
Down None | –0.0023 -- |
0.078 |
| 3 | Fraser River below Vasquez Creek at Winter Park, CO | 1991–2000 | 103 | 1 | <0.010 | Raw Flow-adjusted |
0.2056 0.9210 |
None None |
-- -- |
0.141 |
| 4 | Fraser River at Tabernash, CO | 1991–2000 | 105 | 1 | <0.005 | Raw Flow-adjusted |
0.2255 0.0414 |
None Up |
-- 0.007 |
0.174 |
| Orthophosphorus | ||||||||||
| 3 | Fraser River below Vasquez Creek at Winter Park, CO | 1995–2000 | 61 | 7 | <0.001 | Raw | 0.0125 | Up | 0.001 | 0.010 |
| 4 | Fraser River at Tabernash, CO | 1995–2000 | 66 | 0 | --- | Raw Flow-adjusted |
0.0076 0.0627 |
Up None |
0.004 -- |
0.052 |
Trend analyses for ammonia at sites 1 and 2 were not done because of the large number (greater than 20 percent) of censored concentrations. Only site 3 had a statistically significant trend for ammonia and showed a downward trend in concentration for 1991–2000.
Nitrite plus nitrate trend analysis revealed two sites (sites 1 and 4) with upward trends, although not over the same time period, and one site (site 2) with a downward trend. The upward trends at site 1 on both the raw and flow-adjusted data are likely due to an increase in nitrite plus nitrate sources in the upper reaches of the Fraser River. Because the period of record for site 1 is different from the other three sites, a direct relation in the trend for site 1 cannot be made with the other three sites. The trend analysis at site 2 resulted in a downward trend on the raw data and no trend on the flow-adjusted data. Site 2 results indicate that the inputs of nitrite plus nitrate to the Fraser River above site 2 are not changing, but some other factor, such as streamflow, chemistry, or biological uptake, is causing the concentrations to decrease. The trend results from site 4 show the opposite conditions. Although there is an upward trend for the flow-adjusted data, indicating a possible increase in the input of nitrite plus nitrate to the stream, the raw concentrations remain stable. Trend analysis on streamflow measurements at site 4 indicate an upward trend, and this relation may be caused by site 4 being located downstream from the three wastewater-treatment plants.
Trend analysis was not done for orthophosphorus at sites 1 and 2 because of the large number (greater that 20 percent) of censored concentrations. Results for the trend analyses at sites 3 and 4 indicate upward trends in the orthophosphorus concentrations at both sites. The lack of a trend for the flow-adjusted orthophosphorus concentrations at site 4 indicates that the upward trends may be caused by streamflow conditions and not increases in orthophosphorus inputs to the river.
In general, the water in the Fraser River Basin is of good quality and compares favorably with State standards. A few pH values were greater than State standards, and even in these instances, the river was not out of compliance because of the limited number of exceedances. Un-ionized ammonia, nitrite plus nitrate, and chloride concentrations did not exceed any applicable State standard. Concentrations and loads of nutrients increased downstream; the largest inputs into the river were between Fraser River below Vasquez Creek at Winter Park (site 3) and Fraser River at Tabernash (site 4). Wastewater-treatment-plant discharges enter the Fraser River upstream from site 4. Median monthly loading data for nutrients and chloride indicate that the largest nutrient and chloride loading happens during early spring before the onset of spring runoff.
Seasonal Kendall trend results indicate downward trends for ammonia concentration at Fraser River below Vasquez Creek at Winter Park (site 3) during the period of this study. Nitrite plus nitrate concentrations had upward trends at Fraser River at Tabernash (site 4) for the available data during 1995 through 2000. Results from the trend testing on nitrite plus nitrate concentrations during 1991 through 2000 at Fraser River below Buck Creek (site 2) had a downward trend and Fraser River at Tabernash (site 4) had an upward trend. Concentrations of orthophosphorus showed consistently upward trends at both the Fraser River below Vasquez Creek at Winter Park and Fraser River at Tabernash sites.
Apodaca, L.E., and Bails, J.B., 1999, Fraser River watershed, Colorado—Assessment of available water-quantity and water-quality data through water year 1997: U.S. Geological Survey Water-Resources Investigations Report 98–4255, 58 p.
Cleveland, W.S., 1979, Robust locally weighted regression and smoothing scatterplots: Journal of the American Statistical Association, v. 74, p. 829–836.
Colorado Water Quality Control Commission, 2001, June 30 (2001) Classifications and numeric standards for Upper Colorado River Basin and North Platte River (Planning Region 12) Regulation 33: Colorado Department of Public Health and Environment, Water Quality Control Commission [variously paginated].
Colorado Water Quality Control Division, 1989, Colorado nonpoint assessment report: Denver, Colorado Department of Public Health and Environment, 189 p.
Fishman, M.J., ed., 1993, Methods of analysis by the U.S. Geological Survey National Water Quality Laboratory—Determination of inorganic and organic constituents in water and fluvial sediments: U.S. Geological Survey Open-File Report 93–125, 217 p.
Fishman, M.J., and Freidman, L.C., eds., 1989, Methods for determination of inorganic substances in water and fluvial sediments: U.S. Geological Survey Techniques of Water-Resource Investigations, book 5, chap. A1, 545 p.
Helsel, D.L., and Hirsch, R.M., 1992, Statistical methods in water resources: Amsterdam, The Netherlands, Elsevier, 522 p.
Mueller, D.K., Hamilton, P.A., Helsel, D.R., Hitt, K.J., and Ruddy, B.C., 1995, Nutrients in ground water and surface water of the United States—An analysis of data through 1992: U.S. Geological Survey Water Resources Investigations Report 95–4031, 74 p.
U.S. Census Bureau, 2001, Grand County QuickFacts from the U.S. Census Bureau, accessed March 14, 2002, at http://quickfacts.census.gov/qfd/states/08/08049.html
U.S. Environmental Protection Agency, 1986, Quality criteria for water, 1986: Washington, D.C., U.S. Environmental Protection Agency Report 440/5–86–001, Office of Water [variously paginated].
U.S. Geological Survey, 1999, National field manual for the collection of water-quality data: U.S. Geological Survey Techniques of Water-Resources Investigations, book 9, chaps. A1–A9, two volumes [variously paged].
Western Regional Climate Center, 2001, Colorado climate summaries, accessed September 28, 2001, at http://www.wrcc.dri.edu/summary/climsmco.html
Document Accessibility: Adobe Systems Incorporated has information about PDFs and the visually impaired. This information provides tools to help make PDF files accessible. These tools convert Adobe PDF documents into HTML or ASCII text, which then can be read by a number of common screen-reading programs that synthesize text as audible speech. In addition, an accessible version of Acrobat Reader 6.0, which contains support for screen readers, is available. These tools and the accessible reader may be obtained free from Adobe at Adobe Access.
| AccessibilityFOIAPrivacyPolicies and Notices | |
 |
|
| AccessibilityFOIAPrivacyPolicies and Notices | |
| |
|